

Abstract
Objective:
The exposure to artificial light at night (ALAN) disrupts the biological rhythms and has been associated with the development of metabolic syndrome. MicroRNAs (miRNAs) display a critical role in fine-tuning the circadian system and energy metabolism. In this study, we aimed to assess whether altered miRNAs expression in the liver underlies metabolic disorders caused by disrupted biological rhythms.
Results:
We found that C3H/HePas mice exposed to ALAN developed obesity, and hepatic steatosis, which was paralleled by decreased expression of Rev-erbα and upregulation of its lipogenic targets ACL and FAS in liver. Furthermore, the expression of Rev-erbα-targeting miRNAs, miR-140–5p, 185–5p, 326–5p and 328–5p were increased in this group. Consistently, overexpression of these miRNAs in primary hepatocytes reduced Rev-erbα expression at the mRNA and protein levels. Importantly, overexpression of Rev-erbα-targeting miRNAs increased mRNA levels of Acly and Fasn.
Conclusion:
Thus, altered miRNA profile is an important mechanism underlying the disruption of the peripheral clock caused by exposure to ALAN, which could lead to hepatic steatosis.
Keywords: Clock genes, De novo lipogenesis, Exposure to artificial light at night, Hepatic steatosis, microRNAs
1. Introduction
In mammals, physiological and behavioral processes display a robust circadian rhythm. These daily oscillations are orchestrated by the intrinsic biological clock in the suprachiasmatic nucleus (SCN) located in the hypothalamus [1, 2]. This central clock is the master pacemaker that generates the rhythmic signals to synchronize the clock machinery in the peripheral tissues, via autonomic nervous system, hormones secretion and temporal patterns of food intake [3, 4]. The SCN is mainly entrained by light and, through this photic information, the central clock maintains the oscillatory physiological and behavioral processes coupled to light/dark cycles [5, 6].
At the molecular level, a complex circuitry of transcriptional/ translational regulatory loops maintains the central and peripheral clocks. In the core loop, the circadian locomotor output cycles kaput (CLOCK) and brain and muscle ARNT-like1 (BMAL1), heterodimerize and activates the expression of Period (Per) and Cryptochrome (Cry) genes. PER and CRY protein complexes, accumulate in the nucleus and inhibit CLOCK/BMAL1-mediated transcription [7]. Additionally, the BMAL1:CLOCK activates the transcription of the nuclear receptors Rev-erbα and Rora, which in turn represses and induces the Bmal1 expression, respectively [8, 9].
In peripheral tissues, such as liver, the circadian system is closely related to the oscillatory pattern of energy metabolism, since the clock genes regulate the rhythmic expression of genes involved in gluconeogenesis, fatty acid oxidation, and de novo lipogenesis (DNL) [10–13]. Accordingly, some studies have demonstrated that Reverbα displays a critical role in the interplay between the circadian system and metabolism, due to its direct regulatory action on the Phosphoenolpyruvate carboxykinase 1 and Glucose 6-phosphatase, key gluconeogenic genes [14], and lipogenic genes, including ATP-citrate lyase (Acly) and Fatty acid synthase (Fasn) [15].
The circadian disruption caused by exposure to artificial light at night (ALAN), in shift-workers and short sleepers, has emerged as a new risk factor for the development of obesity, cardiovascular diseases and the metabolic syndrome [16–18]. Besides, the widespread use of electric light in the modern societies has been also linked to impaired metabolic health in standard living humans [19]. The deleterious effects induced by exposure to ALAN have also been studied in animal models of shift-work [20]. Mice exposed to ALAN exhibited increased body weight gain, decreased insulin sensitivity, and altered timing of food intake [21, 22]. Moreover, exposure to dim light at night also disrupts the biological rhythms including the expression of clock genes in peripheral tissues [23]. However, it remains unclear by which mechanisms the exposure to ALAN leads to disruption of peripheral clock, and how this misalignment could be involved in the metabolic disorders caused by nighttime light exposure.
MicroRNAs (miRNAs) are small non-coding RNAs comprising approximately 22 nucleotides in length. Mature miRNAs associated with components of the RNA-induced silencing complex (RISC) bind in the seed sequence located in the 3`UTR region of target mRNAs and mediate mRNA degradation or translational repression [24]. It has been shown that various miRNAs display a key role in the regulation of glucose and lipid metabolism, as well as insulin sensitivity [25, 26]. Consequently, altered expression of miRNAs is related to development of obesity and type 2 diabetes [27, 28]. Increasing evidence indicates that miRNAs may exhibit daily oscillatory pattern of expression, contributing to the circadian expression of molecular clocks and metabolic genes in peripheral tissues [29, 30]. Importantly, rhythmic expression of miRNAs can be induced by photic entrainment cues within the SCN [31] and in mammary tissue [32]. In line with this notion, circadian disruption induced by changing the photoperiod exposure alters the expression of multiples miRNAs in mammary tissue, which are involved in the development of breast cancer [32]. Despite the close relation between miRNAs, circadian system, and energy metabolism, it is still unknown whether disruption in circadian rhythms, leading to development of metabolic disorders, could be triggered by altered expression of miRNAs.
2. Methods
2.1. Animal model
Weaned male C3H/HePas mice, were obtained from a breeding colony at UNICAMP (University of Campinas, Campinas, Brazil). The mice were acclimated in a specific cabinet during four weeks, in 12:12 h light/dark cycles and were randomly assigned to either a Light/Dark (L/D) group, whose mice were maintained on standard 12:12 light/dark cycles (lights on at 6hr/ lights off at 18hr), and the Light/Light (L/L) group, whose mice were exposed to ALAN (12:12 light/light condition). Both groups were housed at a temperature of 22°C, with free access to regular chow diet and water. After eight weeks, mice at 4 months old were euthanized in a chamber with CO2, at 8hr and 20hr (Zeitgeber Time -ZT 2 and 14 for the L/D group). Blood was collected and centrifuged and the plasma samples were stored at −80°C. Liver samples were also collected, snapped frozen, and stored at −80°C. All experiments were carried out in accordance with the protocols approved by the Institutional Ethical Committee at UNICAMP (ethical n° 3246–1).
2.2. Insulin tolerance test (ipITT) and Food intake
After fasting for two hours, ipITTs were performed at 8hr and 20hr. Baseline glycaemia was measured by a glucometer (Accu-Chek Advantage, Roche, Mannheim, Germany), and the mice received, intraperitoneally, 1.0 U/Kg body weight of human recombinant insulin (Humulin, Indianapolis, USA). Blood glucose was monitored at three, six, nine, 12, and 15 minutes after insulin administration. Next, the constant of glucose decay (kITT) was calculated as previously described [33]. For food intake, the mice were individually placed in chambers and, after 24h of adaptation, the food consumption was measured at 6hr and 18hr.
2.3. Biochemical plasma and blood markers
Blood glucose concentrations were measured from the tail tip of the mice using a glucose analyzer (Accu-Chek Performa, Roche Diagnostic, Switzerland). Plasma cholesterol and triglycerides (TG) levels were measured using colorimetric standard commercial kits, according to the manufacturer’s instructions (Roche/Hitachi®; Indianopolis, USA, and Wako®; Richmond, USA, respectively). Plasma was also used for insulin measurement by radioimmunoassay [34]. All biochemical parameters were measured in fed state at 8hr and 20hr.
2.4. Locomotor activity
The mice were individually placed in chambers containing an optical beam sensor system and allowed for adaptation during 24hr. Subsequently, the locomotor activity was measured during 48hr using the PheCOM system (Pan Lab/Harvard Instruments, Barcelona, Spain).
2.5. Urinary 6-sulfatoxymelatonin (6-SML)
Mice from both groups were placed in a special chamber and, after 24hr of adaptation, the urine was collected between 18hr and 6hr. Then, the 6-SML was quantified using an ELISA kit according to the manufacturer’s instructions (IBL, Mannedorf, Switzerland).
2.6. Histological analysis of liver and adipose tissue
After euthanasia, liver and perigonadal adipose tissue fragments were collected and fixed in phosphate-buffered saline (PBS) containing 4% formaldehyde for 24hr at room temperature. Samples were washed 3x with PBS and maintained in 70% etOH at 4°C. Tissues were embedded in paraffin, sectioned and stained with hematoxylin-eosin. Adipocyte diameter was determined using the ImageJ software (National Institutes of Health, MD, USA) by averaging counts from approximately 70 cells (± 20 cells) / section, 3 sections per sample.
2.7. Hepatic lipid content
Liver samples were also collected to extract hepatic lipids through the Folch’s method [35]. The extract was evaporated and diluted in isopropanol. Then, the measurement of triglycerides and cholesterol was performed according to the manufacturer’s instruction (Roche, Mannheim, Germany).
2.8. Analysis of mRNA and miRNAs expression
For the real-time PCR analysis, total RNA from liver was reverse transcribed using the High Capacity cDNA Reverse Transcription kit (Applied Biosystems, Foster City, USA). The SYBR-green master mix (Applied Biosystems) was used in the qPCR reactions. The relative expression of mRNAs was determined after normalization with 36B4, using the 2−ΔΔCt method. For the miRNAs analysis, the total RNA was reverse transcribed using the miRScript II kit (Qiagen, Hilden, Germany), and the qPCR reactions were performed using the miScript Sybr Green PCR kit (Qiagen, Hilden, Germany). The relative expression was normalized to U6 using the 2−ΔΔCt method. The sequences of the genes and the miRNAs are in the Supplementary Table 1.
2.9. Primary Hepatocyte Culture
Mice were anesthetized with pentobarbital (75 mg/kg, i.p.). Hank’s buffer containing collagenase IV (0.5 mg/mL) was perfused via the portal vein and, after the liver was removed, the cells were dispersed and filtrated. Hepatocyte suspensions were washed with a new Hank’s buffer and, after centrifugation, the Percoll solution was added to reduce the amount of non-parenchymal cells. Cell viability was determined using trypan blue dye, and only the cells with viability values higher than 85% were used for experiments. The hepatocytes were plated in William Medium containing 10% FBS and incubated at 37°C in a 5% CO2 atmosphere.
2.10. Transfection with miRNA mimics
The primary hepatocyte culture was transfected with 50nM miRNA mimics (140–5p, 185–5p, 326–5p, and 328–5p) or a control mimic (Dharmacon, Colorado, USA), using the DharmaFECT-I reagent, according to manufacturer’s instructions. Then, the hepatocyte was synchronized using DMEM/F12 with 50% horse serum and, after two hours, this medium was replaced by a fresh DMEM/F12 containing 0.5% FBS. Cells were collected at CT36 and stored at −80°C.
2.11. 3′untranslated region (UTR) reporter plasmids and luciferase assays
The 3’UTR Rev-erbα region was amplified via PCR from mice cDNA and cloned to the pmiR-GLO luciferase vector (Promega, Wisconsin, USA). Mutant sequences, specific for each miRNA-binding site, were also generated and added to the vector. The Reverbα 3’UTR luciferase vector and miRNA mimics were co-transfected into HEK293 cells at the amount of 100ng and 50nM, respectively, using the DharmaFECT-dual reagent (Dharmacon, Colorado, USA). The cells were lysed after 48h, and luciferase measurement was performed using Dual-Luciferase Report Assay (Promega) according to the manufacturer’s instructions.
2.12. Western Blot
For the SDS-PAGE and Western blot analysis, the total protein extract from liver and primary hepatocyte culture, were treated with a Laemmli sample buffer, and after heating to 95 ºC for 5 minutes, 30μg of protein were separated by electrophoresis in a gel at 10%. Next, the gel was transferred to a polyvinylidene difluoride membrane and blocked with 5% non-fat dry milk buffer during two hours. The membranes were then incubated with a polyclonal antibody against ACL (Cell Signaling, Catalog n° 4332S); FAS (Cell Signaling, Catalog n° 3189S); p-ACC (Cell Signaling, Catalog n° 3661S); ACC (Cell Signaling, Catalog n° 3662S); and REV-ERBα (Abcam, Catalog n° 174309, dilution 1:1000). VINCULIN (Sigma, Catalog n° V9264, dilution 1:1000) or α-TUBULIN (Santa Cruz, Catalog n° SC-8035) was used as a control of the experiments. Detection of the protein signal was performed after 1h incubation with a secondary property antibody by the chemiluminescence method. The band intensities were quantified using ImageJ software (National Institute of Mental Health, USA).
2.13. Statistical analysis
Data are shown as the mean ± SEM. To analyze the effects of exposure to ALAN between the time points and groups, two-way ANOVA was performed and, where the F-value was significant (p<0.05), a post hoc Tukey test correction was performed through Statistica 5 (Statsoft, Tulsa, USA). For the other experiments, the statistical analysis used was the Student’s t-test, where the t-score was p<0.05.
3. Results
3.1. Exposure to ALAN disrupts the biological rhythms
After eight weeks, mice on standard 12hr light/dark cycles displayed a typical daily rhythm of locomotor behavior and food intake, with higher activity and food consumption during nighttime (Fig. 1A-C). Despite having similar total activity and food intake, the mice housed in constant light (L/L group, modeling ALAN) exhibited a disrupted pattern for these behaviors such that cage activity and food intake, between 6 – 18hr, were higher compared to the L/D group at the same period (Fig. 1A-C). In addition, the L/L group showed decreased locomotor activity between 18 – 6hr compared to the L/D at the same period. It has been reported that urinary levels of 6-sulfatoxymelatonin (6-SML), a stable derivative of the circadian pacemaker hormone melatonin, can be used as an indicator of the circadian system integrity [36]. Urine from the L/L group had significantly lower levels of 6-SML between 18 – 6hr compared to the same period in the L/D group (Fig. 1D). These results indicate that exposure to ALAN leads to misalignment of daily biological rhythms.
Figure 1. Exposure to artificial light at night (ALAN) disrupts the biological rhythms.
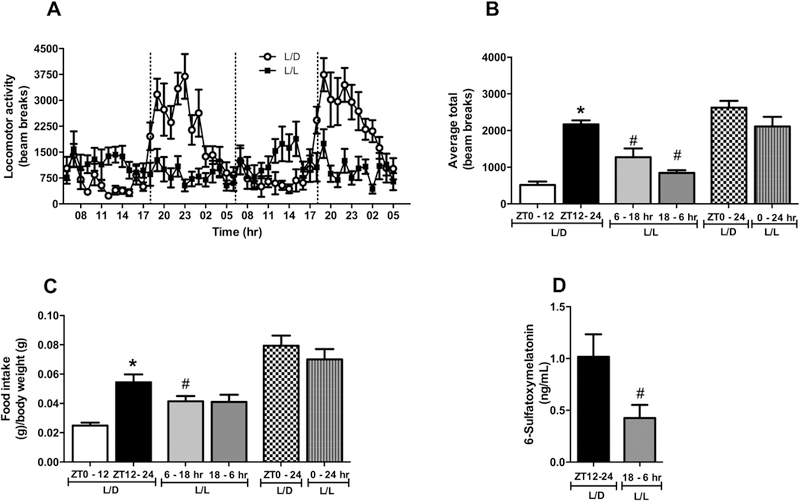
Mice were kept on standard light/dark cycles (lights on at 6hr/lights off at 18hr) or exposed to artificial light at night during 8 weeks. Then (A) Locomotor activity during 24 hours; (B) Average of locomotor activity measured in beam breaks; and (C) Food intake was evaluated. Data are expressed as the mean ± S.E.M., n= 7–9 mice. Two-way ANOVA with post hoc Tukey test correction was used. *p<0.05 vs ZT0–12 or 6–18 hr; #p<0.05 vs L/D group. The (D) Urinary 6-sulfatoxymelatonin was also measured. Data are expressed as the mean ± S.E.M., n= 7–9 mice Student t-test was used. #p<0.05 vs L/D group.
3.2. Exposure to ALAN leads to development of obesity, dyslipidemia and insulin resistance
Previous studies have shown that disruption of daily rhythmic patterns predisposes to the development of metabolic diseases in humans and animal models [11, 13]. In this study, we found that mice exposed to ALAN showed increased body and fat pads weights, compared to L/D group (Fig. 2A-C). Histological examination revealed adipocyte hypertrophy in perigonadal adipose tissue of L/L group compared to L/D (Fig. 2D). When given a physiological dose of insulin at different time points, L/D mice showed daily oscillation in the peripheral insulin sensitivity, with higher glucose disposal at ZT14 (Fig. 2E-F). L/L mice, however, showed loss of the physiological increase of insulin sensitivity at 20hr compared to ZT14 in L/D mice (Fig. 2E-F). Blood glucose and plasma insulin levels showed daily variation during the light/dark cycle in L/D mice, being increased at ZT14 compared to ZT2. However, this increase was not seen in L/L mice (Table 1). Although, plasma TG levels did not show difference between times analyzed for both groups, L/L mice showed increased TG levels at 20hr compared to L/D at ZT14 (Table 1). No differences were found in plasma cholesterol levels. Thus, disruption of biological rhythms by exposure to ALAN predisposes to the development of obesity, hypertriglyceridemia and peripheral insulin resistance.
Figure 2. Exposure to ALAN leads to the development of obesity and insulin resistance.
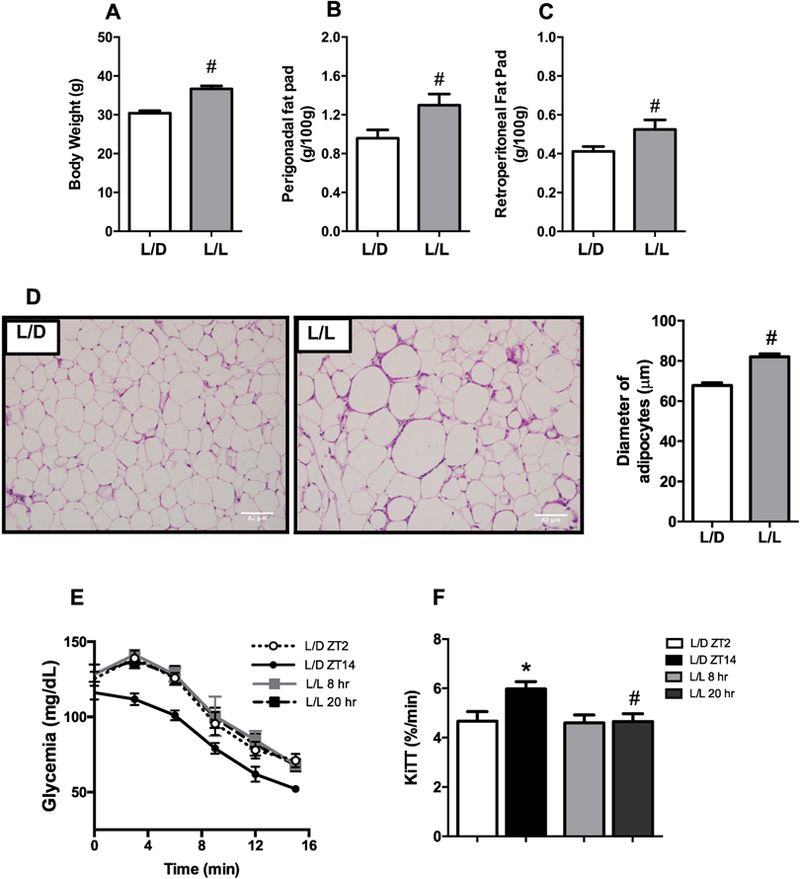
Mice were kept on standard light/dark cycles (L/D) or exposed to artificial light at night (L/L) for eight weeks. After this period, the (A) Body, and (B) Perigonadal and (C) Retroperitoneal fat pad weights were measured (n=7–9), as well as the (D) Diameter of adipocytes from the perigonadal adipose tissue (n=4). We also performed (E) ip Insulin Tolerance Test on these mice and calculated the (F) glucose decay constant (KiTT) (n=7–9). Data are expressed as the mean ± S.E.M. The student’s t-test was used to analyze the biometric parameters and diameter of adipocytes. For the KiTT, two-way ANOVA with post hoc Tukey test correction was used. *p<0.05 vs ZT2 or 8hr; #p<0.05 vs L/D group.
Table 1:
Plasma and Blood biochemical markers measured in the fed state in L/D mice at ZT2 and ZT14 and in L/L mice at 8hr and 20hr.
| L/D | L/L | |||
|---|---|---|---|---|
| ZT 2 | ZT 14 | CT 2 | CT 14 | |
| Cholesterol (mg/dL) |
157.1±14.16 | 163.1±13.4 | 196.1 ±16.41 | 186.1±19.28 |
| Triglycerides (mg/dL) |
248.1±26.29 | 187.1±23.40 | 283.3±29.01 | 381.8±58.94# |
| Glycemia (mg/dL) |
129.0±2.16 | 147.3±4.19* | 137.9±3.21 | 138.7±4.77 |
| Insulinemia (ng/mL) |
1.82±0.40 | 6.06±0.58* | 3.06 ±0.89 | 5.05±083 |
Data are expressed as the mean ± S.E.M. n=7–9. Two-way ANOVA with post hoc Tukey test correction was used.
p<0.05 vs ZT2 or 8hr
p<0.05 vs L/D group.
3.3. Exposure to ALAN alters hepatic lipid metabolism
Next, we investigated whether ALAN-induced obesity was also associated with ectopic lipid accumulation. Histological examination of the livers from the L/L group revealed large lipid droplets, which was paralleled by increased TG levels compared to the L/D group (Fig. 3A-B). Liver cholesterol levels were comparable between groups (Fig. 3C). To evaluate if the increased hepatic lipid content was due to increased synthesis, we analyzed the expression of proteins involved in the DNL pathway. In livers from the L/D group, the expression of ATP-Citrate Lyase (ACL) and Fatty Acid Synthase (FAS) varied during the dark/light cycle, with higher expression at ZT14 than at ZT2 for both proteins (Fig. 3D-E). However, in L/L livers, the levels of ACL and FAS were already increased at 8hr compared to ZT2 in L/D group, resulting in the loss of the difference between the times analyzed for the expression of both proteins (Fig. 3D-E). Phosphorylation of Acetyl-CoA Carboxylase (p-ACC) did not differ between times or light cycle regimen (Fig. 3D-E). Taken together, these results suggest that nighttime light exposure leads to alteration in lipogenic protein expression, contributing to the development of hepatic steatosis.
Figure 3. Exposure to ALAN leads to hepatic steatosis and altered expression of lipogenic proteins.
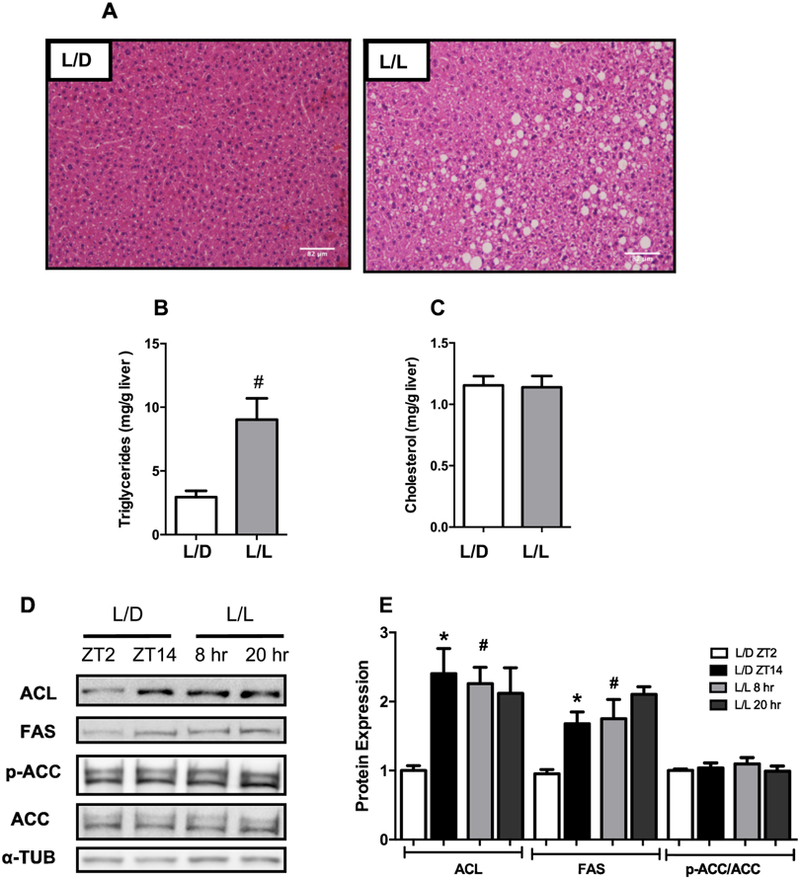
(A) H&E-stained liver sections (n=4), Hepatic (B) Triglycerides, and (C) Cholesterol levels (n=7–9); (D) Representative Western Blots and (E) Densitometric determination from proteins involved in de novo lipogenesis (n= 4–6). Data are expressed as the mean ± S.E.M. For the analysis of hepatic lipid levels, the Student’s t-test was used. #p<0.05 vs L/D group. Two-way ANOVA with post hoc Tukey test correction was used to analyze the protein expression. *p<0.05 vs ZT2 or 8hr; #p<0.05 vs L/D group.
3.4. The expression of clock genes in liver was disrupted in mice exposed to ALAN
Components of the molecular clock have been implicated in regulating ectopic lipid deposition through the DNL pathway [15, 37]. Thus, we evaluated the expression of clock components in L/D and L/L livers. Although Bmal1 mRNA levels did not differ between the periods assessed in both groups, the expression of this clock gene was reduced in the L/L group at 8hr, compared to the L/D at ZT2 (Fig. 4). Although both groups exhibited a similar pattern of Rev-erbα expression, the L/L group showed reduced expression of this clock gene at 8hr compared to ZT2 in L/D livers (Fig. 4). The mRNA levels of Per1 and Per2 genes varied between the light/dark cycles in L/D mice, whose expression was increased at ZT14 compared to ZT2 for both genes (Fig. 4). In contrast, the expression of Per1 and Per2 in the L/L group did not differ between the times analyzed, and the mRNA levels for both genes were increased at 8hr compared to the same time in the L/D group (Fig. 4). Besides, only the expression of Per2 decreased at 20hr in the L/L group compared to ZT14 in the L/D (Fig. 4). Importantly, the expression of the key canonical DNL regulators Srebp-1c, and Chrebp was not altered in mice exposed to ALAN (Supplementary Figure 1).
Figure 4. Exposure to ALAN leads to disruption of the expression of clock genes in the liver.
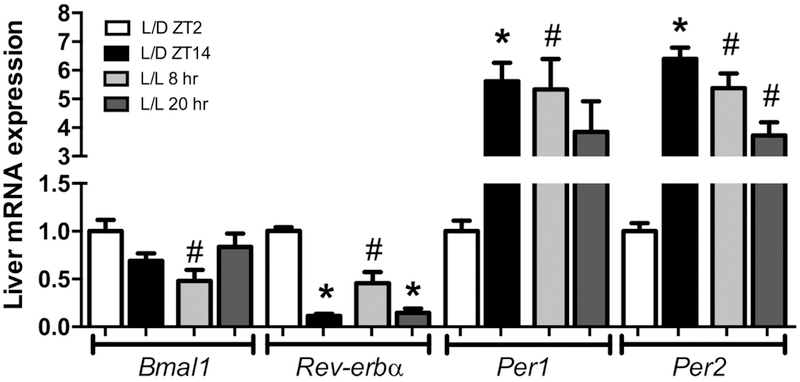
After eight weeks exposed or not to ALAN, the expression of Bmal1, Reverbα, Per1 and Per2 was evaluated in both groups. Data are expressed as the mean ± S.E.M., n= 5–9. Two-way ANOVA with post hoc Tukey test correction was used. *p<0.05 vs ZT2 or 8hr; #p<0.05 vs L/D group.
3.5. The exposure to ALAN alters expression of Rev-erbα-targeting miRNAs
Decreased expression of Rev-erbα and consequent impairment of the inhibitory effects of this clock gene upon lipogenic protein expression could explain, at least in part, the altered hepatic lipid metabolism in mice exposed to ALAN. Thus, we next sought to investigate the mechanisms underlying decreased expression of Rev-erbα. Previous studies have shown that microRNAs may modulate the expression of clock genes [29, 30] and, based on these findings, we used computational prediction algorithms, TargetScan, mirWalk, and DIANA-Tool, to screen for miRNAs with putative targeting specificity towards the 3’UTR region of Rev-erbα mRNA. We selected 4 miRNAs out of 11 potential candidates and assessed expression levels between the times and groups analyzed (Fig. 5A and Supplementary Figure 2). The expression of miR-140–5p, 1855p, 328–5p, and 326–5p increased at ZT14 compared to ZT2 in L/D group. In L/L mice, the expression of miR-140–5p, 185–5p, and 326–5p also increased at 20hr compared to 8hr. However, the expression of the four miRNAs increased at 8hr in the L/L group compared to L/D at same time. By contrast, only the expression of miR-328–5p was not different at 20hr in the L/L, compared to ZT14 in the L/D mice (Fig 5A). Supporting our hypothesis, the transfection of miR-140–5p, 185–5p, 326–5p, and 328–5p mimics in the primary hepatocyte culture led to reduced expression of Rev-erbα mRNA and protein levels (Fig. 5 B-C).
Figure 5. Exposure to ALAN leads to altered expression of several Rev-erbα–targeting miRNAs in liver.
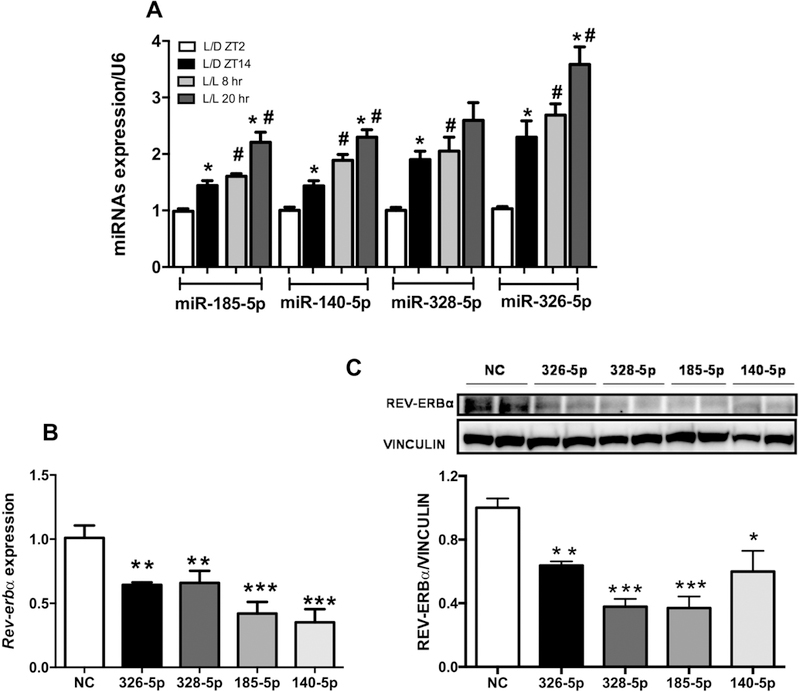
(A) Expression of altered miRNAs candidates in the liver from both groups, which were selected according to their scores. Data are expressed as the mean ± S.E.M., n= 7–9 mice. Two-way ANOVA with post hoc Tukey test correction was used. *p<0.05 vs ZT2 or 8hr; #p<0.05 vs L/D group. Effects of the miRNAs mimics upon (B) Rev-erbα gene and (C) REV-ERBα protein expression in primary hepatocyte culture. The values are mean ± SEM. n=4 (2 experiments/2 mice each); *p<0.05, **p<0.01, ***p<0.0005 NC (negative control) vs. miRNA mimic. Student’s t-test.
3.6. miR-185–5p and 140–5p bind to the Rev-ERBα 3’UTR and regulate the expression of Rev-erbα target genes.
To investigate the direct binding of the four candidates in the Rev-erbα 3’UTR region, we co-expressed a luciferase report vector containing the Rev-erbα 3’UTR sequence together with miR-185–5p, miR-140–5p, miR-326–5p, and miR-328–5p mimics or a negative control into HEK293 cells. Luciferase reporter activity was reduced by 53% and 25% in cells transfected with miR-185–5p and 140–5p mimics, respectively, indicating that only these two candidates directly regulate Rev-erbα via its 3’UTR (Fig. 6A). To confirm the miRNA action through the seed sequence, we identified the putative binding sites for both miRNAs using the TargetScan tool. The miR-185–5p showed two seed sequences on the Rev-erbα 3’UTR region (Figure 6B), whereas the miR140–5p exhibited only one binding site (Figure 6C). Based on these findings, we constructed a luciferase vector with specific mutants for the binding sites and cotransfected it with the miR-185–5p and miR-140–5p mimic or a negative control into HEK293 cells. The overexpression of mir-140–5p did not reduce the luciferase activity in cells transfected with mutant seed sequence, demonstrating the specificity of this miRNA to the Rev-erbα 3’UTR region (Fig. 6D). Moreover, mutation of the Rev-erbα 3’UTR binding site 1 abrogated the repressive action of miR-185–5p, whereas mutation of site 2 only attenuated this inhibitory action, suggesting that the site 1 could display a more critical effect than site 2 in the Rev-erbα 3’UTR region (Fig. 6D). Finally, we investigated whether the direct or indirect action of miR-140–5p/miR-185–5p and miR326–5p/miR-328–5p, respectively, could alter the expression of Rev-erbα target genes. In primary hepatocyte cultures, the overexpression of miR-185–5p and miR-326–5p increased the expression of Clock, Acly, and Fasn genes, whereas the miR-140–5p mimic only modulated the expression of the Fasn gene (Figure 6E). No difference was found in the expression of these genes in primary hepatocyte culture transfected with miR-328–5p mimic. These results indicate that reduction in the expression of Rev-erbα, leading to increase in its targets genes, could be driven by the miR-185–5p and miR-326–5p.
Figure 6. miRs-185–5p and 140–5p bind to the Rev-ERBα 3’UTR and regulate the expression of lipogenic genes.
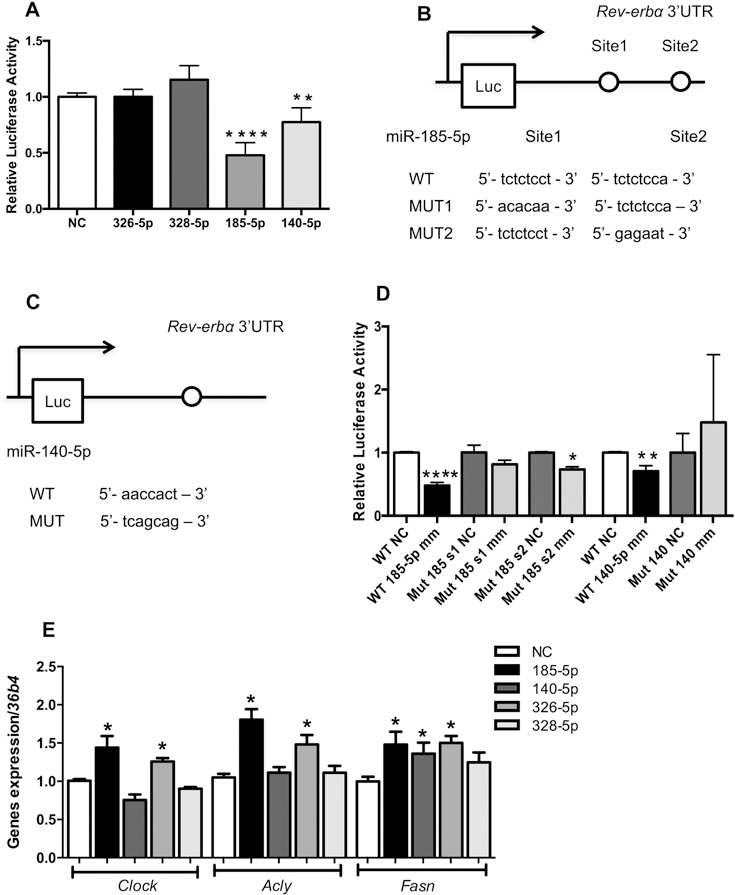
(A) Normalized bioluminescence from HEK293 cells co-transfected with the candidate miRNAs mimics or negative control (NC), and the vector containing the full-length WT Rev-erbα 3’UTR clone (n=1 experiment in triplicates). Diagram with the putative binding sites to (B) miR-185–5p and (C) miR140–5p; (D) Luciferase activity of the wild-type and mutant constructs of the Rev-erbα 3’UTR in the HEK293 cells co-transfected with the vector and the miRNA mimics or negative control. The plotted values correspond to the ratio of Renilla luciferase signal to firefly luciferase activity in the same sample. n= 1 experiments in triplicates; (E) Expression of Rev-erbα target genes in primary hepatocyte culture transfected with miR-185–5p, miR-140–5p, miR-326–5p and miR-328–5p mimic or negative control; n=4 (2 mice/2 experiments). The values are Mean ± SEM. *p<0.05; **p<0.01, ****p<0.0001 NC vs. miRNA mimic. Student’s t-test.
4. Discussion
Previous studies with shift workers and animal models exposed to ALAN have reported alterations in the oscillatory patterns of biological rhythms and consequent predisposition to obesity and metabolic syndrome [21, 22, 38]. However, it remains unknown by which mechanisms the environmental lighting disrupts the energy metabolism. Here, we demonstrated that exposure to ALAN leads to hepatic steatosis, which was paralleled by increased expression of Rev-erbα-targeting miRNAs, and consequent up-regulation of the lipogenic targets of this clock gene.
It has been reported that altered timing of food intake predisposes to gain weight, glucose intolerance, and insulin resistance in humans and mice [39–42]. In this context, restriction of food availability at specific times prevents the metabolic syndrome phenotype, indicating the critical role of nutrient availability in the control of daily energy metabolism, in both humans and animal models [41, 43–46]. Here, mice exposed to ALAN showed altered timing of food intake and locomotor activity, which was paralleled by increased body weight and plasma TG levels, as well as decreased insulin sensitivity. Importantly, these findings corroborates with previous studies in healthy humans acute or chronically exposed to ALAN [13, 42, 47, 48]. The temporal signal for oscillatory feeding and locomotor behavior is generated in the SCN, based on environmental light information [49]. Consequently, mice exposed to ALAN showed arrhythmic neuronal activity in the SCN, and energy intake behavior, as well as metabolic syndrome phenotype [21]. Taken together, theses findings indicate that exposure to ALAN leads to altered neuronal activity of the SCN, which could induce the misalignment in the food intake behavior, predisposing to obesity, dyslipidemia and insulin resistance.
Circadian disruption that occurs in people engaged in night-shift work disrupts the integration between circadian and metabolic systems, leading to metabolic syndrome phenotype. Here we observed that mice exposed to ALAN showed altered expression of ACL and FAS, which could be linked to altered lipid metabolism in liver, and consequent development of hepatic steatosis. Furthermore, those mice also showed disrupted expression of molecular clocks, supporting a previous study that showed that mice exposed to dim light at night exhibited disrupted peripheral clocks [23]. Among the clock genes, the expression of Rev-erbα, was altered at the same time point that proteins from DNL, ACL, and FAS were up-regulated. In line with this notion, whole body deletion of Rev-erbα led to a phenotype of liver fatty acid accumulation through an increase in the lipogenic process triggered by the DNL [15]. Importantly, recent study has shown that, rats submitted to advanced light phase shifts exhibited reduced expression of Rev-erbα in liver, without difference in the expression of Srebp-1c [50]. Therefore, our findings suggest that exposure to ALAN led to a disrupted interplay between the molecular clock and metabolism. Moreover, the altered expression of Reverbα could be the critical regulator driving the hepatic lipid accumulation in mice exposed to ALAN.
The circadian expression of clock genes is driven by transcriptional/translational feedback loops [7]. However, studies have shown that miRNAs may also modulate the clock machinery at the post-transcriptional level [29, 31]. In this study, we demonstrated that miRNAs modulate the expression of Rev-erbα through it 3’UTR region. The overexpression of 4 miRNAs candidates in primary hepatocyte culture decreased the expression of Rev-erbα at mRNA and protein levels. However, only the miR-140–5p and miR-185–5p reduced the luciferase activity, suggesting that only these two miRNAs directly bind to the Rev-erbα 3’UTR region. Previous studies have already shown that multiple miRNAs can modulate the expression of the same target gene through convergent action [51, 52]. Furthermore, it has been reported that miRNAs can also display a critical role in regulatory gene expression through indirect actions, whereby the effect of the miRNA on mRNA expression is mediated by some other regulator [53]. Thus, our results indicate that Rev-erbα gene expression is regulated by the combinatorial effect of miRNAs, which acting direct or indirectly in the Rev-erbα 3’UTR region.
Using bioinformatics, a previous study found that altered expression of miR-185–5p, 140–5p, 326–5p, and 328–5p is associated with obesity in humans and mice [54]. Indeed, morbidly obese patients exhibited an increased circulating level of miR-140–5p [55]. Furthermore, obese mice HFD-induced showed increased expression of miR-185–5p in liver, leading to dysregulation of lipid homeostasis [56]. We observed that exposure to ALAN led to increased expression of miR-185–5p, 140–5p, 326–5p and 328–5p in the liver, whose alteration could be the mechanism triggering the hepatic steatosis through down-regulation of the clock gene Rev-erbα. Supporting this hypothesis, the overexpression of miR-140–5p, 185–5p, and 326–5p in the primary hepatocyte culture decreases the expression of Rev-erbα, and leads to up-regulation of genes coding the lipogenic proteins Acly and Fas. Thus, our results suggest that miR-140–5p and 185–5p, by modulating the expression of Rev-erbα, display an important role in the regulation of the lipid metabolism in liver, whose action could be used as a potential therapeutic strategy for hepatic steatosis. Further studies are required to elucidate the precise mechanisms by which exposure to ALAN alters expression of miRNAs.
Therefore, the major contribution of our study was to uncover a potential mechanism involving altered expression of miRNAs targeting the circadian clock, which is associated with the metabolic syndrome phenotypes induced by exposure to ALAN. However, additional in vivo studies using genetic disruption models are necessary to establish causality. Although, the translational potential of our findings warrants caution due to the inverted sleep/wake behavior between humans and rodents, both species exhibit a closely metabolic phenotype. Thus, insights obtained with animal models of shift-work may provide important preclinical evidences about the pathophysiological processes that occur in humans under altered lighting conditions.
5. Conclusion
In summary, we propose that altered expression of miRNAs may underlie the development of hepatic steatosis caused by exposure to ALAN through disruption of the molecular clock in peripheral tissues. In this context, our study provides additional insights about the metabolic consequences caused by changes in environmental conditions, which in modern life include sleep deprivation, jet lag, shift work, and the widespread use of electric light at night.
Supplementary Material
Highlights.
Exposure to artificial light at night (ALAN) leads to obesity and hepatic steatosis;
De novo lipogenesis pathway is up-regulated by exposure to ALAN in the liver.
ALAN disrupts the interplay between circadian clock and lipid metabolism in liver;
Rev-erbα-targeting microRNAs may underlie some effects of ALAN
Acknowledgments
The authors also thank Marise Carnelossi for excellent technical assistance and Karin Hoch Fehlauer Ale for English editing.
Funding
This work was supported by São Paulo Research Foundation (Fundação de Amparo à Pesquisa do Estado de São Paulo, FAPESP –, 2013/26740-0; 2014/01717-9; 2015/12611-0), and National Council for Scientific and Technological Development (Conselho Nacional para o Desenvolvimento Científico e Tecnológico, CNPq – 449794/2014-8). We also acknowledge support from NIH grant R01DK45586 (MAL).
Abbreviations:
- 6-SML
Urinary 6-sulfatoxymelatonin
- ACL
ATP-citrate lyase
- ALAN
Artificial Light at Night
- BMAL1
Brain and Muscle ARNT-like1
- CLOCK
Circadian Locomotor Output Cycles Kaput
- Cry
Cryptochrome
- DNL
de novo lipogenesis
- FAS
Fatty acid synthase
- KiTT
glucose decay constant
- L/D
Light/ Dark
- L/L
Light/Light
- miRNA
microRNA
- Per
Period
- Rev-erbα
Nuclear Receptor Subfamily 1 Group D Member
- SCN
Suprachiasmatic nucleus
- UTR
Untranslated Region
- ZT
Zeitgeber time
Footnotes
Publisher's Disclaimer: This is a PDF file of an unedited manuscript that has been accepted for publication. As a service to our customers we are providing this early version of the manuscript. The manuscript will undergo copyediting, typesetting, and review of the resulting proof before it is published in its final citable form. Please note that during the production process errors may be discovered which could affect the content, and all legal disclaimers that apply to the journal pertain.
Conflict of interest
All contributing authors declare no conflicts of interest.
6. References
- [1].Huang W, Ramsey KM, Marcheva B, Bass J. Circadian rhythms, sleep, and metabolism. J Clin Invest 2011;121:2133–41. [DOI] [PMC free article] [PubMed] [Google Scholar]
- [2].Takahashi JS. Circadian clock genes are ticking. Science 1992;258:238–40. [DOI] [PubMed] [Google Scholar]
- [3].Buijs RM, Kalsbeek A. Hypothalamic integration of central and peripheral clocks. Nat Rev Neurosci 2001;2:521–6. [DOI] [PubMed] [Google Scholar]
- [4].Dibner C, Schibler U, Albrecht U. The mammalian circadian timing system: organization and coordination of central and peripheral clocks. Annu Rev Physiol 2010;72:517–49. [DOI] [PubMed] [Google Scholar]
- [5].Fuller PM, Lu J, Saper CB. Differential rescue of light-and food-entrainable circadian rhythms. Science 2008;320:1074–7. [DOI] [PMC free article] [PubMed] [Google Scholar]
- [6].Golombek DA, Rosenstein RE. Physiology of circadian entrainment. Physiol Rev 2010;90:1063–102. [DOI] [PubMed] [Google Scholar]
- [7].Lee C, Etchegaray JP, Cagampang FR, Loudon AS, Reppert SM. Posttranslational mechanisms regulate the mammalian circadian clock. Cell 2001;107:855–67. [DOI] [PubMed] [Google Scholar]
- [8].Akashi M, Takumi T. The orphan nuclear receptor RORalpha regulates circadian transcription of the mammalian core-clock Bmal1. Nat Struct Mol Biol 2005;12:441–8. [DOI] [PubMed] [Google Scholar]
- [9].Preitner N, Damiola F, Lopez-Molina L, Zakany J, Duboule D, Albrecht U, et al. The orphan nuclear receptor REV-ERBalpha controls circadian transcription within the positive limb of the mammalian circadian oscillator. Cell 2002;110:251–60. [DOI] [PubMed] [Google Scholar]
- [10].Asher G, Sassone-Corsi P. Time for food: the intimate interplay between nutrition, metabolism, and the circadian clock. Cell 2015;161:84–92. [DOI] [PubMed] [Google Scholar]
- [11].Bass J, Takahashi JS. Circadian integration of metabolism and energetics. Science 2010;330:1349–54. [DOI] [PMC free article] [PubMed] [Google Scholar]
- [12].Honma K, Hikosaka M, Mochizuki K, Goda T. Loss of circadian rhythm of circulating insulin concentration induced by high-fat diet intake is associated with disrupted rhythmic expression of circadian clock genes in the liver. Metabolism 2016;65:482–91. [DOI] [PubMed] [Google Scholar]
- [13].Poggiogalle E, Jamshed H, Peterson CM. Circadian regulation of glucose, lipid, and energy metabolism in humans. Metabolism 2018. [DOI] [PMC free article] [PubMed]
- [14].Yin L, Wu N, Curtin JC, Qatanani M, Szwergold NR, Reid RA, et al. Rev-erbalpha, a heme sensor that coordinates metabolic and circadian pathways. Science 2007;318:1786–9. [DOI] [PubMed] [Google Scholar]
- [15].Feng D, Liu T, Sun Z, Bugge A, Mullican SE, Alenghat T, et al. A circadian rhythm orchestrated by histone deacetylase 3 controls hepatic lipid metabolism. Science 2011;331:1315–9. [DOI] [PMC free article] [PubMed] [Google Scholar]
- [16].Boggild H, Knutsson A. Shift work, risk factors and cardiovascular disease. Scand J Work Environ Health 1999;25:85–99. [DOI] [PubMed] [Google Scholar]
- [17].Nedeltcheva AV, Scheer FA. Metabolic effects of sleep disruption, links to obesity and diabetes. Curr Opin Endocrinol Diabetes Obes 2014;21:293–8. [DOI] [PMC free article] [PubMed] [Google Scholar]
- [18].Pan A, Schernhammer ES, Sun Q, Hu FB. Rotating night shift work and risk of type 2 diabetes: two prospective cohort studies in women. PLoS Med 2011;8:e1001141. [DOI] [PMC free article] [PubMed] [Google Scholar]
- [19].Wyse CA, Selman C, Page MM, Coogan AN, Hazlerigg DG. Circadian desynchrony and metabolic dysfunction; did light pollution make us fat? Med Hypotheses 2011;77:1139–44. [DOI] [PubMed] [Google Scholar]
- [20].Opperhuizen AL, van Kerkhof LW, Proper KI, Rodenburg W, Kalsbeek A. Rodent models to study the metabolic effects of shiftwork in humans. Front Pharmacol 2015;6:50. [DOI] [PMC free article] [PubMed] [Google Scholar]
- [21].Coomans CP, van den Berg SA, Houben T, van Klinken JB, van den Berg R, Pronk AC, et al. Detrimental effects of constant light exposure and high-fat diet on circadian energy metabolism and insulin sensitivity. FASEB J 2013;27:1721–32. [DOI] [PubMed] [Google Scholar]
- [22].Fonken LK, Workman JL, Walton JC, Weil ZM, Morris JS, Haim A, et al. Light at night increases body mass by shifting the time of food intake. Proc Natl Acad Sci U S A 2010;107:18664–9. [DOI] [PMC free article] [PubMed] [Google Scholar]
- [23].Fonken LK, Aubrecht TG, Melendez-Fernandez OH, Weil ZM, Nelson RJ. Dim light at night disrupts molecular circadian rhythms and increases body weight. J Biol Rhythms 2013;28:262–71. [DOI] [PMC free article] [PubMed] [Google Scholar]
- [24].He L, Hannon GJ. MicroRNAs: small RNAs with a big role in gene regulation. Nat Rev Genet 2004;5:522–31. [DOI] [PubMed] [Google Scholar]
- [25].Davalos A, Goedeke L, Smibert P, Ramirez CM, Warrier NP, Andreo U, et al. miR-33a/b contribute to the regulation of fatty acid metabolism and insulin signaling. Proc Natl Acad Sci U S A 2011;108:9232–7. [DOI] [PMC free article] [PubMed] [Google Scholar]
- [26].Trajkovski M, Hausser J, Soutschek J, Bhat B, Akin A, Zavolan M, et al. MicroRNAs 103 and 107 regulate insulin sensitivity. Nature 2011;474:649–53. [DOI] [PubMed] [Google Scholar]
- [27].Cui X, You L, Zhu L, Wang X, Zhou Y, Li Y, et al. Change in circulating microRNA profile of obese children indicates future risk of adult diabetes. Metabolism 2018;78:95–105. [DOI] [PubMed] [Google Scholar]
- [28].Kang M, Liu X, Fu Y, Timothy Garvey W. Improved systemic metabolism and adipocyte biology in miR-150 knockout mice. Metabolism 2018. [DOI] [PMC free article] [PubMed]
- [29].Gao Q, Zhou L, Yang SY, Cao JM. A novel role of microRNA 17–5p in the modulation of circadian rhythm. Sci Rep 2016;6:30070. [DOI] [PMC free article] [PubMed] [Google Scholar]
- [30].Zhang W, Wang P, Chen S, Zhang Z, Liang T, Liu C. Rhythmic expression of miR-27b-3p targets the clock gene Bmal1 at the posttranscriptional level in the mouse liver. FASEB J 2016;30:2151–60. [DOI] [PubMed] [Google Scholar]
- [31].Cheng HY, Papp JW, Varlamova O, Dziema H, Russell B, Curfman JP, et al. microRNA modulation of circadian-clock period and entrainment. Neuron 2007;54:813–29. [DOI] [PMC free article] [PubMed] [Google Scholar]
- [32].Kochan DZ, Ilnytskyy Y, Golubov A, Deibel SH, McDonald RJ, Kovalchuk O. Circadian disruption-induced microRNAome deregulation in rat mammary gland tissues. Oncoscience 2015;2:428–42. [DOI] [PMC free article] [PubMed] [Google Scholar]
- [33].Dube S, Errazuriz I, Cobelli C, Basu R, Basu A. Assessment of insulin action on carbohydrate metabolism: physiological and non-physiological methods. Diabet Med 2013;30:664–70. [DOI] [PMC free article] [PubMed] [Google Scholar]
- [34].Ribeiro RA, Vanzela EC, Oliveira CA, Bonfleur ML, Boschero AC, Carneiro EM. Taurine supplementation: involvement of cholinergic/phospholipase C and protein kinase A pathways in potentiation of insulin secretion and Ca2+ handling in mouse pancreatic islets. Br J Nutr 2010;104:1148–55. [DOI] [PubMed] [Google Scholar]
- [35].Folch J, Lees M, Sloane Stanley GH. A simple method for the isolation and purification of total lipides from animal tissues. J Biol Chem 1957;226:497–509. [PubMed] [Google Scholar]
- [36].Benloucif S, Guico MJ, Reid KJ, Wolfe LF, L’Hermite-Baleriaux M, Zee PC. Stability of melatonin and temperature as circadian phase markers and their relation to sleep times in humans. J Biol Rhythms 2005;20:178–88. [DOI] [PubMed] [Google Scholar]
- [37].Zhang D, Tong X, Arthurs B, Guha A, Rui L, Kamath A, et al. Liver clock protein BMAL1 promotes de novo lipogenesis through insulin-mTORC2-AKT signaling. J Biol Chem 2014;289:25925–35. [DOI] [PMC free article] [PubMed] [Google Scholar]
- [38].Boivin DB, Boudreau P. Impacts of shift work on sleep and circadian rhythms. Pathol Biol (Paris) 2014;62:292–301. [DOI] [PubMed] [Google Scholar]
- [39].Arble DM, Bass J, Laposky AD, Vitaterna MH, Turek FW. Circadian timing of food intake contributes to weight gain. Obesity (Silver Spring) 2009;17:2100–2. [DOI] [PMC free article] [PubMed] [Google Scholar]
- [40].Shamsi NA, Salkeld MD, Rattanatray L, Voultsios A, Varcoe TJ, Boden MJ, et al. Metabolic consequences of timed feeding in mice. Physiol Behav 2014;128:188–201. [DOI] [PubMed] [Google Scholar]
- [41].Hatori M, Vollmers C, Zarrinpar A, DiTacchio L, Bushong EA, Gill S, et al. Timerestricted feeding without reducing caloric intake prevents metabolic diseases in mice fed a high-fat diet. Cell Metab 2012;15:848–60. [DOI] [PMC free article] [PubMed] [Google Scholar]
- [42].Scheer FA, Hilton MF, Mantzoros CS, Shea SA. Adverse metabolic and cardiovascular consequences of circadian misalignment. Proc Natl Acad Sci U S A 2009;106:4453–8. [DOI] [PMC free article] [PubMed] [Google Scholar]
- [43].Bray MS, Ratcliffe WF, Grenett MH, Brewer RA, Gamble KL, Young ME. Quantitative analysis of light-phase restricted feeding reveals metabolic dyssynchrony in mice. Int J Obes (Lond) 2013;37:843–52. [DOI] [PMC free article] [PubMed] [Google Scholar]
- [44].Chung H, Chou W, Sears DD, Patterson RE, Webster NJ, Ellies LG. Time-restricted feeding improves insulin resistance and hepatic steatosis in a mouse model of postmenopausal obesity. Metabolism 2016;65:1743–54. [DOI] [PMC free article] [PubMed] [Google Scholar]
- [45].Salgado-Delgado RC, Saderi N, Basualdo Mdel C, Guerrero-Vargas NN, Escobar C, Buijs RM. Shift work or food intake during the rest phase promotes metabolic disruption and desynchrony of liver genes in male rats. PLoS One 2013;8:e60052. [DOI] [PMC free article] [PubMed] [Google Scholar]
- [46].Garaulet M, Gomez-Abellan P, Alburquerque-Bejar JJ, Lee YC, Ordovas JM, Scheer FA. Timing of food intake predicts weight loss effectiveness. Int J Obes (Lond) 2013;37:604–11. [DOI] [PMC free article] [PubMed] [Google Scholar]
- [47].Obayashi K, Saeki K, Iwamoto J, Okamoto N, Tomioka K, Nezu S, et al. Exposure to light at night, nocturnal urinary melatonin excretion, and obesity/dyslipidemia in the elderly: a crosssectional analysis of the HEIJO-KYO study. J Clin Endocrinol Metab 2013;98:337–44. [DOI] [PubMed] [Google Scholar]
- [48].Albreiki MS, Middleton B, Hampton SM. A single night light exposure acutely alters hormonal and metabolic responses in healthy participants. Endocr Connect 2017;6:100–10. [DOI] [PMC free article] [PubMed] [Google Scholar]
- [49].Nakagawa H, Okumura N. Coordinated regulation of circadian rhythms and homeostasis by the suprachiasmatic nucleus. Proc Jpn Acad Ser B Phys Biol Sci 2010;86:391–409. [DOI] [PMC free article] [PubMed] [Google Scholar]
- [50].Herrero L, Valcarcel L, da Silva CA, Albert N, Diez-Noguera A, Cambras T, et al. Altered circadian rhythm and metabolic gene profile in rats subjected to advanced light phase shifts. PLoS One 2015;10:e0122570. [DOI] [PMC free article] [PubMed] [Google Scholar]
- [51].Krek A, Grun D, Poy MN, Wolf R, Rosenberg L, Epstein EJ, et al. Combinatorial microRNA target predictions. Nat Genet 2005;37:495–500. [DOI] [PubMed] [Google Scholar]
- [52].Khella HW, Bakhet M, Allo G, Jewett MA, Girgis AH, Latif A, et al. miR-192, miR-194 and miR-215: a convergent microRNA network suppressing tumor progression in renal cell carcinoma. Carcinogenesis 2013;34:2231–9. [DOI] [PubMed] [Google Scholar]
- [53].Matkovich SJ, Hu Y, Eschenbacher WH, Dorn LE, Dorn GW, 2nd. Direct and indirect involvement of microRNA-499 in clinical and experimental cardiomyopathy. Circ Res 2012;111:521–31. [DOI] [PMC free article] [PubMed] [Google Scholar]
- [54].Kunej T, Jevsinek Skok D, Zorc M, Ogrinc A, Michal JJ, Kovac M, et al. Obesity gene atlas in mammals. J Genomics 2013;1:45–55. [DOI] [PMC free article] [PubMed] [Google Scholar]
- [55].Ortega FJ, Mercader JM, Catalan V, Moreno-Navarrete JM, Pueyo N, Sabater M, et al. Targeting the circulating microRNA signature of obesity. Clin Chem 2013;59:781–92. [DOI] [PubMed] [Google Scholar]
- [56].Yang M, Liu W, Pellicane C, Sahyoun C, Joseph BK, Gallo-Ebert C, et al. Identification of miR-185 as a regulator of de novo cholesterol biosynthesis and low density lipoprotein uptake. J Lipid Res 2014;55:226–38. [DOI] [PMC free article] [PubMed] [Google Scholar]
Associated Data
This section collects any data citations, data availability statements, or supplementary materials included in this article.