Abstract
NG-hydroxy-L-arginine (NOHA) is a stable intermediate product in the consumption of L-arginine in the urea cycle by nitric oxide synthase (NOS) to produce nitric oxide (NO) and L-citrulline. Research has shown that the urea cycle is disrupted in various diseases. As one of the few electrochemically active species in the urea cycle, NOHA shows promise as a marker for detection of various diseases. Electrochemical detection is an established, cost-effective method that is able to successfully detect low levels of analyte concentrations. NOHA, to the best of our knowledge, has not been electrochemically detected previously. Using cyclic voltammetry with a glassy carbon electrode, we have found that NOHA has an oxidation peak at 355 mV with a sensitivity of 5.4 nA/μM. We also investigated detecting NOHA with differential pulse voltammetry, which shows similar sensitivity and oxidation peaks. While there is significant work ahead to understand the kinetics of NOHA detection, the results here represent the first steps in making a NOHA biosensor.
Introduction
NG-hydroxy-L-arginine (NOHA) is a stable intermediate product in the consumption of L-arginine by nitric oxide synthase (NOS) to produce nitric oxide (NO) and L-citrulline in the urea cycle.1,2 L-arginine has biochemical and clinical significances.1–3 In the food industry, L-arginine detection is important for food quality control in fermented products.3 From a clinical perspective, L-arginine, along with L-ornithine and L-citrulline, are important constituents of the urea cycle.4 The urea cycle was first described in 1932 by Krebs and entails the conversion of ammonia to urea.4 In the body, the urea cycle mainly takes place in the liver, but can also be found in the muscles and kidneys.1,4 Previous work has shown that the urea cycle is disrupted in various diseases.1,4 As an example, NOHA is a potent arginase inhibitor that has been proven to have antiproliferative and apoptotic actions on the arginase-expressing human breast cancer cells.1
Electrochemical detection is an established, cost-effective method that is able to successfully detect low levels of analyte concentrations.5,6 We demonstrate that NOHA has the potential to be used as a electrochemical marker for various disease since NOHA is one of the few electrochemically active species in the urea cycle and L-arginine metabolism. As far as we know NOHA has not previously been electrochemically detected or characterized.
Herein, we investigate and characterize the electrochemical activity of NOHA with a glassy carbon electrode. Both cyclic and differential pulse voltammetry will be used to characterize the peaks of NOHA.
Experimental
Materials and Apparatus
NOHA was purchased from CALBIOCHEM, and phosphate buffer saline solution pH of 7.3 (PBS) was made in-house using a standard protocol. L-arginine was procured from Fisher Scientific; L-ornithine and L-citrulline were obtained from Sigma-Aldrich. An amino acid solution was made with 100uM L-ornithine, 10uM L-citrulline, and 100uM L-arginine in PBS to understand the effects of fouling of the electrode on the electrochemical detection of NOHA. All experiments were performed using a Gamry 600+ Potentiostat and a BASi C3 Static Cell Faraday cage. Data was recorded using Gamry software and analyzed using Excel.
Voltammeric Measurements
A platinum axillary electrode, a 3 mm diameter glassy carbon electrode, and a reference electrode of Ag/AgCl were submerged in a 20 mL shot glass for all electrochemical experiments. In cyclic voltammetric measurements the potential was swept from −0.2 to 0.6 V vs. Ag/AgCl at a scan rate of 50 mV/s. Three cyclic voltammograms were performed for each experiment. The second voltammogram was reported for each experiment and was used to analyze the data. Differential plus voltammograms were obtained from an initial potential of −0.2 V and final potential of 0.6 V vs. Ag/AgCl with a step size of 2 mV, a sample period of 500 ms, a pulse size of 50 mV, and a pulse time of 70 ms.
Serial Dilutions
A serial dilution was performed by starting from a base solution of phosphate buffered saline (PBS) solution. The concentration of NOHA was increased by incrementally adding specific volumes of a concentrated NOHA stock solution. After the addition of the NOHA, the solution was stirred for approximately 1 minute and allowed to equilibrate. At each serial dilution point, both cyclic voltammetric and differential pulse voltammetric measurements were conducted. During electrochemical measurement the stirring was turned off. Concentrations of NOHA were measured from 0uM to 148uM. Each serial dilution was done in triplicate. The displayed graphs are the average of the second scan from each serial dilution, and the standard deviations are the averages of these triplicate measurements.
Results and Discussion
Electrochemical Detection of NOHA
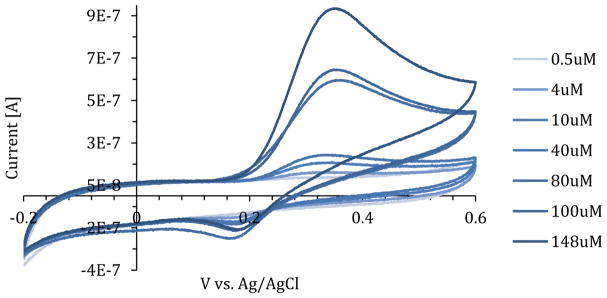
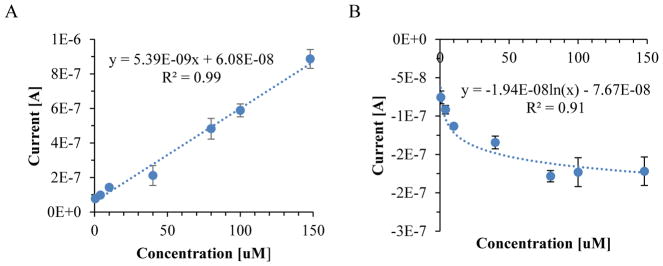
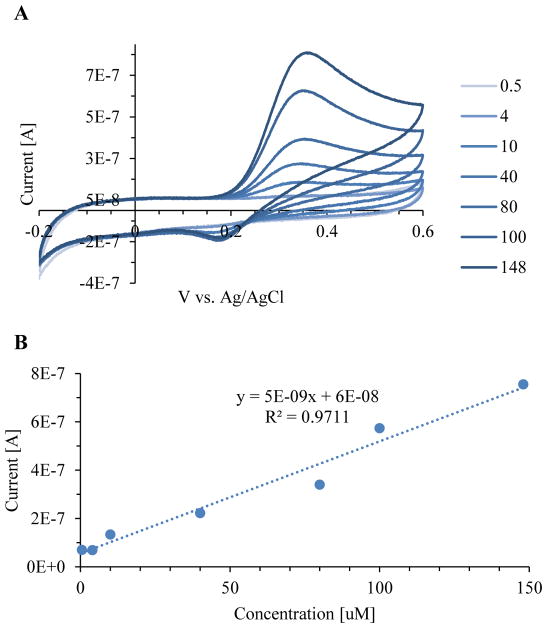
Using a glassy carbon electrode, cyclic voltammetry experiments were performed for a serial dilution of NOHA from 0 to 148uM. The oxidation peak of NOHA in PBS was observed at 355 mV, while the reduction peak was observed at 188 mV (Figure 1). Calibration curves were made for current vs concentration of NOHA at both the oxidation and reduction peak (Figure 2). The oxidation peak (R2=0.99) of NOHA had a linear relationship between the peak current and the concentration, while the reduction peak (R2=0.91) had a logarithmic relationship. The sensitivity of the NOHA’s oxidation peak was 5.39 nA/uM.
Figure 1.
A NOHA serial dilution from 0.5 to 148uM in PBS. Oxidation peak of NOHA was observed at 355mV and a reduction peak was observed at 188 mV.
Figure 2.
NOHA calibration curve for serial dilution from 0.5 to 148uM in PBS. Both the A) oxidation peak current, observed at 355 mV, and B) reduction peak current, observed at 188mV, were calibrated. Data was collected in triplicate and error bars represent the standard deviation.
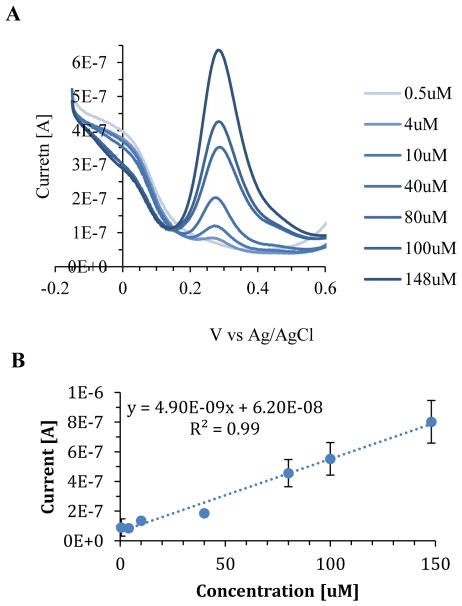
Differential pulse voltammetry was also used to characterize the oxidation peak of NOHA in PBS (Figure 3A). It was found that NOHA’s oxidation peak shifted to 288 mV when conducting differential plus experiments. The shift in the oxidation peak is most likely due to a difference in the experimental settings. A calibration curve at 288 mV found a linear relationship (R2=0.99) between the peak current and the concentration (Figure 3B). At high concentrations in differential pulse experiments, the standard deviation increased with an increase in concentration (Figure 3B). The trend in increasing standard deviation with an increase in concentration was not seen in cyclic voltammetry experiments.
Figure 3.
The oxidation peak of NOHA was investigated using differential pule voltammetry and was observed at 288 mV. A) Differential pulse voltammograms of NOHA 0.5–148uM in PBS. B) Calibration curve for peak current vs concentration. Data was collected in triplicate and error bars represent the standard deviation.
Characterization of NOHA
Assuming NOHA has a reversible electrochemical reaction, the number of electrons transferred can be found. The absolute value of the difference of the peak potential, Ep, and the half peak potential, Ep/2, is equal to the constant 56.5 mV divided by the number of electrons, n, at 25°C for a reversible reaction (Equation 1).7 The constant, 56.5 mV, is derived from calculation of the Nernst potential, and a combination of Faraday’s constant, the Gas constant, and the experimental temperature. The peak potential for NOHA is the same as the oxidation peak. The half peak potential can be found at half the peak current of the oxidation peak.7 From the triplicate data obtained using cyclic voltammetry, approximately one electron was found to be transferred during the electrochemical detection of NOHA (Figure 1, Equation 1).6–8
| [1] |
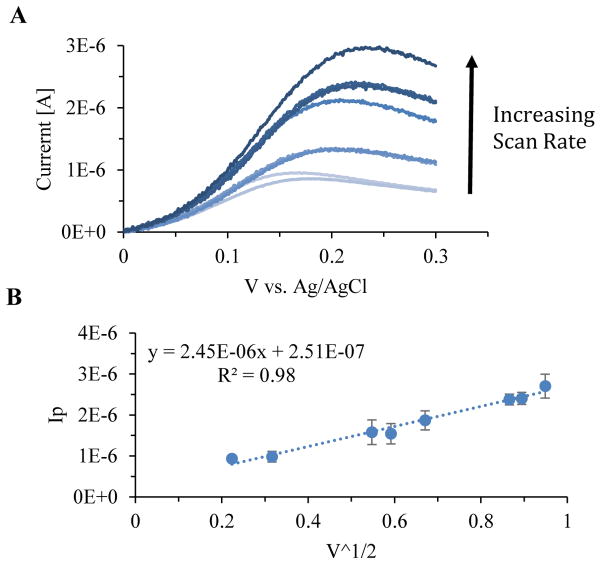
We also investigated the relationship between scan rate and peak current.8 The scan rate was varied from 150 to 1000 mV/s at a NOHA concentration of 148uM (Figure 4A). The plot of the peak current vs the square root of the voltage sweep showed a linear relationship (R2=0.98), which is indicative of a mass transfer limited reaction (Figure 4B).7
Figure 4.
A) Cyclic voltammograms with the scan rate varied from 150 to 1000 mVs−1 for a 148 uM solution of NOHA. Scan rates of 150, 200, 400, 450, 550, 850, 900, 1000 mVs−1 were tested. B) Relationship between the square root of the scan rate and the peak current. The linear relationship, R2=0.98, indicates that the NOHA oxidation reduction reaction is limited by mass transfer.
Preliminary Results on the Effect of Fouling on the Electrochemical Detection of NOHA
Detecting NOHA electrochemically is important, but being able to detect NOHA in the presence of other substances is essential in producing a robust biosensor in the future. Cyclic voltammetry experiments were performed for a serial dilution of NOHA from 0.5 to 148uM in an amino acid solution (Figure 5A). NOHA’s oxidation peak was found to have shifted by 5 mV to 360 mV from the 355 mV detected when NOHA was in a PBS solution. Preliminary data suggests that NOHA has a linear relationship between concentration and peak current even in the presence of other substances that could foul the electrode (Figure 5B).
Figure 5.
A) NOHA serial dilution from 0.5 to 148uM in an amino acid solution. The oxidation peak was found to be at 360mV. As B) Linear calibration curve for the oxidation peak current vs the concentration was observed.
Conclusion
We have demonstrated that NOHA is electrochemically detectable on a glassy carbon electrode. NOHA’s oxidation peak was observed at 355 mV and its reduction peak was observed at 188 mV. The sensitivity of the NOHA’s oxidation peak was 5.39 nA/uM. Differential pulse voltammetry was also used to characterize NOHA’s oxidation peak. Under the assumption that NOHA is a reversible reaction, we found that NOHA transferred one electron during the oxidation reduction reaction and that it is a mass transfer limited reaction. Preliminary results show that NOHA’s oxidation peak shifts 5 mV to 360 mV when in an amino acid solution that could foul the signal. This is promising for future work in detecting NOHA with a modified electrode in serum samples. In conclusion, NOHA shows promise as a one of the few electrochemically active species in the urea cycle as a marker for detection of various diseases. While there is significant work ahead, the results here represent the first steps in making a NOHA biosensor.
Acknowledgments
The authors would like to thank NIH CIBBR (P20 GM 113131), the Hamel Center for Undergraduate Research, and the College of Engineering and Physical Sciences at the University of New Hampshire for funding and support for this work.
References
- 1.Singh R, Pervin S, Karimi A, Cederbaum S, Chaudhuri G. Cancer Res. 2000;60:3305–3312. [PubMed] [Google Scholar]
- 2.Pervin S, Singh R, Chaudhuri G. Nitric Oxide. 2008;19:103–106. doi: 10.1016/j.niox.2008.04.016. [DOI] [PubMed] [Google Scholar]
- 3.Verma N, Singh AK, Singh M. Biochem Biophys Reports. 2017;12:228–239. doi: 10.1016/j.bbrep.2017.10.006. [DOI] [PMC free article] [PubMed] [Google Scholar]
- 4.Evoy D, Lieberman MD, Fahey TJ, Daly JM. Nutrition. 1998;14:611–7. doi: 10.1016/s0899-9007(98)00005-7. [DOI] [PubMed] [Google Scholar]
- 5.Chikkaveeraiah BV, Bhirde AA, Morgan NY, Eden HS, Chen X. ACS Nano. 2012;6:6546–6561. doi: 10.1021/nn3023969. [DOI] [PMC free article] [PubMed] [Google Scholar]
- 6.Kissinger PT, Lafayette W, Heineman WR. J Chem Educ. 1983;60:702–706. [Google Scholar]
- 7.Bard AJ, Faulkner LR. Electrochemical Methods: Fundamentals and Applications. 2. Wiley; Hoboken: 2001. [Google Scholar]
- 8.Baur JE. Handbook of Electrochemistry. Elsevier; 2007. pp. 829–848. [Google Scholar]


