

Abstract
To reduce child poverty and income instability, and eliminate extreme poverty among families with children in the United States, we propose converting the Child Tax Credit and child tax exemption into a universal, monthly child allowance. Our proposal is based on principles we argue should undergird the design of such policies: universality, accessibility, adequate payment levels, and more generous support for young children. Whether benefits should decline with additional children to reflect economies of scale is a question policymakers should consider. Analyzing 2015 Current Population Survey data, we estimate our proposed child allowance would reduce child poverty by about 40 percent, deep child poverty by nearly half, and would effectively eliminate extreme child poverty. Annual net cost estimates range from $66 billion to $105 billion.
Keywords: child poverty, child tax credit, income instability, social welfare policy
The child poverty rate in the United States remains stubbornly high—particularly among families with young children—and is much higher than in other affluent countries. This rate is not just the product of our demographics or labor market conditions; it also reflects our nation’s social policy choices. Most notably, the bulk of the benefits from two large policies providing income support for families with children is based on the federal income tax system. The $1,000 per child per year Child Tax Credit and a $4,000 per child per year tax exemption (often referred to as the child deduction) mostly go to families with incomes well above the poverty line, at a combined annual cost of $97 billion (Tax Policy Center 2016).
To be sure, the United States has significantly expanded its work-based social safety net over the past two decades, with impressive results. In fact, the United States now spends more on poor families with children than ever before (Moffitt 2015). In particular, the Earned Income Tax Credit (EITC) and Child Tax Credit (CTC), which are refundable and paid to wage earners, play a vital anti-poverty role by encouraging work and providing increased assistance to poor parents who earn low wages but are able to maintain steady employment.1 Together, the EITC and CTC lift more children out of poverty than any other federal program (Marr et al. 2015).
Despite these policy successes, one particularly vulnerable group of children has fallen through the cracks—children whose parents are unable to maintain regular work (Moffitt 2015). Relying on a number of different metrics and numerous sources of data, researchers find evidence of worsening conditions and highly volatile incomes among America’s poorest families (Edin and Shaefer 2015; Jencks 2016; Moffitt 2015). What aid is available to families at the very bottom increasingly comes in the form of in-kind benefits, rather than cash (Fox et al. 2015). While such benefits are crucial for bolstering the living standards of the poor, a number of scholars argue that a core dilemma facing America’s extreme poor is the absence of accessible cash income (Edin and Shaefer 2015, 2016). Thus, America’s transition to a work-based social safety net, begun in the 1990s, remains incomplete because it has failed to ensure a stable base-level source of cash income for all children.
A stable source of cash income could reduce material hardship among families by increasing the overall dependable cash resources available to cover core expenses. Moreover, a growing body of evidence from rigorous studies suggests that income transfers—even relatively small ones—can improve child health and development. Poverty-reducing income transfers to families with children may also reduce social costs in the long term by furthering education attainment, reducing crime, reducing homelessness, and increasing labor market productivity (Evans, Sullivan, and Wallskog 2016; Holzer et al. 2008; Hoynes and Patel 2015; Almond, Currie, and Duque 2017).
Embedded in the U.S. tax code—at a combined cost of $95.6 billion in 2014—the Child Tax Credit and child tax exemption recognize that families incur significant expenses when raising children. But because their benefits are based on earnings, they leave out many of America’s youngest children who are the most likely to be living in families too poor to be eligible for the full credit (Harris 2012). Moreover, both are provided annually, at tax time, making it difficult for families struggling with income instability to provide a consistent level of support for their children throughout the year. All in all, the Child Tax Credit and child tax exemption are not well designed to meet the ongoing and emergency needs of families with children in the United States.
Our proposed universal monthly child allowance replaces these U.S. tax code provisions with a regular, dependable, monthly cash benefit—an income floor—for all families with children, including the most vulnerable. It is designed to complement our nation’s work-based safety net. Also, because it would be available to all children, a universal child allowance would avoid the stigma attached to existing means-tested, income transfer programs.
Such a child allowance would also benefit children whose parents are continuously engaged in the labor market by providing a reliable monthly income stream, an important advantage given the significant, and growing, inter- and intra-year income and expense volatility American families are experiencing (Sandstrom and Huerta 2013; Jacob and Hacker 2008; Morduch and Schneider 2017). Finally, it would also provide assistance to children in middle-class families, most of whose incomes have barely budged in the last twenty years. The richest fifth of families, which include nearly seventeen million children, spend nearly $10,000 per child per year on child enrichment expenditures alone, leaving children in both low- and middle-income families behind (Duncan and Murnane 2011).
BACKGROUND
The United States has increased its financial commitment to fighting poverty substantially over the past half century by introducing refundable tax credits and expanding the Supplemental Nutrition Assistance Program (SNAP), formerly the Food Stamp Program (for 2015 cost data, see figure 1). Estimates using the supplemental poverty measure (SPM), which more fully accounts for in-kind aid and refundable tax credits than the official poverty measure, show that child poverty fell by 35 percent between 1967 and 2012, and virtually all of that reduction was due to increased means-tested public benefits (Wimer et al. 2016). Research using data from the Consumer Expenditure Survey also finds falling consumption-based poverty in the past few decades (Meyer and Sullivan 2012).
Figure 1.
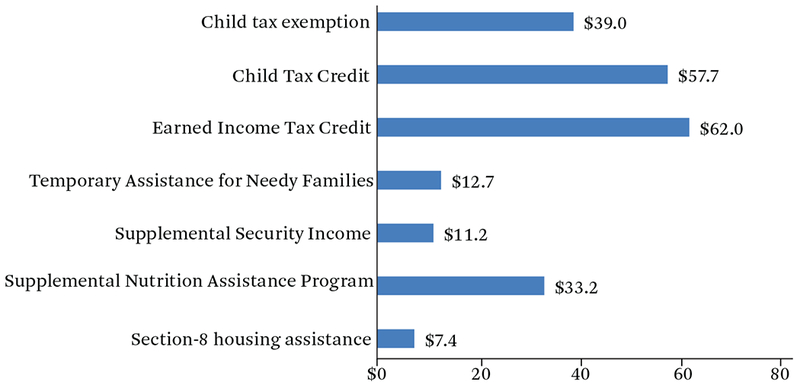
Federal Expenditures on Children by Major Cash and Near-Cash Programs, 2015 (in Billions)
Source: Authors’ compilation based on Tax Policy Center 2016 and Isaacs et al. 2016.
Note: Data on child tax exemption and Child Tax Credit come from the Center for Tax Policy. Other data are adapted from Isaacs et al. 2016. Data are based on outlays, rather than appropriated or authorized levels. Child Tax Credit and Earned Income Tax Credit amounts include both tax expenditure and refundable portions of the credits. Child Tax Credit amount includes the Additional Child Tax Credit.
In particular, the EITC, CTC, and SNAP have expanded significantly since the mid-1990s. When counted as income, they lift more children out of poverty than any other federal programs, demonstrating how government policies can work to help poor families with children (Short 2015). Even after counting inkind benefits, however, approximately 17 percent of children still live in families with incomes below the poverty line, and an additional 25 percent live in families with net incomes between 100 percent and 200 percent of the SPM poverty line (Short 2015).
But what about families that cannot find work, or whose work is not enough for them to benefit substantially from work-related tax credits? The only income benefits available to nonworking families with children are SNAP and what is left of Temporary Assistance for Needy Families (TANF). SNAP provides a critical floor of support for eligible families, especially those with children. But recent benefit cuts and the fact that SNAP recipients can use their benefits only to buy food impose major limits on the extent to which the program can help low-income families provide adequate support for their children. Paying for housing, for instance, has become increasingly challenging for low-income families. Yet housing assistance programs currently help only about one in four eligible households (Desmond 2016).
Although means-tested aid to poor families with children has increased during the past few decades, research finds that aid—particularly in the form of cash aid—to the very poorest among them has declined (Edin and Shaefer 2015; Moffitt 2015; Jencks 2016). For families with children, this is related to the declining resources allocated to TANF, the cash assistance program established by the welfare reform of 1996. According to the TANF-to-poverty ratio—a measure of program access—the number of families receiving cash assistance per 100 families in poverty has declined from sixty-eight in 1996 to twenty-three in 2015 (Floyd, Pavetti, and Schott 2017). Researchers have also found that TANF failed to respond to the rise in poverty and unemployment that accompanied the Great Recession (Garfinkel, McLanahan, and Wimer 2016).
Comparison with Peer Countries
If poverty is defined based only on pre-tax, pretransfer (mostly earned) income, then the U.S. poverty rate differs little from the rates of other Organization for Economic Co-operation and Development (OECD) countries. The United States is unique, however, in its high rate of post-tax, post-transfer poverty. Numerous reports suggest that using a definition of after-tax and after-benefit income that includes refundable tax credits, SNAP, public housing, and other near-cash benefits produces a child relative poverty rate—based on a poverty line defined as half of median income—of 21 percent (see figure 2) (OECD 2016; Smeeding and Thevenot 2016). This is the fifth-highest rate of all OECD countries and surpassed only by many far poorer countries.2
Figure 2.
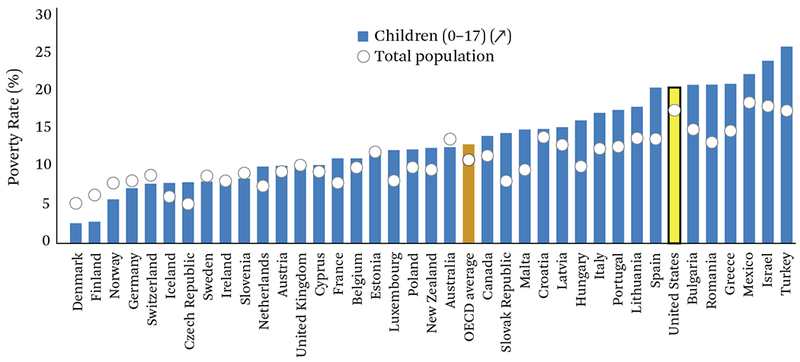
Child Income Poverty Rates, 2012
Source: Authors’ compilation based on OECD 2016.
Note: Percentage of children (0–17) that live in households with an equivalized post-tax and transfer income of less than 50 percent of the national annual median equivalized post-tax and transfer household income. Data for Canada refer to 2011.
Part of the reason that other nations have fewer poor children than the United States is that they provide what the OECD terms a universal child benefit—a cash grant that goes to all families with children. Austria, Canada, Denmark, Finland, France, Germany, Ireland, Luxembourg, the Netherlands, Norway, Sweden, and the UK have all implemented a version of a child benefit (Matthews 2016; Garfinkel et al. 2016). Some call their measures child allowances (CA). Others implement their CA through the tax code as universal child tax credits. A notable feature of these universal child benefit plans is that they are accessible to all: families with children receive them regardless of whether parents work and whatever their income.
The level of these child benefits varies by country. The benefit in U.S. dollars for two children in Belgium and Germany is about $5,600 per year; in Ireland $4,000, and in the Netherlands $2,400 (Matthews 2016). Canada has a base child allowance, in U.S. dollars, of roughly $5,000 per child under six and $4,300 per child age six to seventeen, but with variation by province and income.3 As with the Canadian program, our proposed U.S. child allowance would recognize the greater income needs of families with young children. It is important that these nations have universal health-care programs and heavily subsidized, low-cost, high-quality childcare and early childhood education. Thus, families with children in these countries need less money to buy these critical supports for child development than in the United States.
Income and Child Health and Development
Three major pathways have been proposed through which a child allowance and other sources of family income may affect child health and development: investments in children’s learning, positive effects on biological and stress processes, and improvements in cognitive bandwidth and decision-making processes. With their investment perspective, economists argue that time and money are the two basic resources parents draw upon to invest in their children. Such investments as high-quality childcare and education, housing in good neighborhoods, and rich learning experiences enhance children’s development, as do investments of parents’ time.
Gary Becker’s household production theory suggests that children from poor families lag behind their economically advantaged counterparts in part because their parents have fewer resources to invest in them (1991). Compared with more affluent parents, poor parents are less able to purchase inputs for their children, such as books and educational materials at home, high-quality child care settings and schools, and safe neighborhoods (Kaushal, Magnuson, and Waldfogel 2011).
Evidence suggests that the level of cognitive stimulation in the home environment varies with family income (Votruba-Drzal 2006). Economically disadvantaged parents may also have less time to invest in their children, owing to higher rates of single parenthood, nonstandard work hours, and less flexible work schedules. This too may have negative consequences for children. In sum, the investment perspective contends that family income matters to children because it enables parents to buy a variety of things that support learning and healthy development.
As formulated by developmental psychologists and neuroscientists, the family and environmental stress perspective holds that low-resourced families face significant economic pressure as they struggle to make ends meet. Given high levels of intra-year income volatility, such pressures may even be felt by families with annual incomes above poverty, who experience such negative shocks as illness, layoff, or seasonal fluctuations in work hours during the year. For poor parents, economic pressure creates high levels of psychological distress, including depressive and hostile feelings (Kessler and Cleary 1980; Gennetian and Shafir 2015), and leads to increased stress and worse mental health (Evans and Garthwaite 2014).
Psychological distress, in turn, spills over into marital and co-parenting relationships. As couples struggle to make ends meet, their interactions may become more hostile and conflicted, leading to parenting practices that are on average more punitive, harsh, inconsistent, and detached, as well as less nurturing, stimulating, and responsive to children’s needs (McLoyd 1990). Such lower-quality parenting is likely to elevate children’s physiological stress responses, and ultimately harms children’s development (Conger et al. 2002).
Stress processes linked to poverty include detrimental changes in the body’s hormonal responses to prolonged stress (HPA axis processes), as well as alterations in immune and aging processes linked to adversity (Shonkoff, Garner, et al. 2012). Evidence also exists that brain activity and even early brain volume are associated with socioeconomic status, although the existing studies are correlational (Noble, Engelhardt, et al. 2015; Noble, Houston, et al. 2015; Hair et al. 2015). These changes in turn are linked to poorer health as well as worse learning outcomes in adolescence and later adulthood (Ziol-Guest et al. 2012).
Finally, as discussed in the context of income instability, poverty conditions can compromiseparents’ cognitive resources (bandwidth) and have detrimental consequences for cognitive tasks and financial and other decision making (Gennetian and Shafir 2015). All told, the conceptual linkages between family income and the developmental needs of children and adolescents suggest that the kind of completely dependable base-level monthly income support provided by our proposed universal child allowance would have substantial benefits, especially for children with family incomes below or near the poverty line.
Evidence on Income Effects
A large body of nonexperimental literature finds that poverty is associated with perinatal problems and reductions in children’s cognitive skills, academic achievement, educational attainment, and earnings (Aizer et al. 2016; Duncan and Brooks-Gunn 1997; Ziol-Guest et al. 2012; Almond, Currie, and Duque 2017; and others summarized in Butcher 2016). Evidence also links family income poverty with a range of poor health outcomes, both communicable and noncommunicable diseases in adulthood, for example (Marmot et al. 2008). Associations with child socioemotional outcomes and mental health are smaller, but also consistent in this literature (Yoshikawa, Aber, and Beardslee 2012).
Fewer causal studies have been conducted, and clearly more research is needed, especially in the U.S. context. Two coordinated sets of income maintenance and welfare reform experiments spanning the 1970s through the 1990s show mixed effects of boosts to family income during adolescence (Morris, Duncan, and Clark-Kauffman 2005; Maynard 1977; Maynard and Murnane 1979). However, experimentally induced boosts to family income when children are making the transition to formal schooling appear to raise levels of academic achievement. On average, these latter experiments showed that a boost of $4,000 per year for two to three years is associated with a 0.18 standard deviation increase in academic achievement (Duncan, Morris, and Rodrigues 2011).
A quasi-experimental literature has investigated relatively exogenous sources of variation in tax benefits such as the U.S. EITC and Canadian child allowance (referred to as a child tax credit), finding improvement in birth outcomes (Strully, Rehkopf, and Xuan 2010), improved health among adults and children, and increased school achievement in middle childhood (Dahl and Lochner 2012; Milligan and Stabile 2011; Nichols and Rothstein 2016). Casino windfall cash disbursements have also been linked to higher achievement and educational attainment, reduced incidence of risk behaviors in adolescence, and improved health outcomes (Akee et al. 2010; Costello et al. 2003; Wolfe et al. 2012). A recent randomized control trial of conditional cash transfers for families with children in two U.S. cities found that the program led to increased income and savings, reduced poverty and material hardship, improvements in some health outcomes, and increased life satisfaction among parents. It did not lead to academic improvements among participating children, and did lead to a reduction in employment, mostly driven by one site—Memphis (Miller et al. 2016).
The theoretical case for the positive effects of income transfers is strongest for very young children because the developing brain is more sensitive to environmental influences, both enrichment and adversity, in the first years of life (Center on the Developing Child 2016; Duncan, Magnuson, and Votruba-Drzal 2014). A recent study of an unconditional prenatal income supplement in Canada found it to be associated with a number of positive outcomes at birth (Brownell et al. 2016). Further evidence comes from a study matching the timing of the rollout of the Food Stamp Program across U.S. counties in the 1960s and 1970s to data from the Panel Study of Income Dynamics, which finds an association between food stamp availability and reduced risk of ill health in adulthood as well as positive impacts (for females only) on educational attainment and other indicators of economic self-sufficiency (Hoynes, Schanzenbach, and Almond 2016). The largest adult impacts were associated with the availability of food stamps prior to birth, and the outcomes gradually declined as the age at food stamp introduction increased from birth to age five. Anna Aizer and her colleagues also find long-run improvements in children’s health associated with maternal receipt of social benefits early in life—in this case from the Mother’s Pension program established in the early part of the twentieth century (2016).
Although some forms of in-kind benefits have also been shown to improve the lives of poor families, cash transfers may be more effective because cash is fungible, allowing families more freedom to efficiently allocate benefits to address their specific needs (Hammond and Orr 2016; Muennig et al. 2016; Edin and Shaefer 2015). In-kind transfers may lead to unintended changes in behavior as families overconsume based on what benefits are available (Hammond and Orr 2016).
In sum, a number of evaluations using a variety of associational and quasi-experimental methods suggest that cash or near-cash transfers in a variety of forms can be an effective and cost-effective way to improve the health and material well-being of poor families across a number of domains (Akee et al. 2010; Brownell et al. 2016; Butcher 2016; Halpern-Meekin et al. 2015; Muennig et al. 2016; Wolfe et al. 2012). Added to this is experimental evidence from developing countries that find cash transfer can be an effective method of social support (Banerjee et al. 2015; Haushofer and Shapiro 2016).
Income Stability
Evidence indicates that economic instability and income and expenditure volatility both within and across years have increased over the past two decades (Sandstrom and Huerta 2013; Jacobs and Hacker 2008). These frequently result from excessive reliance on short-term employment, unexpected major expenses, unreliable work schedules, depletion and loss of capital and assets, and increased difficulty in saving money (Morduch and Schneider 2017; Sandstrom and Huerta 2013). Family income instability can also result from changes in the composition of members who contribute income to the family (Sandstrom and Huerta 2013).
Income instability is associated with higher rates of marital hardship, financial uncertainty, poorer adolescent school behaviors, eviction, psychological distress, and increased health problems (Morduch and Schneider 2017; Sandstrom and Huerta 2013; Choi 2009; Brown 2006; Desmond 2016; Gennetian and Shafir 2015). Research also finds that income instability is associated with reduced parenting quality. Studies show that low-income individuals direct a disproportionate amount of their time and mental capacity to addressing monthly ongoing poverty-related concerns (Mani et al. 2013). This means that when families experience economic hardship, parents are limited in their psychological ability to engage in activities that may enrich their children’s lives (Osborne, Berger, and Magnuson 2012).
Instability may further compound the physiological and mental effects of poverty as families who experience economic instability show more parenting stress and depression (Osborne, Berger, and Magnuson 2012; Meadows, McLanahan, and Brooks-Gunn 2008). Such instability exacerbates stress and clinical depression in poor families, increasing the likelihood that they will make bad decisions in difficult situations. In their work examining the negative toll of scarcity, Sendhil Mullainathan and Eldar Shafir argue that income and expense volatility is a source of stress in and of itself, with detrimental effects on poor families (2013). In fact, literature in the natural sciences finds that unpredictability or instability early in life may be even more harmful than chronic low income (Rosenblum and Andrews 1994; Rosenblum and Paully 1984). Some literature in psychology has linked unpredictability in early childhood to adverse outcomes later in life (Doom, Vanzomeren-Dohm, and Simpson 2016).
BASING POLICY ON EVIDENCE AND PRINCIPLES
Although the work-based safety net in the United States is successful in many respects, our broader look at the nation’s policies for providing economic support for its children has shown that much of the aid is directed toward middle- and high-income families, and very little cash support is available to the nation’s poorest children. Furthermore, the disbursement of much of this economic support is lumpy, which can create intra-year boom- and-bust cycles for families.
To counteract these shortcomings, we propose a universal monthly child allowance that would replace our country’s existing Child Tax Credit and child tax exemption. We have based our design on a set of core analytic principles intended to inform policy discussions. Agreement on core principles can support consensus about the general design of any policy, in this case income-based policies that support families with children. We propose five core principles and three policy alternatives based on them. Our simple policy alternative draws on principles one through three; our tiered alternative draws on one through four; and our tiered and equivalized option draws on all five:
The child allowance should be universal because all families incur substantial expenses on behalf of their children and the healthy development of all children is in the nation’s interest.
The allowance should be readily accessible and of sufficient frequency to meet short-run cash needs. This would be accomplished through a monthly electronic benefit transfer and help address the growing problem of income instability.
Payment levels should be adequate for a family to address the basic needs of its children, which research suggests is in the range of $250 per month per child.
Families with younger children should be eligible for larger payments because early childhood is when children’s developmental needs are greatest, the costs of child rearing are highest, and family incomes tend to be lowest.
Policymakers should consider whether per child payment levels should decline with additional children, reflecting economies of scale present in larger families.
Three proposed versions of a child allowance include simple (monthly payments of $250 per child per month for all children under age eighteen), tiered (monthly payments of $300 per child under age six, $250 per child age six through seventeen); tiered and equivalized (monthly payments of $300 for the first child under age six and $250 for the first child age six through seventeen, with a reduction in these benefit levels as the number of children in the household increases). In each case, payments would be taxed at the marginal income tax rate of the unit claiming the child.
Universal Child Allowance
Universality is appropriate because resource needs increase universally with additional children in the household, and we all have a common interest in our nation’s children. Children need to be fed, clothed, and housed, but parents’ desires to promote the future well-being of their children lead them to spend an additional $3,586 per child per year on enrichment items such as childcare, lessons, and summer camps (Kaushal, Magnuson, and Waldfogel 2011).4 A universal child allowance would help to support both basic needs and enrichment.
The better children in our country do, the more they can contribute economically, socially, and culturally to our country throughout their lifetimes. Providing a universal child benefit is a material and symbolic expression of our common interest in their welfare. Local and state governments in the United States recognized this common interest by leading the world throughout most of the nineteenth and twentieth centuries in the public provision of universal elementary and secondary education. These investments in the education of all of our nation’s children—done through a universal mechanism—is one reason the United States is now the richest large nation on earth (Garfinkel, Rainwater, and Smeeding 2010; Goldin and Katz 2009).
Recognizing that raising children is a costly endeavor for families, the U.S. federal income tax system already allows parents—except for those with the lowest and highest incomes—to receive a credit of $1,000 per child from their taxes owed. Families may further deduct up to $4,000 per child from their taxable income, but again families with very low incomes do not benefit. For recipient families, this tax credit and exemption are economically equivalent to a child allowance consisting of a single annual payment. Our proposed child allowance payments would be more generous, would be paid monthly and would include families from both the poorest and the wealthiest families.
Some argue that benefits should be focused only on children in poor families, excluding those with higher incomes. The poorest families are clearly the neediest. Programs limited to the poor, like SNAP and TANF, relieve poverty and prevent hardship. But they also create labor disincentives by reducing benefits as incomes increase, a problem that would be muted with a universal child allowance because it does not impose a marginal tax rate other than standard income tax rates. Stigma associated with means-testing also leads some in need to decline benefits, and may have unintended negative effects on those who participate (Halpern-Meekin et al. 2015). Furthermore, the process of means-testing requires an expensive administrative apparatus to certify and recertify need. Determinations must be made on who is in need and how often need should be assessed. In contrast, relying on a universal benefit that is taxed as income would circumvent all these issues, as well as the need for administrative structures to impose means-tests in favor of systems that already exist.
In the United States today, near-poor, lower middle-income and even middle-income families with children struggle to meet their child rearing expenses, and would benefit from a universal child allowance. By providing benefits to all children, a universal child allowance would provide a solid income floor that would reduce poverty, integrate the poor into mainstream society, and increase the economic security of all children. Universal programs also enjoy more popularity than safety net programs targeting only poor families.
Readily Accessible and Frequent Allowance
Intra-year income instability is a large and growing problem for poor and working-class families with children. Refundable tax benefits paid as a lump sum at tax time allow families to pay for large expenses at that time, but make it difficult for them to make ends meet across lean months of the year (Nichols and Rothstein 2016). A better policy would disperse benefits with sufficient frequency to moderate the boom-and-bust cycle built into the low-wage labor market, today’s family dynamics, and even the safety net. We propose a monthly approach. The U.S. Social Security system currently pays monthly cash benefits to a large number of aged, disabled and survivor recipients in an efficient manner. Our child allowance could work in the same way.
Adequate Payment Levels
We propose that a child allowance be designed to help families fill the gap between their available resources and the costs of their basic needs. Detailed accounts comparing the incomes and expenditures of poor families with children find that the average poor family experiences a significant monthly shortfall, usually on the order of a few hundred dollars (Halpern-Meekin et al. 2015; Lugo-Gil and Yoshikawa 2006; Edin and Lein 1997). Qualitative research shows that families at the bottom use a variety of survival strategies in efforts to fill that gap. Recent research (conducted by some of us) finds that low-income families perceive that an infusion of even a small amount of cash income can make a big difference in family well-being, even if it is not enough to meet the basic needs of children on its own (Edin and Shaefer 2015; Rojas et al. forthcoming). Research suggests that an annual benefit in the amount of $1,000 or more could impact a range of outcomes (Duncan, Morris, and Rodrigues 2011; Dahl and Lochner 2012; see also Bitler, Hines, and Page 2018).
More research is needed to understand precisely where a child allowance benefit level should be set. Both resources needed by low-income families, as well as parameters of child development spending for families higher up the income spectrum should be considered. For the purposes of this analysis, we set our baseline payment level at $250 per child per month, which would place it within the range of existing child benefit levels in other countries, and large enough that existing research would suggest the benefit could have a meaningful impact.
Larger Payments for Younger Children
Early childhood presents a perfect storm of difficult conditions, which could be addressed by a child allowance. First, it is a time of astonishingly rapid development, when children’s brains are acquiring critical neural function and structures that serve as the foundation for future cognitive, social, emotional, and health outcomes (Nelson and Sheridan 2011). Evidence reviewed in the previous section suggests that the development of young children may be most responsive to increases in household income. Second, early childhood is the time when key child enrichment expenditures—in particular childcare—are highest. Data from the Consumer Expenditure Survey show that although total expenditures on child enrichment tend to be higher for school-age than preschool children, key expenditures on child care tend to be much higher ($1,438 versus $240 per child per year) for families with only preschoolers relative to families with only school-age children (Kaushal, Magnuson, and Waldfogel 2011). Childcare for infants and toddlers is particularly expensive because infants and toddlers require much closer adult contact than older preschoolers do.
Third, parents of young children tend to have lower family incomes than parents of older children. Census Bureau data for 2014 show that nearly one-quarter (23.5 percent) of children under age six live in families with cash incomes below the official poverty line, versus less than one-fifth (19.4 percent) of children age six and older. More than 2.5 million infants, toddlers, and older preschoolers live in deep poverty, defined as income less than one-half of the official poverty line (Jencks 2016). These considerations argue in favor of higher child allowance payments to families with young rather than older children, which we operationalize as an additional $50 per month per child under the age of six. At the same time, however, we note that an undifferentiated payment has the virtue of simplicity and constitutes a symbolic and practical expression of the ethical belief that all children are equally deserving.
Payments and Additional Children
Whether benefits should decline with additional children to reflect economies of scale is a question policymakers should consider. A common practice in studies of family wellbeing is to adjust income for family size, reflecting a less-than-proportional increase in expenses as the number of family members increases. Consensus on exactly what those adjustments should look like (see, for example, Anyaegbu 2010), however, has not been reached and so we do not include such an adjustment in two of our three proposed policy versions. At one extreme is the assumption that all family members add the same amount to a family’s need for income, for example, families with four members generate twice the need for income as families with only two members. This is almost certainly not always the case—despite the fact that childcare expenses increase directly with the number of children—given that expenditures on, say, heating or cooling a home hardly change with additional family members. Also, younger children can double up in bedrooms, reducing the need for more expensive housing. Carried to an extreme, this argument suggests that additional members add nothing to family needs; but this is clearly not the case, given the importance of expenditures such as food, which do increase. A critical question is how exactly families would allocate child allowance benefits. Economies of scale will apply in some cases but not others.
One can express the spectrum of possible adjustments with the exponent X in the following simple equation:
where X=1 in the case of equal needs for all family members and X=0 if needs do not increase at all with increases in family size (Buhmann et al. 1988).
When the National Research Council issued its recommendations for a new poverty measure, it proposed that X be set in the range of 0.65 to 0.75 (Citro and Michael 1995, 162). We adopted a 0.70 value, which effectively assumes that two children generate needs for income that are 62 percent more than one, and that three children generate 2.2 times the needs of one.
UNIVERSAL CHILD ALLOWANCE AND ITS IMPACTS ON POVERTY
We simulate three potential universal child allowance models. In our simple proposal, based on principles one through three, every child, regardless of age, receives $250 per month. Payments would be taxed back at marginal tax rates and would replace the existing Child Tax Credit, the Additional Child Tax Credit, and the child exemption. In our tiered version based on principles one through four, the benefit varies by age, with children under age six receiving $300 per month instead of $250, and all else being the same as in the first model. Finally, in our tiered and equivalized model, we apply an equivalence scale to the second model, allowing benefits to be reduced for each additional child in the family (based on principles one through five).
Impacts on Poverty
To assess the likely effects of a universal child allowance on poverty among children in the United States, we simulated the addition of child allowance payments to total family income for 2015 in the Current Population Survey’s (CPS) Annual Social and Economic Supplement (ASEC), the same dataset used to compute annual official and supplemental poverty statistics (see the appendix for technical details; the simulations build on analyses presented in Garfinkel et al. 2016). For poverty and deep poverty estimates, we use the supplemental poverty measure. We report on impacts on child poverty rates (defined as total resources falling under 100 percent of the supplemental poverty threshold), deep poverty rates (defined as total resources falling under 50 percent of the poverty threshold), and a variation on the Shaefer and Edin extreme ($2 per day) poverty rate, defined here as annual cash incomes falling under a $2 per person, per day threshold (Shaefer and Edin 2013; Edin and Shaefer 2016).5
The core results of our simulations are shown in figure 3. The leftmost columns in figure 3 show child poverty, deep poverty, and extreme poverty rates as they stood in 2015. Under current anti-poverty policy, child poverty stands at 16.1 percent, deep poverty at 4.9 percent, and annual extreme poverty at 1.7 percent.
Figure 3.
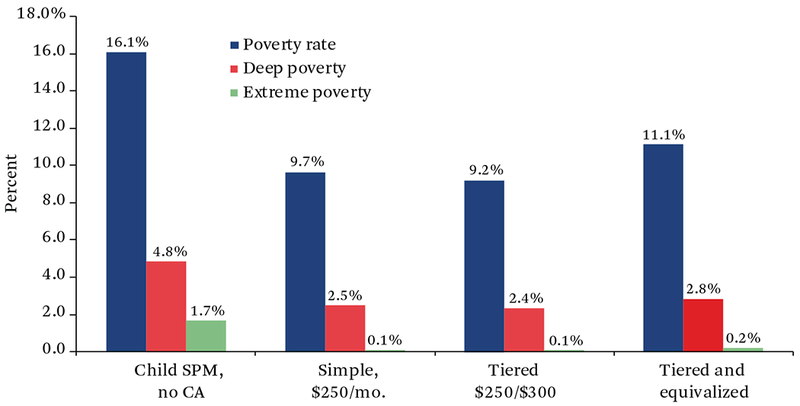
Child Poverty Falls Dramatically with a Universal Child Allowance
Source: Authors’ calculations based on CPS ASEC data (Flood et al. 2017).
The remaining bars in figure 3 show the effects of a universal child allowance on various poverty metrics after we conduct the steps outlined above. Under our simple model, if we were to adopt a universal $250 per month child benefit regardless of age, our estimates show that child poverty would fall by approximately 40 percent, from 16.1 percent to 9.7 percent. Deep poverty would be cut nearly in half, from 4.9 percent to 2.5 percent. And extreme poverty would be virtually eliminated (down to 0.1 percent). If younger children were granted $50 more per month, as shown in the tiered model (model 2), child poverty would fall even more, to 9.3 percent. Deep poverty would not be reduced much further, while extreme poverty for children would again be effectively eliminated.
In the rightmost set of bars (model 3), we show the effect of a benefit that is tiered and equivalized (that is, adjusted for family size). Shrinking the benefit amount for additional children would result in a drop in child poverty from 16.1 percent to “only” 11.1 percent, in contrast to the unequivalized mixed-age benefit, which would reduce poverty to 9.7 percent. Deep poverty, too, would not be reduced as much, while extreme poverty would still be virtually eliminated.
Figure 4 repeats the analyses from figure 3, but displays results for children under the age of six. This exercise illustrates the extent to which the mixed model, with enhanced payments for those under six, results in greater reductions in poverty (and deep poverty) for those children targeted by the enhancements. We do not show results for extreme poverty here because of the limited size of the sample and also because we know that such benefits would eliminate extreme poverty for all children.
Figure 4.
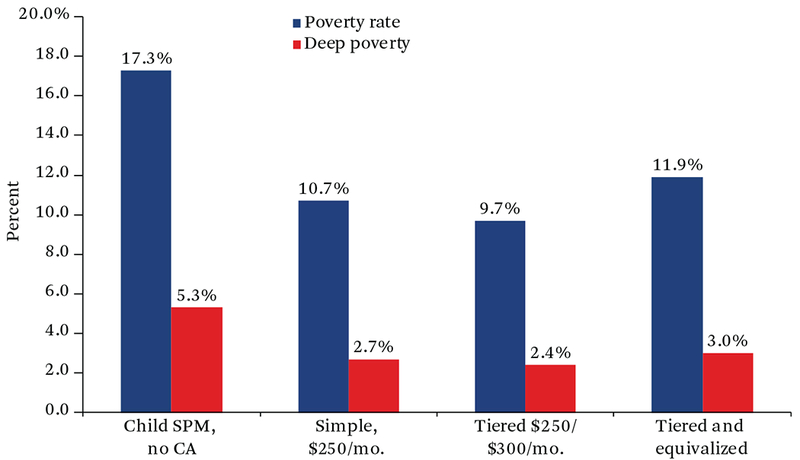
Young Child Poverty Falls Dramatically with a Universal Child Allowance
Source: Authors’ calculations based on CPS ASEC data (Flood et al. 2017).
Comparing the results in figures 3 and 4, we can see that child poverty is higher among younger children (17.3 percent) than all children (16.1 percent), which is well known. As it does for all children, a simple universal child allowance of $250 a month reduces young-child poverty by about 38 percent, from 17.3 percent to 10.7 percent. It also reduces young-child deep poverty by nearly 50 percent. The tiered model, with enhanced payments, results in a slightly larger decline in young-child poverty (44 percent) than for child poverty overall (40 percent). The equivalized benefit yields less reduction in poverty and in deep poverty among young children, as it does for all children.
In figure 5, we take our simple child allowance version and estimate the policy’s differential effects on poverty (using the SPM) by race and ethnicity and household structure. We find that the proportional change in poverty caused by a child allowance is relatively similar across race and ethnicity, even as the underlying starting rates of poverty pre-reform are starkly different. The poverty rate of black and Hispanic children both fall from a little above 24 percent to just over 14 percent (a bit more than a 40 percent drop), and that among non-Hispanic white children from 10.3 percent to 6.2 percent.
Figure 5.
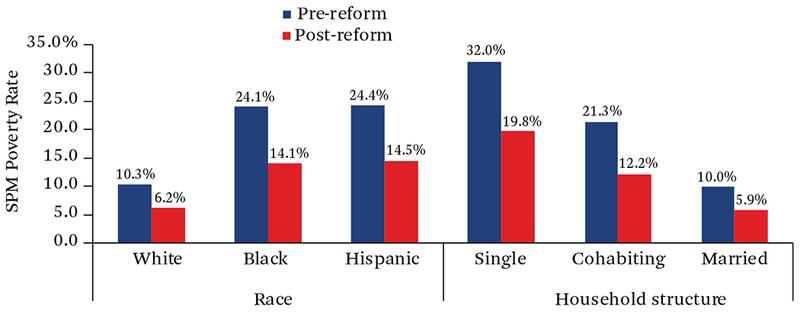
Poverty Rates for Children Within Demographic Groups
Source: Authors’ calculations based on CPS ASEC data (Flood et al. 2017).
When examining the changes by household structure, the poverty rate among children living in single-mother household living alone falls from 32.0 percent to 19.8 percent (a 38.1 percent drop), slightly less than among children in married families (41.2 percent), the biggest drop being among families with unmarried co-habiting partners (from 21.3 percent to 12.2 percent).
Finally, figure 6 explores the net benefit of our proposed policy reforms for recipient families, again using our baseline, simple child allowance version. On the vertical axis is the net benefit families receive after adding the child allowance and subtracting expected lost benefits from the refundable component of the CTC and child exemption. (Net benefit does not reflect additional funding changes needed to raise the revenue to cover the full child allowance benefit at this level. Net costs are discussed in more detail in the next section.) The horizontal axis plots total income of families with children. At a $250 per child benefit, all families across the income spectrum benefit. However, the net benefit of the policy reform declines smoothly as income rises until annual family income level reaches just over $100,000, where it dips slightly, and then essentially levels out over the remainder of the distribution. This chart suggests that the net benefit of the policy change would be positive, even at lower benefit levels.
Figure 6.
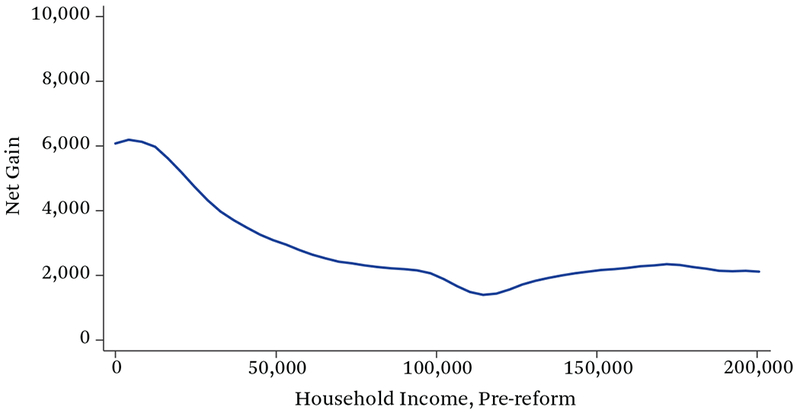
Net Gain in SPM Resources for Recipient Families
Source: Authors’ calculations based on CPS ASEC data (Flood et al. 2017).
Note: The net gain in does not account for the $93 billion additional cost of the child allowance, only the net gain of the child allowance subtracting the CTC and child exemption.
Estimating the Cost of Our Universal Child Allowance
Estimates of the likely annual costs of our proposals are shown in table 1. Our simple plan would generate $190 billion in total direct costs (in the form of benefits paid); the tiered model would add $12 billion to this sum. Reducing benefits for additional children to reflect economies of scale reduces costs to a still-substantial $163 billion.
Table 1.
Cost Estimates of Universal Child Allowance Proposals (in Billions)
| Total Direct Cost | Cost Savingsa | Net Cost of CA | |
|---|---|---|---|
| Universal $250/mo. CA | $190 | $97 | $93 |
| Tiered $250/$300/mo. CA | 202 | 97 | 105 |
| Tiered and equivalized CA | 163 | 97 | 66 |
Source: Authors’ compilation based on Tax Policy Center 2016.
Cost savings are the estimated results of eliminating the CTC, ACTC, and also the child exemption under federal tax law.
These figures overestimate net costs of our proposed policy reform, however, because they do not account for savings from the elimination of the $4,000 per child tax exemption and the Child Tax Credit and Additional Child Tax Credit (ACTC) now available to families with children under the federal tax code. Results provided by the Urban Institute’s Tax Policy Center indicate that the joint cost of these three benefits (the CTC, ACTC, and child tax exemption) in 2015 was approximately $97 billion. The net costs of a universal child allowance are therefore considerably smaller than the total costs, though still substantial. The net cost of a universal $250 per month benefit would be $93 billion, the tiered model $105 billion, and the net cost of a tiered and equivalized model about $66 billion.
The net costs of our proposal are higher than those that Marianne Bitler, Annie Laurie Hines, and Marianne Page propose in this issue (2018) because we propose a higher benefit more in line with existing child allowances, and do not repurpose funding from the child-related parts of the EITC to pay for our proposed benefit so that it continues to provide an incentive for employment. The Bitler, Hines, and Page proposal focuses on what is possible to even out the safety net while being revenue neutral. In terms of the added net cost of our proposal, though substantial, it could be paid for in a variety of ways, such as increasing marginal income tax rates or increasing taxes on investment income. One could tax benefits back for high-income earners at a higher rate, similar in effect to how the current CTC and child exemption phase out with higher earnings. Such measures would reduce or eliminate the net benefit of the policy reform to upper income taxpayers.
Further Considerations
What would it take for our proposal to be revenue neutral, that is, zero net cost to the federal budget? As an exercise in budget balancing, we calculated that the cost of a $125 monthly child allowance or a $150 equivalized monthly allowance would roughly match savings from the $97 billion elimination of the Child Tax Credit and child tax exemption (Tax Policy Center 2016). This calculation shows the inherent fiscal feasibility of a U.S. child allowance, although research suggests that a family’s need for monthly cash income per child exceeds $150, and this benefit level combined with our proposed reforms would lead to some net losers among middle-income families. For this reason, we prefer to set the amount at $250 per child and consider ways to raise the needed revenue.
In our plan, the EITC remains unchanged as an incentive for employment and annual income supplement. TANF could remain as is, and funds could be used to promote employment, training, and childcare as states see fit. Although we would consider our child allowance to be taxable income, our proposal does not consider it as countable income in determining benefits from programs like SNAP, as is true of the current Child Tax Credit. Doing so would clearly reduce the costs of those programs and in turn reduce the net cost of our proposed CA. With expenditures on children through SNAP, TANF, low-income housing assistance, and child benefits in Supplemental Security Income (SSI) totaling roughly $52 billion in 2015 (figure 1), savings resulting from considering our CA as countable income might reduce its cost by around $16 billion. Even in this case, research suggests families would benefit from the fact that our CA would substitute flexible cash for a portion of the inkind benefits they received from SNAP and housing assistance programs (Edin and Shaefer 2015). However, reducing other benefits would reduce the overall value of the new child allowance and for that reason we do not propose it here.
CONCLUSION
Through its child tax exemption and Child Tax Credit, our nation recognizes the value of assisting parents in paying for the costs of raising children. At nearly $100 billion per year, these tax-based benefits represent, in effect, sizable annual child allowance payments to middle-income families. We have argued that the structure of these two programs is not in keeping with a principled approach to supporting our nation’s children. They omit the lowest (and highest) income families and, in the case of the child tax exemption, benefits generally increase with income. Their once-yearly payment schedule is poorly suited to the growing number of families with month-to-month income instability.
Transforming the Child Tax Credit and child tax exemption into a universal child allowance for all American children would reflect the implicit recognition embedded in the tax code that families incur significant expenses when raising children. In addition, our universal child allowance would provide a base-level source of cash support—an income floor—for our most vulnerable families, and indeed all families with children. It would complement our nation’s work-based safety net because the child allowance would not be reduced as earnings increase. And because it would be available to all children, its benefits would not suffer the stigma attached to existing means-tested income transfer programs or the hassle of recertification of benefits, except at tax time.
Our simulations of a universal child allowance show that child poverty would be cut by over 40 percent over current levels, and deep child poverty would be cut by half. Extreme, $2 per day, poverty among children would be eliminated. To be sure, the costs involved would be substantial. But this investment would lead to large and direct reductions in child poverty, and might also have a significant effect on the poverty and well-being of future generations.
APPENDIX: SIMULATION PROCEDURES
We based our simulation on the CPS ASEC, a nationally representative household survey conducted each year and containing detailed information on the demographics, incomes, and other characteristics of approximately two hundred thousand Americans. We begin by using data from the 2016 CPS ASEC, which is the most recent available dataset as of this writing. The data were extracted from the University of Minnesota’s Integrated Public Use Microdata Series (Flood et al. 2017).
The basis for our simulations is the Supplemental Poverty Measure released by the Census Bureau and the Bureau of Labor Statistics. The SPM is the result of decades of scholarly work designed to improve the measurement of income poverty in the United States (Citro and Michael 1995; Short 2015). Details of the measure can be found elsewhere (for the latest detailed methodology, see Short 2015); briefly, the SPM is an improvement over official statistics in at least four key respects: its poverty thresholds are based on contemporary patterns of living standards and expenditures on a core bas ket of necessities; it uses a broader definition of the family unit that includes cohabiters, foster children, and some unrelated children alongside family members related by blood, marriage, or adoption; it uses poverty thresholds that vary by housing status and geographic differences in the cost of living; and it uses a broader definition of resources, which accounts for after-tax income, the value of in-kind benefits like food stamps and housing assistance, and the deduction of out-of-pocket expenses on necessities like work, childcare, and medical care. This last improvement is most critical for the current analysis because it is the foundation of our child poverty estimates that more fully account for the total resources available to families with children. This is because official statistics simply ignore resources coming from anti-poverty programs that work through the tax system or take the form of nearcash (or in-kind) benefits.
To simulate the effects of a universal child allowance, we first assign annual child allowance income values to all children meeting key age criteria. For example, under a universal $250 per month child allowance, we would assign $3,000 to every child in the microdata up to age seventeen. Under a mixed model, children under age six receiving $300 per month and older children $250, we assign all children age six through seventeen $3,000 and all children from birth to age five $3,600. We then total this income within SPM family units and assign it to all members of the SPM family. Because we envision that the child allowance would replace the CTC and ACTC, we also zero out the total values of both programs.
We then assume that income from the child allowance, which is universal, would be taxed like any other source of income. To accomplish this in the microdata, we apply the marginal tax rate of the tax filer provided by the census tax calculator to the new income assigned to the family. We then recalculate family income by adding the value of the taxed-back child allowance and subtracting the old values of the CTC and ACTC, and compare this recalculated family income to the SPM poverty thresholds in the data. In one of our simulations, we also apply an equivalence scale to the benefit before taxing it back and recalculating poverty rates. The equivalence scale we adopt is: (number of children in the SPM unit)^07.
Footnotes
1. In statutory law, the Child Tax Credit refers to the nonrefundable credit. The Additional Child Tax Credit (ACTC) refers to the refundable portion of the CTC. When we use CTC, we refer to both the nonrefundable component (the CTC) and the refundable component (the ACTC), as is common when discussing the policy.
2. Christopher Wimer and Timothy Smeeding show that the SPM poverty line is about 40 percent of median income; here again the United States does poorly according to LIS and the SPM, which cite a poverty rate of 16 to 18 percent (Wimer and Smeeding 2016, figure 3). Children are deemed poor in Europe if their total household net incomes fall below 60 percent of a given year’s median, a poverty line that is more than half again as high as the SPM line. By that definition, child poverty is about 26 to 27 percent in the United States and far lower in the EU (Wimer and Smeeding 2016, figure 4).
3. The amounts are gradually reduced with income. Thus, it is not a true universal system, but near universal.
4. This figure is based on the 1996 to 2007 Consumer Expenditure Surveys and has been inflated to 2015 dollars.
5. In the CPS microdata, a small number of cases are recorded as having negative total SPM family income. This is a result of negative values that can result from business or farm losses or from the SPM’s subtraction of expenses from income. We set these negative values to zero before beginning our simulations.
REFERENCES
- Aizer Anna, Eli Shari, Ferrie Joseph, and Lleras-Muney Adriana. 2016. “The Long Run Impact of Cash Transfers to Poor Families.” American Economic Review 106(4): 935–71. [DOI] [PMC free article] [PubMed] [Google Scholar]
- Akee Randall K. Q., Copeland William E., Keeler Gordon, Angold Adrian, and Costello E. Jane. 2010. “Parents’ Incomes and Children’s Outcomes: A Quasi-Experiment Using Transfer Payments from Casino Profits.” American Economic Journal: Applied Economics 2(1): 86–115. [DOI] [PMC free article] [PubMed] [Google Scholar]
- Almond Douglas, Currie Janet, and Duque Valentina. 2017. “Childhood Circumstances and Adult Outcomes: Act II.” NBER working paper no. 23017. Cambridge, Mass: National Bureau of Economic Research; Accessed September 22, 2017 http://www.nber.org/papers/w23017. [Google Scholar]
- Anyaegbu Grace. 2010. “Using the OECD Equivalence Scale in Taxes and Benefits Analysis.” Labour Gazette 4(1): 49–54. [Google Scholar]
- Banerjee Abhijit, Duflo Esther, Goldberg Nathanael, Karlan Dean, Osei Robert, Pariente William, Shapiro Jeremy, Thuysbaert Bram, and Udry Christopher. 2015. “A Multifaceted Program Causes Lasting Progress for the Very Poor: Evidence from Six Countries.” Science 348(6236). doi: 1260799. [DOI] [PubMed] [Google Scholar]
- Becker Gary S. 1991. A Treatise on the Family. Cambridge, Mass: Harvard University Press. [Google Scholar]
- Bitler Marianne P., Hines Annie Laurie, and Page Marianne. 2018. “Cash for Kids.” RSF: The Russell Sage Foundation Journal of the Social Sciences 4(2): 43–73. DOI: 10.7758/RSF.2018.4.2.03. [DOI] [Google Scholar]
- Brown Susan L. 2006. “Family Structure Transitions and Adolescent Well-Being.” Demography 43(3): 447–61. [DOI] [PubMed] [Google Scholar]
- Brownell Marni D., Chartier Mariette J., Nickel Nathan C., Dan Chateau, Martens Patricia J., Sarkar Joykrishna, Burland Elaine, Jutte Douglas P., Taylor Carole, Santos Robert G., and Katz Alan. 2016. “Unconditional Prenatal Income Supplements and Birth Outcomes.” Pediatrics 137(6): 1–11. [DOI] [PubMed] [Google Scholar]
- Buhmann Brigitte, Rainwater Lee, Schmaus Guenther, and Smeeding Timothy M.. 1988. “Equivalence Scales, Well-Being, Inequality, and Poverty: Sensitivity Estimates Across Ten Countries Using the Luxembourg Income Study (LIS) Database.” Review of Income and Wealth 34(2) (June): 115–42. [Google Scholar]
- Butcher Kristin F. 2016. “Assessing the Long-Run Benefits of Transfers to Low-Income Families.” Paper presented at the Hutchins Center event “From Bridges to Education: Bet Bets for Public Investment,” Brookings Institution, Washington, D.C. (January 9, 2016). Accessed September 20, 2017 https://www.brookings.edu/research/assessing-the-long-run-benefits-of-transfers-to-low-income-families/. [Google Scholar]
- Center on the Developing Child. 2016. Harvard University; Accessed November 17, 2017 https://developingchild.harvard.edu. [Google Scholar]
- Choi Laura. 2009. “Financial Stress and Its Physical Effects on Individuals and Communities.” Community Development Investment Review 5(3): 120–22. [Google Scholar]
- Citro Constance F., and Michael Robert T., eds. 1995. Measuring Poverty: A New Approach. Washington, D.C.: National Academy Press. [Google Scholar]
- Conger Rand D., Wallace Lora E., Sun Yumei, Simons Ronald L., McLoyd Vonnie C., and Brody Gene H.. 2002. “Economic Pressure in African American Families: A Replication and Extension of the Family Stress Model.” Developmental Psychology 38(2): 179–93. [PubMed] [Google Scholar]
- Costello E. Jane, Compton Scott N., Keeler Gordon, and Angold Adrian. 2003. “Relationship Between Poverty and Psyschopathology: A Natural Experiment.” Journal of the American Medical Association 290(15): 2023–29. [DOI] [PubMed] [Google Scholar]
- Dahl Gordon B., and Lochner Lance. 2012. “The Impact of Family Income on Child Achievement: Evidence from the Earned Income Tax Credit.” American Economic Review 102(5): 1927–56. [Google Scholar]
- Desmond Matthew. 2016. Evicted: Poverty and Profit in the American City. New York: Crown. [Google Scholar]
- Doom Jenalee R., Vanzomeren-Dohm Adrienne, and Simpson Jeffry A.. 2016. “Early Unpredictability Predicts Increased Adolescent Externalizing Behaviors and Substance Use: A Life History Perspective.” Development and Psychopathology 28(4): 1505–16. [DOI] [PMC free article] [PubMed] [Google Scholar]
- Duncan Greg J., and Brooks-Gunn Jeanne, eds. 1997. Consequences of Growing Up Poor. New York: Russell Sage Foundation. [Google Scholar]
- Duncan Greg J., Magnuson Katherine, and Votruba-Drzal Elizabeth. 2014. “Boosting Family Income to Promote Child Development.” Future of Children 24(1): 99–120. [DOI] [PubMed] [Google Scholar]
- Duncan Greg J., Morris Pamela A., and Rodrigues Chris. 2011. “Does Money Really Matter? Estimating Impacts of Family Income on Young Children’s Achievement with Data from Random-Assignment Experiments.” Developmental Psychology 47(5): 1263–79. [DOI] [PMC free article] [PubMed] [Google Scholar]
- Duncan Greg J. , and Murnane Richard J. , eds. 2011. Whither Opportunity?: Rising Inequality, Schools, and Children’s Life Chances: Rising Inequality, Schools, and Children’s Life Chances. New York: Russell Sage Foundation/Spencer Foundation. [Google Scholar]
- Edin Kathryn, and Lein Laura. 1997. “Work, Welfare, and Single Mothers’ Economic Survival Strategies.” American Sociological Review 62(2): 253–66. [Google Scholar]
- Edin Kathryn, and Shaefer H. Luke. 2015. $2.00 a Day: Living on Almost Nothing in America. Boston, Mass: Houghton Mifflin Harcourt. [Google Scholar]
- Edin Kathryn, and Shaefer H. Luke. 2016. “Q&A on $2.00 a Day.” $2 a Day Accessed September 22, 2017 http://www.twodollarsaday.com/resources/. [Google Scholar]
- Evans William N., and Garthwaite Craig L.. 2014. “Giving Mom a Break: The Impact of Higher EITC Payments on Maternal Health.” American Economic Journal: Economic Policy 6(2): 258–90. [Google Scholar]
- Evans William N., Sullivan James X., and Wallskog Melanie. 2016. “The Impact of Homelessness Prevention Programs on Homelessness.” Science 353(6300): 694–99. [DOI] [PubMed] [Google Scholar]
- Flood Sarah, King Miriam, Ruggles Steven, and Warren J. Robert. 2017. Integrated Public Use Microdata Series, Current Population Survey: Version 5.0. [dataset]. Minneapolis: University of Minnesota; DOI: 10.18128/D030.V5.0. [DOI] [Google Scholar]
- Floyd Ife, Pavetti LaDonna, and Schott Liz. 2017. “TANF Reaching Few Poor Families.” Washington, D.C.: Center on Budget and Policy Priorities; Accessed November 17, 2017 http://www.cbpp.org/sites/default/files/atoms/files/6-16-15tanf.pdf. [Google Scholar]
- Fox Liana, Wimer Christopher, Garfinkel Irwin, Kaushal Neeraj, and Waldfogel Jane. 2015. “Waging War on Poverty: Poverty Trends Using a Historical Supplemental Poverty Measure.” Journal of Policy Analysis and Management 34(3): 567–92. [DOI] [PMC free article] [PubMed] [Google Scholar]
- Garfinkel Irwin, Harris David, Waldfogel Jane, and Wimer Christopher. 2016. “Doing More for Our Children: Modeling a Universal Child Allowance or More Generous Child Tax Credit.” New York: The Century Foundation, Bernard L. Schwartz Rediscovering Government Initiative; Accessed September 22, 2017 https://s3-us-west-2.amazonaws.com/production.tcf.org/app/uploads/2016/03/16013632/DoingMoreForOurChildren_Final.pdf. [Google Scholar]
- Garfinkel Irwin, McLanahan Sara, and Wimer Christopher. 2016. Children of the Great Recession. New York: Russell Sage Foundation. [Google Scholar]
- Garfinkel Irwin, Rainwater Lee, and Smeeding Timothy M.. 2010. Wealth and Welfare States: Is America a Laggard or Leader? Oxford: Oxford University Press. [Google Scholar]
- Gennetian Lisa A., and Shafir Eldar. 2015. “The Persistence of Poverty in the Context of Financial Instability: A Behavioral Perspective.” Journal of Policy Analysis and Management 34(4): 904–36. [Google Scholar]
- Goldin Claudia D., and Katz Lawrence F.. 2009. The Race Between Education and Technology. Cambridge, Mass: Harvard University Press. [Google Scholar]
- Hair Nicole L., Hanson Jamie L., Wolfe Barbara L., and Pollak Seth D.. 2015. “Association of Child Poverty, Brain Development, and Academic Achievement.” JAMA Pediatrics 169(9): 822–29. [DOI] [PMC free article] [PubMed] [Google Scholar]
- Halpern-Meekin Sarah, Edin Kathryn, Tach Laura, and Sykes Jennifer. 2015. It’s Not Like I’m Poor: How Low Income Parents Make Ends Meet in a Post Welfare World. Berkeley: University of California Press. [Google Scholar]
- Hammond Samuel, and Orr Robert. 2016. “Toward a Universal Child Benefit.” Washington, D.C.: Niskanen Center; Accessed September 22, 2017 https://niskanencenter.org/wp-content/uploads/2016/10/UniversalChildBenefit_final.pdf. [Google Scholar]
- Harris David B. 2012. “The Child Tax Credit: How the United States Underinvests in Its Youngest Children in Cash Assistance and How Changes to the Child Tax Credit Could Help.” Ph.D. diss., Columbia University School of Social Work; Accessed November 17, 2017 http://academiccommons.columbia.edu/catalog/ac%3A175200. [Google Scholar]
- Haushofer Johannes, and Shapiro Jeremy 2016. “The Short-Term Impact of Unconditional Cash Transfers to the Poor: Experimental Evidence from Kenya.” Quarterly Journal of Economics 131(4): 1973–2042. [DOI] [PMC free article] [PubMed] [Google Scholar]
- Holzer Harry J., Schanzenbach Diane W., Duncan Greg J., and Ludwig Jens. 2008. “The Economic Costs of Childhood Poverty in the United States.” Journal of Children and Poverty 14(1): 41–61. [Google Scholar]
- Hoynes Hilary, and Patel Ankur J.. 2015. “Effective Policy for Reducing Inequality? The Earned Income Tax Credit and the Distribution of Income.” NBER working paper no. 21340. Cambridge, Mass: National Bureau of Economic Research. [Google Scholar]
- Hoynes Hilary, Schanzenbach Diane Whitmore, and Almond Douglas. 2016. “Long-Run Impacts of Childhood Access to the Safety Net.” American Economic Review 106(4): 903–34. [Google Scholar]
- Isaacs Julia, Edelstein Sara, Hahn Heather, Steele Ellen, and Steuerle C. Eugene. 2016. “Kids’ Share 2016: Report on Federal Expenditures on Children in 2015 and Future Projections.” Washington, D.C.: Urban Institute. [Google Scholar]
- Jacobs Elisabeth, and Hacker Jacob. 2008. “The Rising Instability of American Family Income, 1969–2004” EPI briefing paper no. 213. Washington, D.C. Economic Policy Institute; Accessed September 22, 2017 http://www.epi.org/publication/bp213/. [Google Scholar]
- Jencks Christopher. 2016. “Why Have the Very Poor Become Poorer?” New York Review of Books , June 9 Accessed September 22, 2017 http://www.nybooks.com/articles/2016/06/09/why-the-very-poor-have-become-poorer/. [Google Scholar]
- Kaushal Neeraj, Magnuson Katherine, and Waldfogel Jane. 2011. “How Is Family Income Related to Investments in Children’s Learning?” In Whither Opportunity , edited by Duncan Greg J. and Murnane Richard J.. New York: Russell Sage Foundation/Spencer Foundation. [Google Scholar]
- Kessler Ronald C., and Cleary Paul D.. 1980. “Social Class and Psychological Distress.” American Sociological Review 45(3): 463–78. [PubMed] [Google Scholar]
- Lugo-Gil Julieta, and Yoshikawa Hirokazu. 2006. “Assessing Expenditures on Children in Low-Income, Ethnically Diverse and Immigrant Families” National Poverty Center Working Paper Series no 06–36 Ann Arbor: University of Michigan. [Google Scholar]
- Mani Anandi, Mullainathan Sendhil, Shafir Eldar, and Zhao Jiaying. 2013. “Poverty Impedes Cognitive Function.” Science 341(6149): 976–80. [DOI] [PubMed] [Google Scholar]
- Marmot Michael Sharon Friel, Bell Ruth, Houweling Tanja A., and Taylor Sebastian. 2008. “Closing the Gap in a Generation: Health Equity Through Action on the Social Determinants of Health.” The Lancet 372(9650): 1661–69. [DOI] [PubMed] [Google Scholar]
- Marr Chuck, Huang Chye-Ching, Sherman Arloc, and Debot Brandon. 2015. “EITC and Child Tax Credit Promote Work, Reduce Poverty, Support Children’s Development, Research Finds.” Washington, D.C.: Center on Budget and Policy Priorities; Accessed September 22, 2017 https://www.cbpp.org/sites/default/files/atoms/files/6-26-12tax.pdf. [Google Scholar]
- Matthews Dylan 2016. “Sweden Pays Parents for Having Kids—And It Reaps Huge Benefits. Why Doesn’t the US?” Vox , May 23 Accessed September 22, 2017 https://www.vox.com/2016/5/23/11440638/child-benefit-child-allowance. [Google Scholar]
- Maynard Rebecca A. 1977. “The Effects of the Rural Income Maintenance Experiment on the School Performance of Children.” American Economic Review 67(1): 370–75. [Google Scholar]
- Maynard Rebecca A., and Murnane Richard J.. 1979. “The Effects of a Negative Income Tax on School Performance: Results of an Experiment.” Journal of Human Resources 14(4): 463–76. [Google Scholar]
- McLoyd Vonnie C. 1990. “The Impact of Economic Hardship on Black Families and Children: Psychological Distress, Parenting, and Socioemotional Development.” Child Development 61(2): 311–46. [DOI] [PubMed] [Google Scholar]
- Meadows Sarah O., McLanahan Sara S., and Brooks-Gunn Jeanne. 2008. “Stability and Change in Family Structure and Maternal Health Trajectories.” American Sociological Review 73(2): 314–34. [DOI] [PMC free article] [PubMed] [Google Scholar]
- Meyer Bruce D., and Sullivan James X.. 2012. “Identifying the Disadvantaged: Official Poverty, Consumption Poverty, and the New Supplemental Poverty Measure.” Journal of Economic Perspectives 26(3): 111–36. [Google Scholar]
- Miller Cynthia, Miller Rhiannon, Verma Nandita, Dechausay Nadine, Yang Edith, Rudd Timothy, Rodriguez Jonathan, and Honig Sylvie. 2016. Effects of a Modified Conditional Cash Transfer Program in Two American Cities: Findings from Family Rewards 2.0 New York: MDRC; Accessed September 22, 2017 http://www.mdrc.org/sites/default/files/CEOSIF_Family_Rewards%20Report-Web-Final_FR.pdf. [Google Scholar]
- Milligan Kevin, and Stabile Mark. 2011. “Do Child Tax Benefits Affect the Well-Being of Children? Evidence from Canadian Child Benefit Expansions.” American Economic Journal: Economic Policy 3(3): 175–205. [Google Scholar]
- Moffitt Robert A. 2015. “The Deserving Poor, the Family, and the U.S. Welfare System.” Demography 52(3): 729–49. [DOI] [PMC free article] [PubMed] [Google Scholar]
- Morduch Jonathan, and Schneider Rachel. 2017. How American Families Cope in a World of Uncertainty. Princeton, N.J.: Princeton University Press. [Google Scholar]
- Morris Pamela, Duncan Greg J., and Clark-Kauffman Elizabeth. 2005. “Child Well-Being in an Era of Welfare Reform: The Sensitivity of Transitions in Development to Policy Change.” Developmental Psychology 41(2005): 919–32. [DOI] [PubMed] [Google Scholar]
- Muennig Peter A., Mohit Babak, Wu Jinging, Jia Haomiao, and Rosen Zohn. 2016. “Cost Effectiveness of the Earned Income Tax Credit as a Health Policy Investment.” American Journal of Preventive Medicine 51(6): 874–81. [DOI] [PubMed] [Google Scholar]
- Mullainathan Sendhil, and Shafir Eldar. 2013. Scarcity: Why Having Too Little Means So Much. New York: Henry Holt and Company. [Google Scholar]
- Nelson Charles A., and Sheridan Margaret A.. 2011. “Lessons from Neuroscience Research for Understanding Causal Links Between Family and Neighborhood Characteristics and Educational Outcomes” In Whither Opportunity , edited by Duncan Greg J. and Murnane Richard J.. New York: Russell Sage Foundation/Spencer Foundation. [Google Scholar]
- Nichols Austin, and Rothstein Jesse. 2016. “The Earned Income Tax Credit” In Economics of Means-Tested Transfer Programs in the United States , vol. 1, edited by Moffitt Robert A.. Chicago: University of Chicago Press. [Google Scholar]
- Noble Kimberly G., Engelhardt Laura E., Brito Natalie H., Mack Luke J., Nail Elizabeth J., Angal Jyoti, Barr Rachel, Fifer William P., and Elliott Amy J.. 2015. “Socioeconomic Disparities in Neurocognitive Development in the First Two Years of Life.” Developmental Psychobiology 57(5): 535–51. [DOI] [PMC free article] [PubMed] [Google Scholar]
- Noble Kimberly G., Houston Suzanne M., Brito Natalie H., Bartsch Hauke, Kan Eric, Kuperman Joshua M., Akshoomoff Natacha, et al. 2015. “Family Income, Parental Education and Brain Structure in Children and Adolescents.” Nature Neuroscience 18(5): 773–78. [DOI] [PMC free article] [PubMed] [Google Scholar]
- Organization for Economic Co-operation and Development (OECD). 2016. “Income Distribution Database (IDD): Gini, Poverty, Income, Methods and Concepts.” Accessed September 22, 1017 http://www.oecd.org/social/income-distribution-database.htm.
- Osborne Cynthia, Berger Lawrence M., Magnuson Katherine. 2012. “Family Structure Transitions and Changes in Maternal Resources and Well Being.” Demography 49(1): 23–47. [DOI] [PMC free article] [PubMed] [Google Scholar]
- Rojas Neerja, Yoshikawa Hirokazu, Rangel Mayra L., Melvin S, Gennetian Lisa A., Noble Kimberly, Duncan Greg J., and Magnuson Katherine. forthcoming. “The Experiences of an Unconditional Cash Transfer Among Low-Income Mothers of Infants: An Experimental, Mixed-Methods Study.” Manuscript under review.
- Rosenblum Leonard A., and Andrews Michael W.. 1994. “Influences of Environmental Demand on Maternal Behavior and Infant Development.” Acta Paediatrica 83(s397): 57–63. [DOI] [PubMed] [Google Scholar]
- Rosenblum Leonard A., and Paully Gayle S.. 1984. “The Effects of Varying Environmental Demands on Maternal and Infant Behavior.” Child Development 55(1): 305–14. [PubMed] [Google Scholar]
- Sandstrom Heather, and Huerta Sandra. 2013. “The Negative Effects of Instability on Child Development: A Research Synthesis” Washington, D.C.: Urban Institute. [Google Scholar]
- Shaefer H. Luke, and Edin Kathryn. 2013. “Rising Extreme Poverty in the United States and the Response of Federal Means-Tested Transfers.” Social Service Review 87(2): 250–68. [Google Scholar]
- Shonkoff Jack P., Garner Andrew S., Siegel Benjamin S., Dobbins Mary I., et al. 2012. “The Lifelong Effects of Early Childhood Adversity and Toxic Stress.” Pediatrics 129(1): e232–46. [DOI] [PubMed] [Google Scholar]
- Short Kathleen. 2015. “The Supplemental Poverty Measure: 2014” Current Population Reports, series P60, no. 254 Washington: Government Printing Office for U.S. Census Bureau. [Google Scholar]
- Smeeding Timothy M., and Thevenot C. 2016. “Addressing Child Poverty: How Does the United States Compare with Other Nations?” Academic Pediatrics (3 Suppl): S67–75. [DOI] [PMC free article] [PubMed] [Google Scholar]
- Strully Kate W., Rehkopf David H., and Xuan Ziming. 2010. “Effects of Prenatal Poverty on Infant Health: State Earned Income Tax Credits and Birth Weight.” American Sociological Review 75(4): 534–62. [DOI] [PMC free article] [PubMed] [Google Scholar]
- Tax Policy Center. 2016. “Options to Repeal the Child Tax Credit and Exemption for Dependents (July 2016).” Washington, D.C.: Urban Institute and Brookings Institution; Accessed November 17, 2017 http://www.taxpolicycenter.org/simulations/options-repeal-child-tax-credit-and-exemption-dependents-july-2016. [Google Scholar]
- Votruba-Drzal Elizabeth. 2006. “Economic Disparities in Middle Childhood Development: Does Income Matter?” Developmental Psychology 42(6): 1154–67. [DOI] [PubMed] [Google Scholar]
- Wimer Christopher, Fox Liana, Garfinkel Irwin, Kaushal Neeraj, and Waldfogel Jane. 2016. “Progress on Poverty? New Estimates of Historical Trends Using an Anchored Supplemental Poverty Measure.” Demography 53(4): 1207–18. [DOI] [PMC free article] [PubMed] [Google Scholar]
- Wimer Christopher, and Smeeding Timothy M.. 2016. “U.S.A. Child Poverty: The Impact of the Great Recession” In Children of Austerity: Impact of the Great Recession on Child Poverty in Rich Countries , edited by Cantillon Bea, Chzhen Yekaterina, Handa Sudhanshu, and Nolan Brian. Oxford: Oxford University Press. [Google Scholar]
- Wolfe Barbara, Jakubowski Jessica, Haveman Robert, and Courey Marissa. 2012. “The Income and Health Effects of Tribal Casino Gaming on American Indians.” Demography 49(2): 499–524. [DOI] [PubMed] [Google Scholar]
- Yoshikawa Hirokazu, Aber J. Lawrence, and Beardslee William R.. 2012. “The Effects of Poverty on the Mental, Emotional, and Behavioral Health of Children and Youth: Implications for Prevention.” American Psychologist 67(4): 272–84. [DOI] [PubMed] [Google Scholar]
- Ziol-Guest Kathleen. M., Duncan Greg J., Kalil Ariel, and Boyce W. Thomas. 2012. “Early Childhood Poverty, Immune-Mediated Disease Processes, and Adult Productivity.” Proceedings of the National Academy of Sciences 109 Suppl: 17289–93. [DOI] [PMC free article] [PubMed] [Google Scholar]