Abstract
The MOLECUBES β-CUBE scanner is the newest amongst commercially available preclinical PET scanners for dedicated small animal imaging. The scanner is compact, lightweight and utilizes a small footprint to facilitate bench-top imaging. It can be used individually, or in combination with the X-CUBE CT scanner, which provides the ability to perform all necessary PET data corrections and provide fully quantitative PET images. The PET detector comprises of an 8 mm thick monolithic LYSO scintillator read-out by an array of 3 mm x 3 mm Hamamatsu silicon photomultipliers. The monolithic scintillator provides the ability to measure depth-of-interaction which aids in the development of such a compact scanner. With a scanner diameter of 7.6 cm and axial length of 13 cm it is suitable for imaging both whole-body mice and rats. This paper presents the design and imaging performance of the β-CUBE scanner. NEMA NU4–2008 characterization and a variety of phantom and animal imaging studies to demonstrate the quantitative imaging performance of the PET scanner are presented. Spatial resolution of 1 mm is measured with a filtered-back projection reconstruction algorithm at the center of the scanner and DOI measurement helps maintain the excellent spatial resolution over the entire imaging FOV. An absolute peak sensitivity of 12.4% is measured with a 255 – 765 keV energy window. Scanner demonstrates good count-rate performance, with a peak NEC of 300 kcps and 160 kcps measured with ~900 pCi in the NEMA mouse and rat phantoms respectively. Imaging data with the NEMA image quality phantom and Micro Derenzo phantoms demonstrate the ability to achieve good image quality and accurate quantitative data. Image uniformity of 7.4% and spill-over ratio of 8% were measured. The superior spatial resolution, excellent energy resolution and sensitivity also provide superior contrast recovery, with ~70% recovery for the 2 mm rods. While current commercial preclinical PET scanners have spatial resolution in the 1–2 mm range, the 1 mm3 volumetric resolution presents significant improvement over current commercially available preclinical PET scanners. In combination with the X-CUBE scanner it provides the ability to perform fully quantitative imaging with spatially co-registered high-resolution 3D PET-CT images.
1. Introduction
Positron Emission Tomography (PET) is widely used as a research tool for studying small animal models of disease. The superior sensitivity and wide availability of novel radiotracers makes preclinical PET an excellent and well-accepted choice. PET scanners were initially developed solely for clinical imaging and lacked the spatial resolution and sensitivity necessary for imaging small animals. Since the introduction of the first commercial preclinical PET scanner by CTI PET Systems in the early 2000’s (Knoess et al., 2003) there have been numerous efforts to improve preclinical PET scanner design and performance. In many cases the instrumentation technology and system designs used in pre-clinical PET scanners, including the use of LSO/LYSO and semiconductor photosensors, have been greatly influenced by development of small animal PET scanners at academic institutions, and some have directly evolved into commercial preclinical PET systems; e.g. (Cherry et al., 1997) led to the development of the Concorde micoPET scanner, (Lecomte et al., 1994) first utilized semiconductor photosensors to design PET scanners and led to the development of the LabPET scanner, (Surti et al., 2005) led to the Philips Mosaic HP PET scanner. A few research scanners have utilized non-scintillator based designs (Jeavons et al., 1999, Ishii et al., 2007, Park et al., 2007, Ueno et al., 2009, Vaska et al., 2009), but commercial small-animal PET vendors have solely relied on scintillator-based detector designs (Chatziioannou et al., 1999, Wang et al., 2006, Huisman et al., 2007, Bergeron et al., 2009, Bao et al., 2009, Goertzen et al., 2012, Sato et al., 2016) since they offer a more practical solution to develop scanners with good spatial resolution and sensitivity. Spatial resolution in preclinical PET has continued to improve, and today is in the 1–2 mm range for most commercial small animal PET scanners. While sufficient for rat imaging, it is non-ideal for imaging mice. The higher spatial resolution is necessary to resolve smaller features and also improve quantitation by reducing partial volume effects. Hence developing small animal PET scanners with <1mm spatial resolution and good sensitivity has been a longstanding goal.
Among the more recent commercial scanners, the nanoScan (Szanda et al., 2011, Nagy et al., 2013), PETbox (Zhang et al., 2011) and Clairvivo (Sato et al., 2016) PET scanners use pixelated crystals with cross-sections ranging from 1.1 × 1.1 mm2 to 1.5 × 1.5 mm2. While pixelated light-sharing PET detectors offer very good performance (Surti et al., 2003), increasing spatial resolution, especially below 1 mm significantly increases design complexity and costs, as well as performance sacrifices (Tai et al., 2003). Hence, pre-clinical PET scanners with sub-mm spatial resolution have not been commercially available until recently. The MILabs VECTor scanner (Walker et al., 2014) takes a different approach by using clustered-pinhole collimators instead of very finely pixelated scintillation detectors to achieve sub-mm spatial resolution for 511 keV single photon imaging of PET tracers. While this opens up the possibility to simultaneously image both SPECT and PET tracers at very high spatial resolution, the use of pinhole collimators to acquire PET data results in a substantial decrease in sensitivity that limits use of the scanner for certain imaging applications e.g. dynamic imaging where sensitivity is of great importance.
While discrete scintillator PET detectors are still the most common configuration for both clinical and pre-clinical systems, the advent of solid state photosensors and maturation of bright and fast scintillator like LSO/LYSO have led to a number of efforts that have revisited monolithic scintillator based PET detector designs in recent years (Joung et al., 2002, Bruyndonckx et al., 2003, Vaska et al., 2004, Maas et al., 2006, Ling et al., 2007, Schaart et al., 2009, Kaul et al., 2013). Monolithic scintillator PET detector designs offer numerous advantages, the most important being - provide higher intrinsic spatial resolution, especially with thinner crystals; ability to measure depth-of-interaction in the detector; and improving the overall scanner spatial sampling. Silicon photomultiplier (SiPM) technology has now matured, is commercially available from a number of vendors, and is used in a number of imaging applications, including pre-clinical systems for PET (Kwon et al., 2011, Degenhardt et al., 2012) and PET-MR (Wehner et al., 2015), as well as commercial whole-body PET scanners (Kwon et al., 2011, Miller et al., 2015, Hsu et al., 2017, Casey et al., 2017). SiPMs provide excellent signal-to-noise and have resulted in the development of novel PET detector designs. In fact they have been key to the development of current monolithic-scintillator based PET detectors that are compact and provide high spatial resolution as well as depth-of-interaction (DOI) (Seifert et al., 2013, Espana et al., 2014, Borghi et al., 2016). Monolithic-scintillator based designs can thus be looked upon as a practical alternative to achieve <1 mm spatial resolution while also maintaining the scanner sensitivity necessary for preclinical PET.
Recently, MOLECUBES (http://www.molecubes.com) launched their commercial line-up of dedicated small animal scanners, viz. β-CUBE (PET), X-CUBE (CT), and γ-CUBE (SPECT). The MOLECUBES family of small-animal scanners is unique in being lightweight, compact and having a small footprint. The β-CUBE is a dedicated preclinical PET scanner that utilizes monolithic scintillator-based PET detectors to achieve high performance and to deliver a compact scanner with an axial FOV sufficient to scan whole-body mice and rats. With a footprint of 54 × 54 × 54 cm3 and weighing less than 200 lbs., the scanner enables bench-top imaging. Like the PETbox scanner (Zhang et al., 2011), this results in significant space savings.
The first MOLECUBES PET and CT scanners were recently installed in the Small Animal Imaging Facility within the School of Medicine at the University of Pennsylvania. This paper presents the design and imaging performance of the β-CUBE PET scanner. NEMA NU 4–2008 (NEMA, 2008) characterization of the scanner and a variety of phantom and animal imaging studies to demonstrate the quantitative imaging performance of the scanner are presented.
2. Materials and Methods
2.1. Scanner Design
The β-CUBE PET scanner incorporates a detector design that comprises of a 25.4 mm x 25.4 mm x 8 mm thick monolithic LYSO scintillator block coupled to an array of 3.2 mm x 3.2 mm Hamamatsu silicon photomultipliers (MPPC). Besides making the detector design compact, the small SiPMs provide an accurate measurement of the light response function. As the light-response function is known to vary with the depth of interaction, the measurement also permits depth-of-interaction (DOI) measurement. To optimize spatial resolution performance, the MOLECUBES β-CUBE scanner utilizes a maximum likelihood (ML) clustering algorithm to estimate the 3D location of each interaction within the PET detectors. The algorithm requires a training dataset to determine the light-spread model for each DOI layer and 2D location on the detector surface. This calibration is performed with a 511 keV source that is collimated to 400 pm and placed onto a high precision 3D robot-stage. The β-CUBE detector design facilitates a 5-layer DOI measurement (Mollet et al., 2017). A DOI resolution of 1.6 mm is sufficient to mitigate parallax related broadening affecting the overall scanner spatial resolution. The compact detector design along with the ability to measure DOI enables the design of a compact, small bore diameter scanner that can increase scanner sensitivity. Since silicon photomultipliers are known to be temperature sensitive, any changes in ambient temperature, or, from heat generated from electronics placed within such a compact geometry scanner can affect scanner performance. To alleviate the temperature dependence, active temperature control is achieved by using a Peltier cooling element at each detector. The Peltier element regulates the temperature of each detector to within +/− 0.5 °C. This is crucial to minimize temperature related SiPM gain drifts and allow room-temperature operation of the PET scanner. A total of 45 PET detectors are arranged in five PET rings to provide a scanner diameter of 7.6 cm and an axial length of 13 cm. The bore size and axial length are suitable for imaging both whole-body rats and mice. Custom front-end electronics shape and sample the signals from each detector. The front-end electronics boards from all detectors in a single ring transmit their signals to a single coincidence board that controls and transmits data using a custom data link. A single master acquisition control board funnels and manages the five coincidence data acquisition boards. The board also houses a dedicated FPGA to process in real-time detector information from all 45 detectors in the scanner. While the signal integration time for scintillator pulse processing can be customized, an integration time of 300 ns was used for measurements in this paper. Separate GPU-based servers housed within the scanner gantry perform PET acquisition and reconstruction. The acquisition server performs PET data acquisition, scanner control, physiological monitoring, bed motion, and list-mode data generation.
The X-CUBE is a dedicated micro-CT scanner that performs helical whole-body rat scanning at ~80 μm. It has a 6.5 cm transverse and 3.5 cm axial FOV. The CT also includes GPU-based iterative reconstruction that permits fast reconstructions and low-dose at voxel resolution of up to 50 μm. The animal bed on the MOLECUBES scanners is designed for being easily transported between the different scanners, and automatically produces fully co-registered 3D PET & CT DICOM images. The CT acquisitions can thus not only be used for anatomical localization, but also for accurate PET attenuation and scatter corrections necessary to obtain fully corrected quantitative images. A bi-linear scaling (Burger et al., 2002) is used to convert the CT image into attenuation coefficients at 511 keV for soft-tissue and bone materials respectively. Single scatter simulation (SSS) (Watson et al., 1996) is used to estimate scatter. By default, three iterations of SSS are performed after the 10th iteration of OSEM reconstruction. At the start of each subsequent iteration, an energy-based approach is used to estimate the scatter fraction. The scatter sinogram is subtracted from the prompt sinogram to generate a scatter fraction for each line-of-response within the listmode data. While the PET scanner collects data with an energy threshold of 255 keV, an energy window centered at 511 keV is chosen prior to data acquisition; a 15% window, or 435 – 588 keV, is used by default for PET data processing and image reconstruction. The PET reconstruction server runs a GPU-based iterative OSEM reconstruction and also converts the reconstructed images to DICOM format. The animal bed also includes the hardware for animal temperature control and physiological monitoring. Fig. 1 includes a rendering of the PET scanner design (left), as well as a photo of the PET and CT scanners placed adjacent to each other on a single lab bench in our facility (right). The PET and CT scanners can be controlled wirelessly using either a tablet or computer. Both the acquisition devices are synced using a custom graphical user interface that runs and seamlessly updates concurrently on both devices. Table. 1 summarizes the specifications of the β-CUBE PET scanner.
Fig. 1.
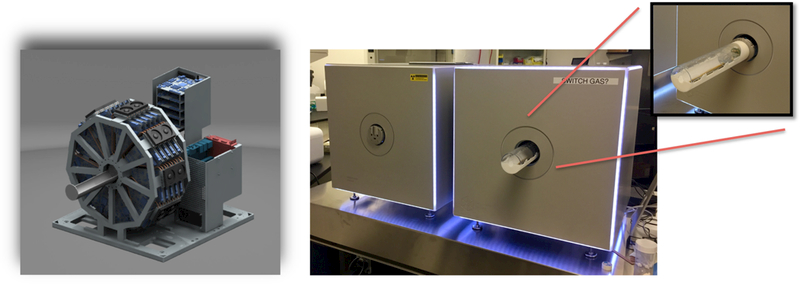
Left: A rendering of the PET scanner design. 45 PET detectors are arranged in 5 rings to provide a scanner diameter of 7.6 cm & axial length of 13 cm, making it suitable to image both whole-body rat & mice. Right: The MOLECUBES β-CUBE PET (right) and X-CUBE CT (left) scanners installed in the Small Animal Imaging Facility at the University of Pennsylvania. Both PET and CT scanners are compact and have a very small footprint to enable bench-top imaging. Inset on the right shows the animal bed retracted from the PET scanner. It can be easily detached and translated between the PET & CT scanners, obtaining automatically co-registered 3D PET & CT images.
Table. 1.
Summary of the β-CUBE PET scanner design specifications.
| Detector design | Light-sharing |
| Crystal | 25 mm × 25 mm × 8 mm monolithic LYSO |
| Photosensor | Array of 3.2 mm × 3.2 mm Hamamatsu MPPC |
| Number of rings | 5 |
| Number of detectors per ring | 9 |
| Ring diameter | 7.6 cm |
| Transaxial FOV | 7.2 cm |
| Axial FOV | 13 cm |
| Energy resolution | 12 % |
| Coincidence window | 5 ns |
| DOI layers | 5 |
| Data corrections | Yes, CT-based attenuation & scatter correction |
| Data format | List-mode |
| Reconstruction | Fully 3D GPU-based iterative OSEM |
2.2. Scanner Calibrations
Scanner normalization, a 3D-position based energy calibration, dead-time correction, and timing calibrations are performed with a 5 cm diameter uniform cylinder that extends the entire axial length of the scanner. The spatial transformation matrix necessary for automatic co-registration of the PET and CT images is based on measurements using activity filled capillary tubes placed sequentially in both the PET and CT scanners.
2.3. NEMA NU-4 evaluation
2.3.1. Spatial resolution
Spatial resolution was measured with the NEMA recommended 0.25 mm diameter 22Na point source (20 μCi Oct 2004) embedded in a 10 mm acrylic cube. The source was centered placed at the center of the scanner and stepped radially across the scanner FOV in 5 mm steps. The measurements were repeated at one-fourth the axial distance from the center of the scanner. PET data was reconstructed with a 3-D filtered back projection (FBP) algorithm that used a Hamming ramp filter. To utilize the DOI measurement capability of the scanner, the 3D interaction locations for each coincidence pair were remapped to a 2D crystal location before reconstructing with the 3-D FBP algorithm. In addition to the 3D FBP analytic measurement we also evaluated the spatial resolution with 30 iterations of OSEM reconstruction software that is routinely used for animal studies. The OSEM reconstruction software used its default settings of 10 subsets with 20 million events per subset. Images were reconstructed into a 192 × 192 transverse matrix with cubic image voxels measuring 0.4 mm. At each source position, spatial resolution (FWHM and FWTM) along the radial, tangential and axial directions was determined by fitting one-dimensional Gaussian profiles through the respective reconstructed image volume.
2.3.2. Sensitivity
Scanner sensitivity was measured with the same point source used for spatial resolution measurement. The 22Na source was placed at the transverse center of the FOV and stepped axially. While the NEMA measurement prescribes a step-size equal to the slice thickness (0.4 mm), 1 mm step-size was chosen to minimize the overall data collection time. For each source position, scanner data was collected for a fixed amount of time and the total number of prompt coincidences was recorded. A blank measurement (i.e. without the 22Na source) was also collected to account for contributions from the 176Lu background. Accounting for the branching factor of 22Na (0.906), the absolute scanner sensitivity was calculated as
Besides calculating sensitivity with the default scanner energy window, sensitivity was also calculated with an energy window of +/− 25% (355 – 665 keV) and +/−50% (255 – 765 keV) respectively.
2.3.3. Scatter fraction and count-rate measurement
Scatter fraction and count-rate measurements were performed with the line-source phantoms prescribed by the NU-4 standard. The mouse phantom is 25 mm in diameter and 70 mm long, while the rat phantom is 50 mm in diameter and 150 mm long. The line source was filled with 1 mCi 18FDG, and a 2-minute long PET scan was periodically acquired every 20 min over a number of half-lives. While all of the data was used to characterize the count-rate capability of the scanner, the data collected at the later time-point (Randoms fraction <1% of true event rate) was used to measure the scanner scatter fraction. Data processing did not include any of the data corrections that are used during image reconstruction. For each measurement, a single sinogram was generated using the single-slice rebinning (SSRB) technique (Daube-Witherspoon and Muehllehner, 1987). All pixels in the sinogram further than 8 mm from the edge of the phantom were set to zero. The pixel values along each radial bin of the sinogram were shifted to position the maximum pixel at the center of the sinogram. A single 1-D profile was obtained by summing all the angular profiles after alignment. All events falling outside the central 14 mm of the 1-D profile as assumed to be scattered events. Scatter fraction was calculated as
For characterizing the count-rate measurements, Randoms was estimated using the delayed window technique and a 5 ns coincidence timing window. Scatter was estimated using the Single Scatter Simulation technique (Watson et al., 1996). To account for contributions from intrinsic 176Lu activity, measurement of background counts was also performed with the phantom in place. The total PET signal (prompts) was defined as
PET Noise equivalent count (NEC) is a measure of the “trues” only contribution to the total counts that are collected, and is an indicator of PET signal-to-noise. NEC was calculated as defined by (Strother et al., 1990)
While the default (i.e., 15%) energy window was used to energy qualify the events, the effect of using different energy window settings on the count-rate performance was also evaluated.
2.3.4. Image Quality
PET image quality and accuracy of PET data corrections was assessed by imaging the NU-4 Image Quality phantom. The phantom was designed to mimic imaging a typical whole-body rodent, and is thus 30 mm in diameter, 50 mm tall and made up of polymethylmethacrylate (PMMA). The phantom was filled with 100 μCi of 18FDG and a 20-min PET scan was acquired with the phantom placed at the center of the scanner. At the end of the PET scan, the imaging bed was transferred to the X-CUBE scanner and a CT scan using the general-purpose acquisition protocol was acquired. The CT image was used for performing PET attenuation and scatter corrections. While the standard CT reconstruction is performed at 100 μm image voxels, the CT image used for PET data correction is reconstructed at 1 mm image resolution. PET image reconstruction was accomplished with all available PET data corrections. Images were reconstructed using 30 iterations of iterative OSEM (20 million events per subset). The choice of 30 iterations was based on separate measurements with a uniform cylindrical phantom that displayed image convergence at about 30 iterations. Images were reconstructed into a 192 × 192 transverse matrix with cubic image voxels measuring 0.4 mm. As prescribed by the NU-4 standard, image uniformity, contrast recovery, and accuracy of data corrections were calculated over the different sections of the reconstructed images of the NU-4 image quality phantom. Image uniformity was measured with a 10 mm long volume of interest (VOI) covering the central 75% of the uniform section. Accuracy of PET data corrections was measured over a central 7.5 mm VOI that was half the diameter of the air and water filled compartments. Contrast recovery (CRC) was measured over a region of interest (ROI) that is twice the physical diameter of each of the five rods.
2.4. Phantom Imaging study
The Data Spectrum Micro Deluxe hot rod Derenzo phantom was imaged. The phantom is 4.5 cm in diameter, 3.7 cm tall and has rods with diameters of 1.2 mm, 1.6 mm, 2.4 mm, 3.2 mm, 4.0 mm and 4.8 mm grouped into sectors. The center-to-center spacing for each rod is twice its diameter. The phantom was filled with 175 μCi of 18FDG and imaged with a single bed position for 60 min. A CT scan immediately followed PET imaging. PET images were reconstructed into a 192 × 192 image matrix with 0.4 mm slices using 60 iterations of the native OSEM reconstruction (20 million events per subset) with all data corrections.
3. Results
3.1. Spatial resolution
With the FBP reconstruction, radial spatial resolution of 1.06 mm (1.74 mm FWTM) and 0.83 mm (1.57 mm FWTM) is measured at the center and at one-fourth axial center of the scanner, respectively. Overall, an average spatial resolution of 1.1 mm (1.97 mm FWTM) and 0.97 mm (1.87 mm FWTM) is measured at the two axial locations in the scanner. The spatial resolution measurements are summarized in Fig. 2, which illustrates the uniformity of resolution - and, specifically the radial resolution - as a function of radial position. Measurements demonstrate the MOLECUBES β-CUBE PET scanner to have excellent spatial resolution with minimal degradation across the imaging FOV due to the DOI correction incorporated into image reconstruction.
Fig. 2.
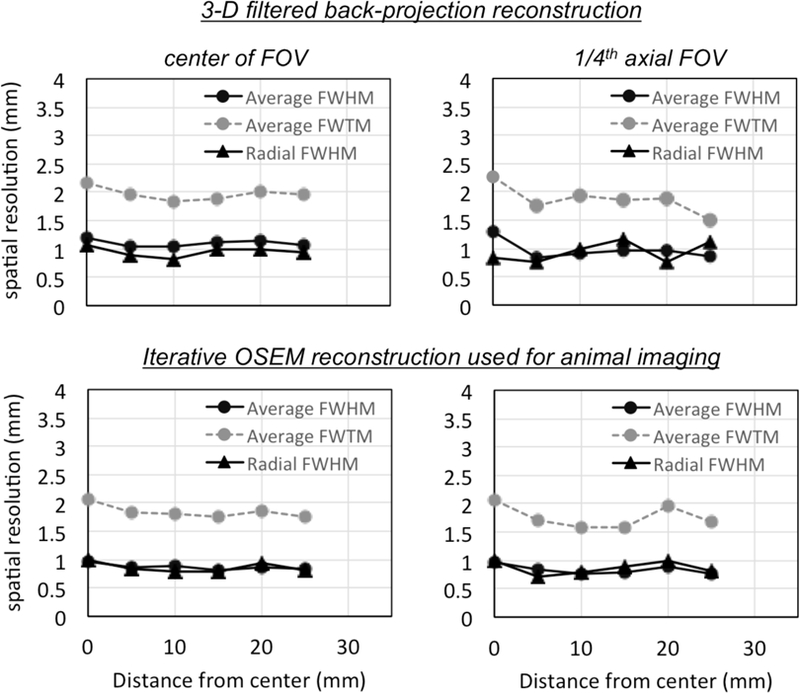
Spatial resolution measurements: For each position the average spatial resolution was calculated as the average of the radial, tangential and axial spatial resolution. Shown are the results with the NEMA prescribed measurement and a 3-D filtered back-projection reconstruction algorithm (top row). Measurements on the left were performed at the center of the FOV while those on the right were performed at one-fourth the axial distance from the center of the scanner. Also included for comparison are measurements with an iterative OSEM algorithm and reconstruction parameters that are routinely used for animal imaging (bottom row).
3.2. Sensitivity
The sensitivity measurements are summarized in Fig. 3. After correcting for any residual counts from intrinsic 176Lu activity, a maximum absolute sensitivity of 12.4% is measured at the center of the scanner with a 50% energy window (255 – 765 keV). Even with the default energy window of 15% that is routinely used for animal imaging, an absolute peak sensitivity of 5.7% was measured. Also shown are results for a 25% window (385 – 640 keV).
Fig. 3.
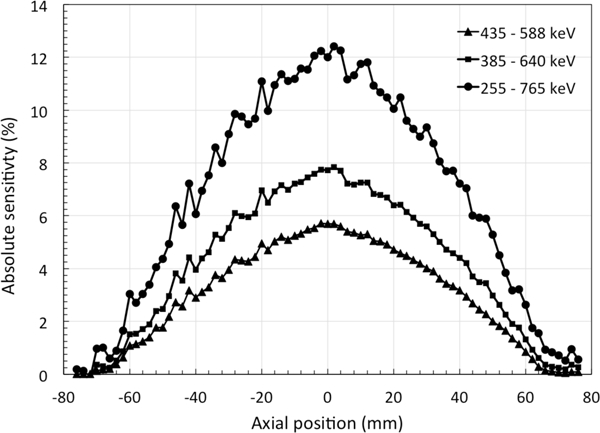
NEMA NU-4 sensitivity measurements: The NEMA recommended point source was centered within the transverse FOV and stepped axially in 1 mm step. A peak absolute sensitivity of 12.4% is measured when using a 255 – 765 keV energy window.
3.3. Count-rate measurements and scatter fraction
A scatter fraction of 11.3% and 15.7% was measured with the mouse and rat phantoms respectively. Peak NEC of 300 kcps and 160 kcps was measured at 900 μCi and with the default scanner energy window of +/− 15%. The total count-rate for the scanner peaks at an activity just above 1 mCi due to the limited data bandwidth available at the coincidence board, although this has little impact on the majority of imaging protocols designed for mice and rats, which are generally limited by the specific activity of the radio-tracer injected into the animal. The measurements are summarized in Fig. 4. We also studied the effect of varying the energy-window settings on NEC and observed that using a 25% window results in slightly higher NEC value. The increase in sensitivity at 385 keV (Fig. 3) outweighs corresponding increase in scattered events and provides a 4–10% increase in NEC.
Fig. 4.
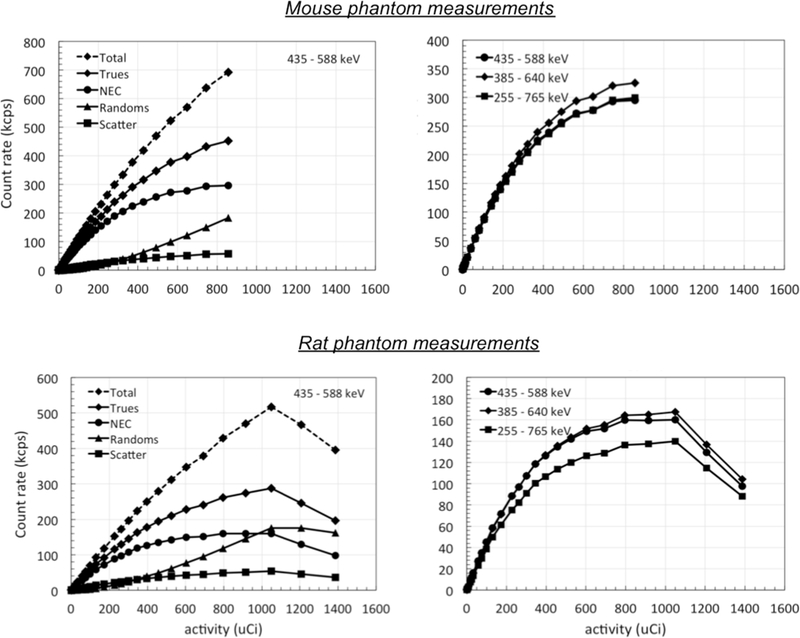
Count-rate measurements: Shown are the count-rate measurements with the NEMA mouselike phantom (top left) and rat-like phantoms (bottom left) respectively. Peak NEC of 300 kcps and 160 kcps are seen at ~900 μCi in the mouse and rat phantoms respectively. Also shown is the effect of using different energy window on the mouse (top right) and rat (bottom right) phantoms. Note that the limited bandwidth of the coincidence electronics leads to a loss of count-rate capability above an activity of 1 mCi.
3.4. NEMA Image Quality Phantom
A single sagittal slice of the reconstructed image highlighting the different regions of the NU-4 image quality phantom is shown in Fig. 5. The images show the scanner to have good uniformity and uniform recovery for both the air and non-radioactive water filled cylindrical compartments. Image uniformity of 7.4% and spill-over-ratio of approximately 8% were measured. The uniformity results are summarized in Table. 2. ~70% CRC is measured for rods with 2 mm diameter, and full recovery is observed for rods with diameter 3 mm or larger. A summary of the contrast recovery measurements is presented in Fig. 6.
Fig. 5.

Reconstructed images from the NEMA NU-4 image quality phantom -PET data was reconstructed with all available PET data corrections. A single sagittal slice is shown highlighting the different sections in the phantom (left). Also shown is a single transverse slice through the uniform section of the phantom (middle), and a slice through the section of the phantom containing the air and non-radioactive water compartments (right).
Table. 2.
Summary of uniformity measurement from the NU-4 image quality phantom.
| Mean | Maximum | Minimum | %STD | Max/Mean ratio |
Min/Mean ratio |
|
|---|---|---|---|---|---|---|
| Uniformity | 2.97 | 3.98 | 2.26 | 7.43 | 1.34 | 0.76 |
Fig. 6.
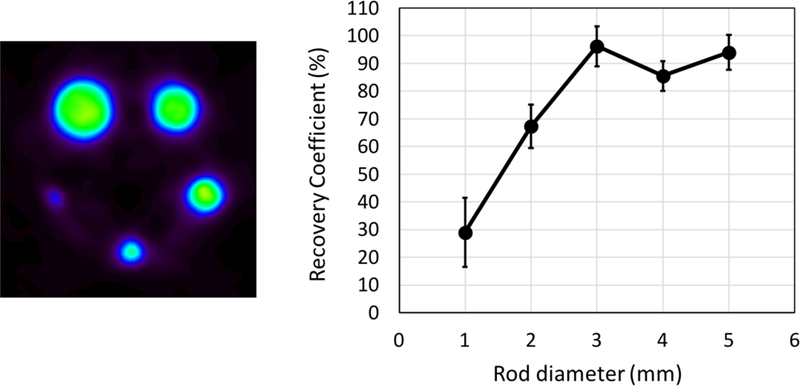
Summary of contrast recovery measurements with the NU-4 image quality phantom.
3.5. Micro Derenzo Hot Rod Phantom
Fig. 7. shows a single transverse slice through the Micro Deluxe hot rod Derenzo phantom and a profile through the section of the portion containing the 1.2 mm rods. As shown, all rods down to the smallest rods can be clearly visualized and well separated.
Fig. 7.
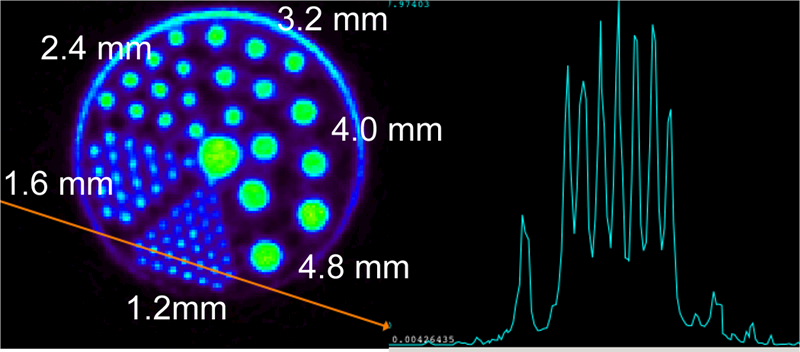
A single transverse slice from imaging the Micro Deluxe hot rod Derenzo phantom (left) and a profile through section containing the 1.2 mm rods highlighted in red (right).
4. Animal Imaging Studies
Since installation and upon completion of all scanner calibrations, the β-CUBE PET and X-CUBE CT scanners have been used for an increasing number of animal imaging studies with a variety of radiotracers that are available in our facility (e.g. 18FDG, 18F-NaF, 18F-FACBC). Included below are example studies that broadly represent the ability of the scanner to perform imaging with both mouse and rat.
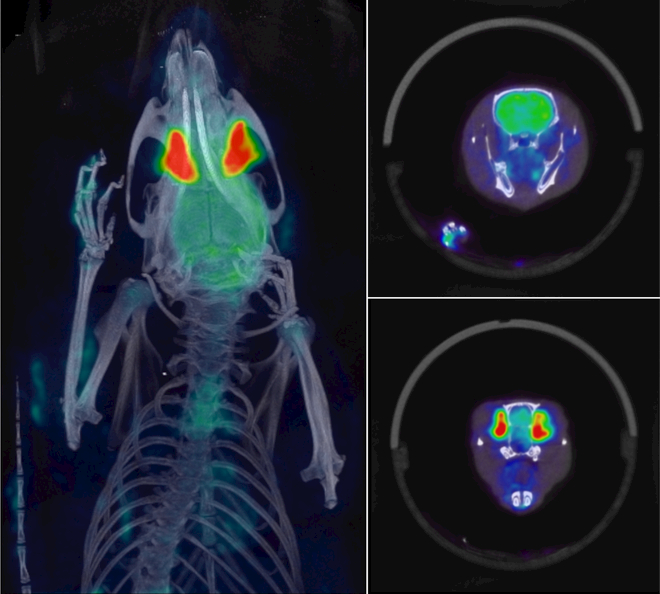
18FDG has been previously shown to be helpful in studying inflammation, with inflamed regions showing increased 18FDG uptake. Fig. 8 shows a baseline 18FDG rat scan from a study to investigate inflammation in osteoarthritis of the Temporomandibular joint (TMJ). A 15-min static PET scan was performed 1-hour post-injection of 600 μCi of 18FDG. The rat was anesthetized using isoflurane, and the PET scan was immediately followed with a CT scan. The CT data was iteratively reconstructed at 100 μm resolution, and the PET data was reconstructed with 400 μm voxels using all data corrections. The co-registered images aid in delineating the small structure of the TMJ from the surrounding jaw leading to a more accurate measurement of the FDG signal. This allows for better tracking of the progression of the disease in the jaw. Fig. 8 shows fully co-registered maximum intensity projection (MIP) and sample transverse slices from the study.
Fig. 8.
PET-CT imaging of a rat from baseline scans investigating inflammation in osteoarthritis of the jaw: A single bed-position 15 min PET scan was acquired 1-hour post injection of 600 μCi of 18FDG. PET imaging was followed by a general-purpose CT acquisition. Shown above is a fused PET-CT maximum intensity projection (left), and sample co-registered PET-CT transverse slices (right). Images courtesy of Drs. Granquist and Winkelstein at U. Penn.
Fig. 9 shows a single transverse slice and its corresponding coronal slice from a lung tumor imaging study performed in mice. A 15-min single-bed position static PET scan was performed 1-hour post-injection of 175 μCi of 18FDG. Also included are the co-registered PET and CT images. The superior spatial resolution and contrast recovery allow for smaller structures to be visualized as compared to our older Philips Mosaic HP system (Surti et al., 2005) which has 2-mm spatial resolution. Earlier detection of tumors as well as improved tracking of tumor size for these studies is also possible with the improved performance of the MOLECUBES scanner. These examples shown in Figures 8 and 9 also demonstrate the ability to provide excellent anatomical and functional correlation between the PET and CT scanners.
Fig. 9.
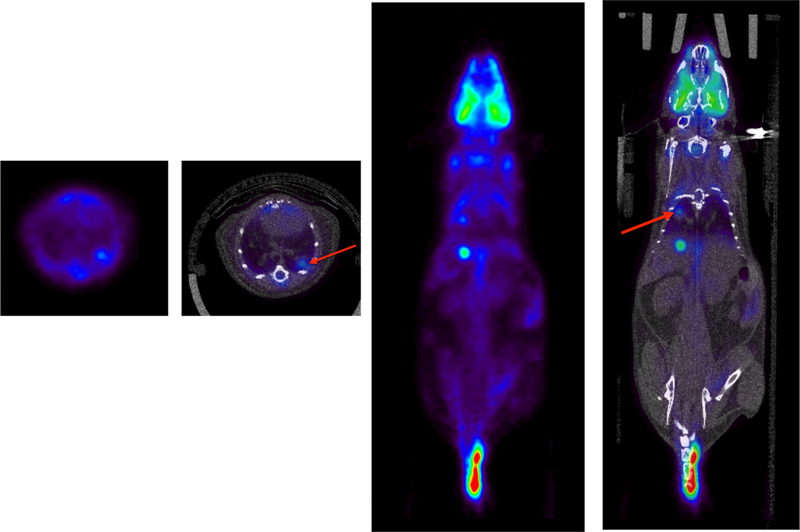
Whole-body PET-CT imaging of a mouse from a lung tumor model study. A single bed-position 15 min PET scan was acquired 1-hour post injection of 175 μCi of 18FDG. PET imaging was followed by a general-purpose CT acquisition. Shown above is a single transverse PET, and co-registered PET-CT slices (left), and corresponding coronal slice (right). The FDG avid areas are highlighted (red arrows) in the fused PET-CT images. Images courtesy of David Walter and Dr. David Feldser at U. Penn.
5. Discussion
The Small Animal Imaging Facility at the University of Pennsylvania is the first installation site for the MOLECUBES family of scanners. The MOLECUBES β-CUBE scanner is a small-footprint and compact PET scanner suitable for imaging both whole-body mice and rat. The β-CUBE PET scanner can be used individually, or in combination with the X-CUBE CT scanner, which provides the ability to perform all necessary PET data corrections and provides fully quantitative and co-registered 3D PET-CT images. The scanner utilizes monolithic scintillator-based PET detectors to permit DOI measurement and achieve excellent spatial resolution. The resolution is uniform throughout the entire FOV and has minimal degradation from DOI. The compact detector design, along with the ability to measure DOI also permits building a small bore, long axial FOV scanner. This combination results in excellent sensitivity - amongst the highest from commercial manufacturers of small animal PET (Goertzen et al., 2012, Sato et al., 2016). This provides a unique combination of 1-mm3 volumetric spatial resolution and high sensitivity. While there are a few scanners with comparable, or, longer axial FOV, the scanner sensitivity is only surpassed by the PETbox scanner (Zhang et al., 2011) that additionally benefits from the superior stopping power of BGO scintillator. In fact, the Albira small animal scanner from Bruker (Spinks et al., 2014) also utilizes monolithic scintillator based PET detectors arranged in a different scanner geometry. The scanner has ~1.5 mm spatial resolution, and also demonstrates the commercial viability of utilizing monolithic scintillator PET technology to improve small animal PET imaging.
With active temperature compensation we have also observed the scanner to have excellent short-term and long-term stability. The scanner exhibits good count-rate capability with a peak NEC of 300 kcps measured at ~900 μCi (33.3 MBq) with the mouse-like phantom. Current animal 18FDG scans are limited by the specific activity of the tracer, which limits the volume of activity that is used for animal imaging studies. Thus, the count-rate capability of the β-CUBE, while lower than some other scanners, is sufficient for routine 18FDG imaging studies.
In conjunction with the X-CUBE CT scanner, it provides the ability to perform accurate data corrections. Data from the NU-4 image quality and Micro Derenzo phantoms demonstrates the ability to achieve very good image quality and produce accurate quantitative data. The superior spatial resolution, excellent energy resolution (12%) and sensitivity of the scanner results in superior contrast recovery, with ~70% contrast recovery for the 2 mm rods and full recovery for rods with 3 mm diameter. The image uniformity (7.4%) while comparable with most scanners is somewhat limited by the non-uniform spatial resolution at the edges of the PET detectors. The average detector spatial resolution ranges from an average of 0.78 mm over the central 80% of the detector to 0.9 mm over the entire detector. Maximizing scanner sensitivity, albeit at slightly lowering overall spatial resolution requires using the full-area of the detector. The current image reconstruction uses a uniform spatial resolution model and incorporating a spatially-variant model should further improve the uniformity and spatial resolution.
6. Conclusion
MOLECUBES has recently launched its commercial line of dedicated small-animal scanners. This includes the β-CUBE PET scanner and the X-CUBE CT scanners. Both scanners are compact, have a small-footprint and enable benchtop imaging for both mice and rats. The scanner has shown to be stable and has a very simple and intuitive acquisition and reconstruction interface. The PET scanner utilizes monolithic scintillator-based detectors to permit DOI measurement and achieves excellent and uniform spatial resolution over the imaging FOV. The very high volumetric spatial resolution of 1 mm3 for all locations within the imaging FOV presents significant improvement over current commercially available scanners. The PET and CT scanners can be used individually, or in combination with the X-CUBE CT scanner, which provides the ability to perform all necessary PET data corrections and provides fully quantitative and co-registered 3D PET-CT images. The excellent spatial resolution along with the excellent sensitivity permit provide excellent contrast recovery for lesions as small as 2 mm. This is particularly advantageous for imaging mice where the superior spatial resolution should alleviate partial volume effects. We have performed a number of imaging studies and have obtained good quantitative correlation with our existing MOSAIC HP small animal scanner (Surti et al., 2005). We are currently working on modifying and optimizing our existing imaging protocols to fully utilize the superior volumetric spatial resolution and ability to obtain excellent anatomic correlation which is critical for a number of non-standard 18FDG radiotracers (e.g. 18FACBC, 18FLT) that are available at our institute.
Acknowledgements
The authors would like to thank the Small Animal Imaging Facility, Perelman School of Medicine at the University of Pennsylvania for support, as well as the Cyclotron facility in the PET Center of the Department of Radiology. We would also like to acknowledge Megan Sperry, Dr. E. Granquist, Director of the Center for Temporomandibular Joint Disorder in the Perelman School of Medicine, Dr. B. Winkelstein of the Spine Research Lab in the Departments of Bioengineering & Neurosurgery, and David Walter, Dr. D. Feldser in the Department of Cancer Biology, Perelman School of Medicine for use of their animal studies we report in this paper. The work was also supported in part by the National Institutes of Health Grants No. R01-CA113941 and R01-CA196528.
References
- Bao Q, Newport D, Chen M, Stout DB & Chatziioannou AF 2009. Performance evaluation of the inveon dedicated PET preclinical tomograph based on the NEMA NU-4 standards. J Nucl Med, 50, 401–408. [DOI] [PMC free article] [PubMed] [Google Scholar]
- Bergeron M, Cadorette J, Beaudoin J-F, Lepage MD, Ghislain R, Selivanov V, Tetrault M, Viscogliosi N, Mnorenberg J, Fontaine R & Lecomte R 2009. Performance evaluation of the LabPET APD-based digital PET scanner. IEEE Transactions on Nuclear Science, 56, 10–16. [Google Scholar]
- Borghi G, Peet JB, Tabacchini V & Schaart DS 2016. A 32 mm × 32 mm × 22 mm monolithic LYSO:Ce detector with dual-sided digital photon counter readout for ultrahigh-performance TOF-PET and TOF-PET/MRI. Phys Med Biol, 61, 4929–4949. [DOI] [PubMed] [Google Scholar]
- Bruyndonckx P, Leonard S, Liu JG, Tavernier S, Szupryczynski P & Fedorov A 2003. Study of spatial resolution and depth of interaction of APD-based PET detector modules using light sharing schemes. IEEE Trans. Nucl. Sci, 50, 1415–1419. [Google Scholar]
- Burger C, Goerres G, Schoenes S, Buck A, Lonn AH & Von Schulthess GK 2002. PET attenuation coefficients from CT images: experimental evaluation of the transformation of CT into PET 511-keV attenuation coefficients. Eur J Nucl Med Mol Imaging, 29, 922–7. [DOI] [PubMed] [Google Scholar]
- Casey ME, Burbar Z, Rothfuss H, Panin V & Bharkhada D 2017. A next generation SiPM based PET/CT system with improved time and spatial resolution. J Nucl Med, 58, 1332S. [Google Scholar]
- Chatziioannou AF, Cherry SR, Shao YP, Silverman RW, Meadors K, Farquhar TH, Pedarsani M & Phelps ME 1999. Performance evaluation of microPET: A high-resolution lutetium oxyorthosilicate PET scanner for animal imaging. J Nucl Med, 40, 1164–1175. [PMC free article] [PubMed] [Google Scholar]
- Cherry SR, Shao Y, Silverman RW, Meadors K, Siegel S, Chatziioannou A, Young JW, Jones W, Moyers JC, Newport D, Boutefnouchet A, Farquhar TH, Andreaco M, Paulus MJ, Binkley DM, Nutt R & Phelps ME 1997. MicroPET: a high resolution PET scanner for imaging small animals. IEEE Trans Nucl Sci, 44, 1161–1166. [Google Scholar]
- Daube-Witherspoon ME & Muehllehner G 1987. Treatment of axial data in threedimensional PET. J Nucl Med, 28, 1717–1724. [PubMed] [Google Scholar]
- Degenhardt C, Rodrigues P, Trindade A, Zwaans B, Mulhens O, Dorscheid R, Thon A, Salomon A & Frach T Performance evaluation of a prototype positron emission tomography scanner using digital photon counters (DPC). 2012. IEEE Nuclear Science Symposium and Medical Imaging Conference, 2012 Anaheim, CA, USA: 2820–2824. [Google Scholar]
- Espana S, Marcinkowski R, Keereman V, Vandenberghe S & Van Holen R 2014. DigiPET: sub-millimeter spatial resolution small animal PET imaging using monolithic scintillators. Physics in Medicine and Biology, 59, 3405–3420. [DOI] [PubMed] [Google Scholar]
- Goertzen AL, Bao Q, Bergeron M, Blankemeyer E, Blinder S, Canadas M, Chatziioannou AF, Dinelle K, Elhami E, Jans HS, Lage E, Lecomte R, Sossi V, Surti S, Tai Y-C, Vaquero JJ, Vicente E, Williams DA & Laforest R 2012. NEMA NU 4–2008 comparison of preclinical PET imaging systems. Journal of Nuclear Medicine, 53, 1300–1309. [DOI] [PMC free article] [PubMed] [Google Scholar]
- Hsu DFC, Ilan W, Peterson WT, Uribe J, Lubberink M & Levin CS 2017. Studies of a next generation silicon-photomultiplier-based time-of-flight PET/CT system. J Nucl Med, 58, 1511–18. [DOI] [PubMed] [Google Scholar]
- Huisman MC, Reder S, Weber AW, Ziegler SI & Schwaiger M 2007. Performance evaluation of the Philips MOSAIC small animal PET scanner. Eur J Nucl Med Mol Imaging, 34, 532–40. [DOI] [PubMed] [Google Scholar]
- Ishii K, Kikuchi Y, Matsuyama S, Kanai Y, Kotani K, Ito T, Yamazaki H, Funaki Y, Iwata R, Itoh M, Yanai K, Hatazawa J, Itoh N, Tanizaki N, Amano D, Yamada M & Yamaguchi T 2007. First achievement of less than 1 mm FWHM resolution in practical semiconductor animal PET scanner. Nuclear Instruments and Methods in Physics Research Section A: Accelerators, Spectrometers, Detectors and Associated Equipment, 576, 435–440. [Google Scholar]
- Jeavons AP, Chandler RA & Dettmar C a. R 1999. A 3D HIDAC-PET camera with sub-millimetre resolution for imaging small animals. IEEE Trans. Nucl. Sci, 46, 468–473. [Google Scholar]
- Joung J, Miyaoka RS & Lewellen TK 2002. cMiCE: a high resolution animal PET using continuous LSO with a statistics based positioning scheme. Nucl. Instr. Meth. (A), 489, 584–598. [Google Scholar]
- Kaul M, Surti S & Karp JS 2013. Combining Surface Treatments with Shallow Slots to Improve the Spatial Resolution Performance of Continuous, Thick LYSO Detectors for PET. IEEE Trans. Nucl. Sci, 60, 44–52. [DOI] [PMC free article] [PubMed] [Google Scholar]
- Knoess C, Siegel S, Smith A, Newport D, Richerzhagen R, Winkeler A, Jacobs A, Goble RN, Graf R, Wienhard K & Heiss WD 2003. Performance evaluation of the microPET R4 PET scanner for rodents. Eur. J. Nucl. Med, 30, 737–747. [DOI] [PubMed] [Google Scholar]
- Kwon S-I, Lee JS, Yoon HS, Ito M, Ko GB, Choi JY, Lee S-H, Song IC, J.M. J, Lee DS & Hong SJ 2011. Development of small-animal PET Prototype Using Silicon Photomultiplier (SiPM): Initial results of phantom and animal imaging studies. J Nucl Med, 52, 572–579. [DOI] [PubMed] [Google Scholar]
- Lecomte R, Cadorette J, Richard P, Rodrigue S & Rouleau D 1994. Design and engineering aspects of a high-resolution positron tomograph for small animal imaging. IEEE Transactions on Nuclear Science, 41, 1446–1452. [Google Scholar]
- Ling T, Lewellen TK & Miyaoka RS 2007. Depth of interaction decoding of a continuous crystal detector module. Phys. Med. Biol, 52, 2213–2228. [DOI] [PubMed] [Google Scholar]
- Maas MC, Van Der Laan DJ, Schaart DR, Huizenga J, Brouwer JC, Bruyndonckx P, Leonard S, Lemaitre C & Van Eijk CWE 2006. Experimental characterization of monolithic-crystal small animal PET detectors read out by APD arrays. IEEE Trans. Nucl. Sci, 53, 1071–1077. [Google Scholar]
- Miller M, Zhang J, Binzel K, Griesmer J, Laurence T, Narayanan M, Natarajamani D, Wang S & Knopp M 2015. Characterization of th Vereos Digital Photon Counting PET system. J Nucl Med, 56, 434S. [Google Scholar]
- Mollet P, Deprez K, Vandeghinste B, Neut S, Marcinkowski R, Vandenberghe S & Van Holen R 2017. The β-CUBE, a high-end compact preclinical benchtop PET for total body imaging. J Nucl Med, 58, 393S. [Google Scholar]
- Nagy K, Toth M, Major P, Patay G, Egri G, Haggkvist J, Varrone A, Farde L, Halldin C & Gulyas B 2013. Performance evaluation of the small-animal nanoScan PET/MRI system J Nucl Med, 54, 1825–32. [DOI] [PubMed] [Google Scholar]
- Nema 2008. NEMA Standards Publication NU 4–2008 Performance Measurements of Small Animal Positron Emission Tomographs. Rosslyn, VA: National Electrical Manufacturers Association. [Google Scholar]
- Park S-J, Rogers WL, Huh S, Kagan H, Honscheid K, Burdette D, Chesi E, Lacasta C, Llosa G, Mikuz M, Studen A, Weilhammer P & Clinthorne NH 2007. Performance evaluation of a very high resolution small animal PET imager using silicon scatter detectors. Phys Med Biol, 52, 2807–2826. [DOI] [PubMed] [Google Scholar]
- Sato K, Shidahara M, Watabe H, Watanuki S, Ishikawa Y, Arakawa Y, Nai YH, Furumoto S, Tashiro M, Shoji T, Yanai K & Gonda K 2016. Performance evaluation of the small-animal PET scanner ClairvivoPET using NEMA NU4– 2008 standards. Phys. Med. Biol, 61, 696–711. [DOI] [PubMed] [Google Scholar]
- Schaart DR, Van Dam HT, Seifert S, Vinke R, Dendooven P, Lohner H & Beekman FJ 2009. A novel, SiPM-array-based, monolithic scintillator detector for PET. Phys Med Biol, 54, 3501–3512. [DOI] [PubMed] [Google Scholar]
- Seifert S, Van Der Lei G, Van Dam HT & Schaart DR 2013. First characterization of a digital SiPM based time-of-flight PET detector with 1 mm spatial resolution. Phys Med Biol, 58, 3061–74. [DOI] [PubMed] [Google Scholar]
- Spinks TJ, Karia D, Leach MO & Flux G 2014. Quantitative PET and SPECT performance characteristics of the Albira Trimodal pre-clinical tomograph. Phys Med Biol, 59, 715–731. [DOI] [PubMed] [Google Scholar]
- Strother SC, Casey ME & Hoffman EJ 1990. Measuring PET scanner sensitivity: Relating count rates to image signal-to-noise ratios using noise equivalent counts. IEEE Trans Nucl Sci, 37, 783–788. [Google Scholar]
- Surti S, Karp JS & Muehllehner G 2003. Evaluation of pixelated NaI(Tl) detectors for PET. IEEE Trans. Nucl. Sci, 50, 24–31. [Google Scholar]
- Surti S, Karp JS, Perkins AE, Cardi CA, Daube-Witherspoon ME, Kuhn A & Muehllehner G 2005. Imaging performance of A-PET: A small animal PET camera. IEEE Trans. Med. Imag, 24, 844–852. [DOI] [PubMed] [Google Scholar]
- Szanda I, Mackewn J, Patay G, Major P, Sunassee K, Mullen G, Nemeth G, Haemisch Y, Blower P & Marsden PK 2011. National Electrical Manufacturers Association NU-4 Performance Evaluation of the PET Component of the NanoPET/CT Preclinical PET/CT Scanner. J Nucl Med, 52, 1741–1747. [DOI] [PubMed] [Google Scholar]
- Tai YC, Chatziioannou AF, Yang YF, Silverman RW, Meadors K, Siegel S, Newport DF, Stickel JR & Cherry SR 2003. MicroPET II: design, development and initial performance of an improved microPET scanner for small-animal imaging. Phys. Med. Biol, 48, 1519–1537. [DOI] [PubMed] [Google Scholar]
- Ueno Y, Morimoto Y, Tsuchiya K, Yanagita N, Kojima S, Ishitsu T, Kitaguchi H, Kubo N, Zhao S, Tamaki N & Amemiya K 2009. Basic Performance Test of a Prototype PET Scanner Using CdTe Semiconductor Detectors. IEEE Transactions on Nuclear Science, 56, 24–28. [Google Scholar]
- Vaska P, D.-H. K, Southekal S, Pratte J-F, Fried J, Krishnamoorthy S, Bolotnikov A, Stoll S & Bolotnikov A 2009. Ultra-high resolution PET: A CZT-based scanner for the mouse brain. Journal of Nuclear Medicine, 50, 293–293. [Google Scholar]
- Vaska P, Krishnamoorthy S, Stoll S, Woody CL, O’connor P, Purschke M, Boose S, Schlyer DJ & Villanueva A 2004. An improved Anger detector approach for PET with high resolution and sensitivity. IEEE Nuclear Science Symposum and Medical Imaging Conference Record, 6, 3463–3466. [Google Scholar]
- Walker MD, Goorden MC, Dinelle K, Ramakers RM, Blinder S, Shirmohammad M, Van Der Have F, Beekman F & Sossi V 2014. Performance assessment of a preclinical PET scanner with pinhole collimation by comparison to a coincidence-based small animal PET scanner. J Nucl Med, 55, 1368–74. [DOI] [PubMed] [Google Scholar]
- Wang Y, Seidel J, Tsui BM, Vaquero JJ & Pomper MG 2006. Performance evaluation of the GE healthcare eXplore VISTA dual-ring small-animal PET scanner. J Nucl Med, 47, 1891–900. [PubMed] [Google Scholar]
- Watson CC, Newport D & Casey ME 1996. A Single Scatter Simulation Technique for Scatter Correction in 3D PET. Three-Dimensional Image Reconstruction in Radiology and Nuclear Medicine, 4, 255–268. [Google Scholar]
- Wehner J, Weissler B, Dueppenbecker PM, Gebhardt P, Goldschmidt B, Schug D, Kiessling F & Schulz D 2015. MR-compatibility assessment of the first preclinical PET-MRI insert equipped with digital silicon photomultipliers. Phys Med Biol, 60, 2231–2255. [DOI] [PubMed] [Google Scholar]
- Zhang H, Bao Q, T.N. V, Silverman R, Taschereau R, Berry-Pusey BN, Ali D, Rannou FR, Stout DB & Chatziioannou AF 2011. Performance evaluation of PETbox: A low cost bench top preclinical PET scanner. Mol. Imaging Biol, 13, 949–961. [DOI] [PMC free article] [PubMed] [Google Scholar]


