

Abstract
Two major GABAA receptor classes mediate ionotropic GABA signaling, those containing a δ subunit and those with a γ2 subunit. The classical viewpoint equates γ2-containing receptors with IPSCs and δ-containing receptors with tonic inhibition because of differences in receptor localization, but significant questions remain because the populations cannot be pharmacologically separated. We removed this barrier using gene editing to confer a point mutation on the δ subunit in mice, rendering receptors containing the subunit picrotoxin resistant. By pharmacologically isolating δ-containing receptors, our results demonstrate their contribution to IPSCs in dentate granule neurons and weaker contributions to thalamocortical IPSCs. Despite documented extrasynaptic localization, we found that receptor localization does not preclude participation in isolated IPSCs, including mIPSCs. Further, phasic inhibition from δ subunit-containing receptors strongly inhibited summation of EPSPs, whereas tonic activity had little impact. In addition to any role that δ-containing receptors may play in canonical tonic inhibition, our results highlight a previously underestimated contribution of δ-containing receptors to phasic inhibition.
SIGNIFICANCE STATEMENT GABAA receptors play key roles in transient and tonic inhibition. The prevailing view suggests that synaptic γ2-containing GABAA receptors drive phasic inhibition, whereas extrasynaptic δ-containing receptors mediate tonic inhibition. To re-evaluate the impact of δ receptors, we took a chemogenetic approach that offers a sensitive method to probe the synaptic contribution of δ-containing receptors. Our results reveal that localization does not strongly limit the contribution of δ receptors to IPSCs and that δ receptors make an unanticipated robust contribution to phasic inhibition.
Keywords: GABA, hippocampus, inhibition, IPSC, picrotoxin, tonic
Introduction
GABAA receptor-mediated inhibition sculpts neuronal activity and regulates key behaviors (Vardya et al., 2012; Ye et al., 2013). These functions are mediated by two classes of GABAA receptors defined by γ2 versus δ subunit incorporation (referred to herein as γ2 receptors and δ receptors, respectively). The relative contributions of these two receptor classes to inhibition remain unclear. The prevailing picture is that γ2 subunits carry synaptic localization signals and mediate IPSCs (phasic inhibition), whereas δ subunits are extrasynaptic, confer high GABA affinity, and mediate tonic inhibition (Brickley and Mody, 2012; Whissell et al., 2015). δ Receptors have been implicated in consciousness, mood disorders, schizophrenia, and epilepsy (Cope et al., 2005; Maguire et al., 2005; Maldonado-Avilés et al., 2009; Feng et al., 2010; Macdonald et al., 2010; Whissell et al., 2015), perhaps because of expression in select though pivotal neuronal populations.
Pharmacology and genetic deletions of δ or its preferred partners, α4 and α6, suggest a small or negligible contribution of δ to IPSCs (Wei et al., 2003; Brickley and Mody, 2012; Herd et al., 2013). The caveats of genetic deletion studies and pharmacology notwithstanding (Peng et al., 2002; Hoestgaard-Jensen et al., 2010; Lee and Maguire, 2014), the prevailing view attributes δ receptors' major role in tonic inhibition to extrasynaptic localization (Nusser et al., 1998; Wei et al., 2003; Sun et al., 2004; Wu et al., 2012; Martenson et al., 2017). An untested alternative is that the high GABA affinity of δ receptors compensates for extrasynaptic localization (Brown et al., 2002; Wohlfarth et al., 2002; Akk et al., 2004; You and Dunn, 2007; Mortensen et al., 2010; Eaton et al., 2014). It is also difficult to test the quantitative impact of the δ contribution to inhibition, using absence (genetic deletion) models or potentiation by drugs, which may recruit receptors not normally activated. Instead, pharmacological isolation of δ receptors could mitigate the disadvantages of previous approaches and reveal the quantitative impact of δ receptors on inhibition. Unfortunately, no known antagonists distinguish δ receptors from γ2 receptors.
Here we introduce a knock-in/chemogenetic approach to isolate endogenous δ and γ2 receptor populations. We developed two knock-in mouse lines harboring picrotoxin (PTX) resistance in the endogenous δ or γ2 subunit, respectively. Previous work showed that point mutations in a single subunit dramatically reduce PTX sensitivity while having little effect on basal receptor function (Gurley et al., 1995; Shen et al., 1999; Sedelnikova et al., 2006; Erkkila et al., 2008). We studied GABA inhibition in dentate granule cells (DGCs), neurons that control information flow through the hippocampus (Dengler and Coulter, 2016) and that is well known for α4/δ subunit expression (Wei et al., 2003). The γ2 mutation induced kinetic changes to baseline IPSCs, limiting the usefulness of these mice. However, the δ mutation rendered PTX resistance but produced no differences from WT behavior at baseline. PTX application thus allowed us to eliminate pharmacologically non-δ-containing receptors, thereby circumventing possible compensation for genetic loss and opening up within-cell experimental designs. Whole-cell recordings from DGCs suggest that the extrasynaptic location of δ-containing receptors does not limit participation in quantal events nor in evoked IPSCs. Further, the relative δ receptor contribution to evoked IPSC charge did not change with increased numbers of activated presynaptic fibers, implying that δ receptors accessible to synaptic GABA are fully recruited during evoked transmission. We found less contribution of δ receptors to IPSCs in thalamocortical neurons, another cell type expressing δ subunits. Despite the small contribution to peak IPSCs in DGCs, we demonstrate that phasic inhibition mediated by δ receptors reduces temporal summation of excitatory depolarization, whereas tonic inhibition contributes little. Our results suggest that the prevailing views of δ receptors' roles in tonic versus phasic inhibition need to be re-evaluated, at least for hippocampal DGCs.
Materials and Methods
CRISPR design/oligo design.
To generate δ* KI or γ2* KI knock-in mice, guide RNAs targeting the mouse GABRD or GABRG2 subunit and single-stranded oligodeoxynucleotide (ssODN) donor DNAs harboring the T269Y mutation were designed by The Hope Center Transgenic Vectors Core at Washington University. The targeting strategy included a silent mutation eliminating a CviAII restriction enzyme site to aid screening of mutant alleles. Target-specific single-guide RNAs (sgRNAs) were cloned into BbsI digested plasmid pX330 (Addgene, 42230) and sgRNA cleavage activity was validated in vitro by transfecting N2A cells with ROCHE Xtremegene HP, followed by T7E1 assay (New England Biolabs). T7 sgRNA and Cas9 templates for in vitro transcription were amplified by PCR, gel purified, and in vitro transcribed with the MEGAshortscript T7 kit (sgRNA, ThermoFisher Scientific) or the T7 mMessage mMachine Ultra kit (Cas9, ThermoFisher Scientific). After transcription, both RNAs were purified with the Megaclear kit (ThermoFisher Scientific). Two hundred nucleotide ssODN donor DNAs with the mutations centered within the oligos were synthesized by IDT Technologies as ultramer oligos. Concentrations for injection into the cytoplasm of fertilized eggs were as follows: 50 ng/μl Cas9, 25 ng/μl gRNA, 100 ng/μl ssODN. Founders were identified using Qiagen pyrosequencer and Pyromark Q96 2.5.7 software or by deep sequencing.
Sequence for sgRNAs were as follows:
δ: 5′-gctgacaatgaccacgctCa and γ2: taggaatcACTactgtcctg, respectively. The ssODN sequences were as follows:
δ: tgaagaactcccctttccctggaacccagccctgttggctagggtaaggaggagagggtaggacttcatcgctgaccatctactcccaccaggcatcTACactgtgctgacaatgaccacgctTatggtgtgcccgctcctccctgccacgggcttcagc tatcaaagctctggatgtgtatttttggatctgctacg.
γ2: aagcaaacagatacaaagagatccattgctgtgacataggagaccttgggcagagattttctggctatggtgcttaaagttgtcatTgtcaggacagtGTAgattcctatggacagcaaaataaaataaaacaaatcacatggtggcatcagagatagcctagagcacaagacggatgatgctctgtccaagctcccaca.
All animal procedures were performed according to NIH guidelines and approved by the Washington University Institutional Animal Care and Use Committee (IACUC). Cas9 mRNA, sgRNA, and ssODN constructs were injected into the cytoplasm and pronucleus of fertilized eggs. Injected eggs were cultured at 37°C under 5% CO2 overnight, after which 20–25 two-cell stage embryos were transferred into oviducts of pseudopregnant females. The mutant allele of the δ* KI or γ2* KI knock-in mouse was confirmed by PCR-based genotyping from tail DNA.
Mosaic founders were bred with WT mice. We screened and identified F1 mice with the desired mutations to establish colonies by heterozygote crosses. Littermate WT or heterozygote controls, variably obtained from the δ* KI or γ2* KI colony, were used for all experiments. In the case of δ* KI mutants, we discovered that all founders carrying the desired mutation also carried an unanticipated nucleotide change in intron 7–8, 15 nt upstream of the desired mutation. For the selected founders, this change was a C-A mutation 15 nt upstream of the desired mutation. Predictive software (http://spliceport.cbcb.umd.edu) showed no expectation for altered splicing, so we proceeded with characterization of the line. Mice were maintained on a mixed C57BL/6CBA background.
Slice preparation.
Hippocampal slices were prepared from postnatal day (P)28 to P58 GABAAR δ* KI, γ2* KI, or WT littermates of both sexes. The age range was in accord with previous studies of rodent dentate neurons (Stell et al., 2003; Wei et al., 2003; Glykys et al., 2008; Tao et al., 2013). The ages avoided developmental changes in IPSC kinetics, which stabilize after P21 (Hollrigel and Soltesz, 1997). When explicitly studying tonic current, we focused on P28–P46 to avoid undue influence of reported developmental changes in tonic current (Holter et al., 2010; Lee and Liou, 2013). Thalamocortical neurons were recorded from ventrobasal nuclei in 300 μm horizontal slices. Evoked IPSCs were stimulated from near the border of the reticular nucleus and the recorded cell. We used mice of both sexes (Hollrigel and Soltesz, 1997; Wei et al., 2003; Holter et al., 2010; Tao et al., 2013). Although female changes in δ associated with estrous may contribute to quantitative effects observed in DGCs (Maguire et al., 2005; Wu et al., 2013), the key finding of synaptic δ contribution was observed in slices from both female and male animals, and so results from males and females other than Figure 1 were pooled. Numbers of males and females were approximately balanced in each experiment.
Figure 1.

Validation of the knock-in/chemogenetic approach. A, Effect of the δ-preferring agonist THIP in a representative DGC from a WT slice. THIP induced a current superimposed on ongoing spontaneous phasic IPSCs. The putative δ selective positive allosteric modulator DS2 potentiated the THIP response, and PTX abolished both the phasic and potentiated THIP current. B, Summary of the THIP current in the indicated conditions from cells from five WT animals. Data points, each representing a cell, are color-coded by animal. Open triangles represent male mice, and circles represent female mice. The labels on the abscissa represent the conditions shown above the traces in A and indicate sequential coapplications. C, D, The same experiment from δ* KI animals. Note that the THIP/DS2 induced current was resistant to PTX, but phasic currents were strongly reduced. E, F, Same experiment from γ2* KI animals, with an outcome complementary to that of the δ* KI slices. Phasic IPSCs were left mostly intact, but THIP response was strongly antagonized. N = 22 cells from 5 WT animals, 19 cells from 5 δ* KI animals, and 19 cells from 5 γ2* KI animals. A general linear model assessment of THIP and THIP+DS2 current showed a strong main effect of drug on membrane current (p < 0.01) and a marginal main effect of sex (p = 0.046). The effect of drugs on membrane current did not interact statistically with sex (p = 0.15) or with genotype group (p = 0.16). Bonferroni corrected t tests on residual PTX current showed a difference between WT and δ* KI current (adjusted p value = 5.8 × 10⁻¹¹) but not between WT and γ2* KI current (adjusted p value = 0.88). G, Sample average mIPSC waveforms obtained in the presence of 1 μm tetrodotoxin (TTX). Each waveform represents 68–207 events from a single animal of each genotype, color-coded by animal and sex as above. H–J, Pooled mIPSC characteristics, showing altered mIPSCs from γ2* KI cells (N = 14 cells from 3 WT animals, 11 cells from 4 δ* KI animals, and 15 cells from 4 γ2* KI animals). IPSCs typically exhibited a bi-exponential decay. For ease of comparisons among IPSCs with complex decays, τw was calculated as described in the Materials and Methods. A one-way ANOVA with Bonferroni's multiple-comparisons test showed a difference in τw (adjusted p value = 1.3 × 10⁻⁷ ***, panel I) and frequency (adjusted p value = 5.3 × 10⁻⁶ ***, panel J) between WT and γ2* KI mIPSCs on but not between WT and δ* KI mIPSCs (adjusted p value > 0.99 and p = 0.5, respectively). Asterisks in J indicate comparisons with WT and δ* KI respectively. K, Sample average sIPSC waveforms obtained in the absence of 1 μm TTX. Each waveform represents 122–181 events from a single animal of each genotype, color-coded as indicated. L–N, Analysis of basal sIPSCs, obtained in the absence of TTX (N = 12 cells from 4 WT animals, 13 cells from 5 δ* KI animals, and 14 cells from 3 γ2* KI animals). A one-way ANOVA with Bonferroni's multiple-comparisons test showed a significant difference between WT and γ2* KI sIPSCs on τw (adjusted p value = 9.1 × 10⁻⁷ ***, panel M) but not between WT and δ * KI sIPSCs (adjusted p value > 0.99).
In accordance with protocols approved by the Washington University IACUC, mice were anesthetized with isoflurane and decapitated. The brain was removed and glued onto a Leica VT1200 specimen holder. Sagittal (300 μm) slices were cut in ice-cold, modified artificial CSF (ACSF; in mm: 87 NaCl, 75 sucrose, 25 glucose, 25 NaHCO3, 2.5 KCl, 1.25 NaH2PO4, equilibrated with 95% oxygen-5% CO2 plus 0.5 CaCl2, 3 MgCl2; 320 mOsm). Slices were then incubated at 32–34°C for 30 min in choline-based ACSF (in mm: 92 choline chloride, 25 glucose, 30 NaHCO3, 2.5 KCl, 1.2 NaH2PO4, 20 HEPES, 2 thiourea, 5 Na ascorbate, 3 Na pyruvate, 2 CaCl2, and 1 MgCl2, equilibrated with 95% oxygen-5% CO2; 300 mOsm), and subsequently stored at room temperature in regular ACSF (in mm: 125 NaCl, 25 glucose, 25 NaHCO3, 2.5 KCl, 1.25 NaH2PO4, equilibrated with 95% oxygen-5% CO2 plus 2.6 CaCl2, 1.2 MgCl2; 310 mOsm), allowing for at least 1 h recovery before experiments. Except for noted exceptions, drugs were obtained from ThermoFisher Scientific.
Whole-cell patch-clamp recording in slices.
Slices were transferred to a recording chamber and continuously perfused with oxygenated, regular ACSF at 2 ml · min−1. Experiments were performed at 30–32°C. To isolate GABAA responses, ionotropic glutamate receptors were blocked with either 2 mm kynurenic acid or 10 μm NBQX (Tocris Bioscience) and 50 μm D-APV (Tocris Bioscience) for all experiments unless otherwise stated. For experiments assessing the impact of either tonic or phasic GABA inhibition on EPSP summation, 1 μm CGP-55845 (Tocris Bioscience) was also included in extracellular solutions to inhibit GABABRs. One hundred micromolar PTX (Tocris Bioscience) was bath-applied to isolate either δ* KI or γ2* KI-mediated GABAAR currents, and in most experiments 100 μm gabazine was applied at the end to verify pure GABAAR currents.
Somatic, whole-cell patch-clamp recordings were performed using standard differential contrast interference microscopy under infrared illumination. Dentate granule cells were identified on an upright Nikon Eclipse E600FN microscope and a QImaging camera controlled with QCapture (QImaging). Somatic whole-cell recordings were made with borosilicate patch pipettes (World Precision Instruments; Sutter Instruments), having open tip resistance of 3–7 MΩ. After a whole-cell configuration was established, cells were allowed to fill with the intracellular solution for ∼5 min. Recordings were obtained using a MultiClamp 700B amplifier (Molecular Devices), Digidata1550 16-bit A/D converter, and pClamp 10.4 software (Molecular Devices). Pipette capacitance was adjusted using MultiClamp 700B Commander software. Somatic access resistance values were between 10 and 25 MΩ and were compensated for current amplitudes >2 nA (see Fig. 4), and cells with unstable access resistance (>20% change) were excluded from analysis.
Figure 4.

Effect of stimulus intensity on the δ contribution to evoked IPSCs. A, Input/output characteristics of peak IPSCs before PTX application, generated by normalizing peak amplitude of each IPSC to the final IPSC (N = 8 cells from 2 δ* KI animals). Arrows indicate low, moderate, and high intensities used for following comparisons. The amplitudes analyzed represented 22.3 ± 2.7%, 73 ± 8.5% and 102 ± 4.8% of the maximum intensity. B, Representative evoked IPSCs from a single cell at the various stimulus intensities in the absence (black) and presence (red) of PTX. C, Comparison of peak amplitude and total charge of IPSCs evoked at low, moderate, and high intensities (N = 7 cells from 2 δ* KI animals). D, IPSC decay τw values at the various stimulus intensities in the absence and presence of PTX. E, Time to peak for IPSCs at the various stimulus intensities in the absence and presence of PTX. Time to peak was calculated from the stimulus artifact. C–E, Comparisons were made by one-way repeated-measures ANOVA, followed by Bonferroni's multiple-comparisons test between the indicated conditions. These results revealed a significant change in percentage contribution of δ to IPSC peak amplitude, and time to peak IPSC in the absence of PTX, between low and high intensity (adjusted p value = 0.03 for both comparisons, *), and significant increase of decay τw of IPSC with increasing stimulus intensity in PTX (adjusted p value = 0.003 **, 0.0002, and 0.0008, ***).
Measurement of tonic and phasic GABAAR currents.
Cells were voltage-clamped at −70 mV, with the intracellular pipette solution containing the following (in mm): 130 CsCl, 10 HEPES, 5 EGTA, 2 MgATP, 0.5 NaGTP, and 4 QX-314; pH was adjusted with CsOH to pH 7.3; 290 mOsm. Tonic GABAAR currents were induced by THIP (1 μm), GABA (5 μm), or muscimol (0.5 μm; ThermoFisher Scientific). In some experiments DS2 (10 μm; Tocris Bioscience) was used. Tonic currents were acquired in gap-free mode at 2 kHz, filtered at 1 kHz using an 8-pole Bessel filter. For assessing evoked GABAAR IPSCs, a glass monopolar stimulating electrode was placed in the molecular layer, ∼20 μm away from DGC body layer and 50 μm away from the recorded cell. Stimulation was applied at 0.05 Hz, with 0.2 ms pulse width. For measuring spontaneous or miniature GABAAR IPSCs, data were acquired in gap-free mode in the absence or presence of 1 μm tetrodotoxin (TTX; Tocris Bioscience). All the IPSC data were acquired at 5 kHz, and filtered at 2 kHz using an 8-pole Bessel filter.
Assessment of GABAAR I–V relationship.
Cells were initially voltage-clamped at −70 mV, with the intracellular pipette solution containing the following (in mm): 130 Cs methanesulfonate, 4 NaCl, 0.5 CaCl2, 10 HEPES, 5 EGTA, and 5 QX-314, pH was adjusted with CsOH to pH 7.3; 290 mOsm. Holding current was recorded during 1 s voltage ramps from +50 to −90 mV. Voltage-dependent Ca2+ channels were inactivated by depolarizing the cell to +50 mV for 0.2 s before each ramp. Ramps were performed at baseline, during bath-applied GABA application (10–20 μm), and after GABA washout/100 μm gabazine application. In two of the four cells recorded, 1 μm CGP-55845 was included in the extracellular solution to block GABABR receptors. Six sweeps from each condition were averaged, and the GABA I–V curve was constructed by digitally subtracting current in the presence of gabazine.
Measurement of αEPSP and electrically-evoked EPSPs.
Cells were current-clamped, with the intracellular pipette solution containing the following (in mm): 140 K-gluconate, 4 MgCl2, 10 HEPES, 0.4 EGTA, 4 MgATP, 0.3 NaGTP, and 10 phosphocreatine, pH was adjusted with KOH to pH 7.25; 290 mOsm. For measuring αEPSP peak summation, DGCs were initially maintained at −85 mV with constant current injection when necessary, and a train of sEPSC-like currents was injected. sEPSC-like currents were generated by averaging 140 sEPSCs collected from a DGC. A train of these currents composed of five pulses at 50 Hz was generated by Clampfit's time-shift and arithmetic function. Current intensity was adjusted to evoke αEPSPs with peak amplitudes ≥6 mV. To evoke phasic GABA currents, a concentric bipolar stimulating electrode was placed in the molecular layer, ∼50 μm away from DG cell body layer. We delivered five stimuli at 50 Hz (0.05–0.2 ms pulse width), with each pulse delivered 10 ms before each αEPSP. For measuring electrically-evoked EPSPs, AMPARs were left unblocked throughout the experiments, and both EPSPs/IPSPs were electrically-evoked with 50 Hz stimulation. Five micromolar QX-314 was included in the internal solution to block sodium current in the recorded cell. Data were acquired at 10 kHz, and filtered at 4 kHz using an 8-pole Bessel filter.
GABA iontophoresis.
Iontophoresis was performed using an Axoclamp-2B amplifier (Molecular Devices). The iontophoretic pipette, with 50–100 MΩ tip resistance, was filled with 1 M GABA solution (pH was adjusted to ∼5 with HCl). AlexaFluor 488 hydrazide (100–200 μm; ThermoFisher Scientific) was added into both iontophoretic pipette and whole-cell patch pipette for visualization. Before penetrating slice tissues, the iontophoretic pipette capacitance was compensated using a 10 nA, 10 ms test pulse. The iontophoretic pipette was then moved to ∼1 μm from the cell soma or dendrite without touching it, as described previously (Müller and Remy, 2013). To prevent GABA from leaking out of the pipette, a negative retaining current (−10 to −40 nA) was applied until no change of the holding current in the whole-cell recording was observed as the iontophoretic pipette approached the targeted cell. To evoke iontophoretic GABA IPSCs, 0.5–1 ms current pulses ranging from 10 to 970 nA were applied to generate an input/output (I/O) curve. Current injection at 900 nA induced GABA current that reached saturation for both peak and decay time constant. Therefore, 900 pA was selected as the fixed-current value for inducing iontophoretic GABA IPSCs before/after PTX.
Immunostaining.
Mice were perfused transcardially with PBS, followed by 4% paraformaldehyde for 3 min. Brains remained in the skull for 30 min on ice, then were postfixed for 1 h in 4% paraformaldehyde and cryoprotected for 48 h in 30% sucrose at 4°C. Brains were frozen on dry ice, then coronally sectioned at 45 μm on a freezing microtome. Free-floating sections were blocked in 10% normal goat serum and 0.3% Triton-X detergent for 1 h, then incubated overnight at room temperature in a 1:1000 dilution of primary rabbit anti-δ subunit antibody validated previously (Spigelman et al., 2003, courtesy Dr. Werner Sieghart). Staining patterns were confirmed with another antibody (Alomone Labs, catalog #AGA-014; Antibody registry #AB-2340938). Antibodies were visualized with an AlexaFluor 488-conjugated anti-rabbit secondary antibody.
Western blotting.
Proteins were isolated from mouse hippocampal tissue with RIPA lysis buffer containing 150 mm sodium chloride, 1% Triton X-100, 0.5% sodium deoxycholate, 2.5 mm EDTA, 0.1% SDS, and 50 mm Tris-HCl, pH 8. Protease inhibitor cocktail was added in the lysis buffer. Homogenates were centrifuged at 15,000 rpm at 4°C for 20 min. The clear supernatant was stored at −70°C. Protein concentrations within each homogenate were determined with the Pierce Coomassie protein assay reagent (Micro BCA, ThermoFisher Scientific). A 25 μg sample of proteins was subjected to a 4–15% polyacrylamide gel (Bio-Rad Laboratories) at 100 V for 1 h. Resolved proteins and prestained molecular weight markers (ThermoFisher Scientific) were transferred electrophoretically onto an Immunobilon-P membrane (Millipore; Sigma) at 4°C and processed for immunodetection. The membrane was incubated with a blocking solution containing 3% nonfat milk in PBS for 1 h at RT. The membrane was then incubated with the same rabbit anti-δ polyclonal antibody used for immunostaining at 1 mg/ml dilution in blocking solution at 4°C overnight and washed at RT for 15 min three times. The membrane was next incubated with horseradish peroxidase-conjugated goat anti-rabbit IgG secondary antibody (Santa Cruz Biotechnology) 1:500 dilution for 2 h at RT. Detection was performed with the Lumigen ECL Ultra kit, according to the manufacturer's protocol. The Kodak ImageStation 440CF was used to capture the bands digitally. The intensity of bands was quantitated with ImageJ software (NIH). After image capture, blots were stripped using Restore Western blot Stripping Buffer (Pierce) and reprobed with tubulin antibody (Millipore; Sigma) as a control for sample loading.
Experimental design and statistical analysis.
For tonic GABAA current measurement, mean values of holding currents from each condition were calculated within a selected region where drug(s) had reached maximal effect. For evoked or iontophoretic IPSC analysis, mean values of peak/weighted decay time constant (τw) were calculated from the average of 10–20 sweeps taken at baseline and again following stabilization of drug effects. For αEPSP analysis, mean values of summation and decay τw were calculated from a single sweep. For spontaneous IPSC (sIPSC)/miniature IPSC (mIPSC) analysis, the entire dataset was excluded if signs of seal breakdown were detected in the gabazine condition. sIPSCs/mIPSCs were detected using a template-matching algorithm in Clampfit (Clements and Bekkers, 1997); templates were created by averaging >20 events. For estimation of maximal δ currents induced by muscimol, we used a literature estimate of muscimol EC50 on γ2 and δ receptors (You and Dunn, 2007; Mortensen et al., 2010), as described in the Results. Decay times were assigned based on single or bi-exponential least-squares fits as appropriate. For bi-exponential fits, we collapsed the two components into an overall decay τw constant for pooling and for comparisons. The τw was calculated as ΣAi × τi, where Ai is the fractional amplitude and τi is the time constant of the component.
For quantification of δ contribution to IPSCs, we calculated the effect of PTX on peak evoked and mIPSC amplitude in δ* KI slices. For mIPSCs, a correction was made for the apparent decrease in mIPSC frequency after PTX application. The method assumes that the frequency decrease arises because the smallest δ receptor mIPSCs fall below detection threshold. If δ mIPSC frequency in PTX is 10% that observed for γ+ δ mIPSCs before PTX application, we assume that the δ mIPSCs represent the largest 10% of combined γ2 and δ events in the absence of PTX (Stell and Mody, 2002). Comparison of δ mIPSC average peak amplitude with that of the largest 10% of γ2+ δ mIPSCs yields the estimated δ contribution to synaptic (mIPSC) responses.
Cells served as the statistical basis of N for all experiments; animal number is reported in figure legends. For genotype comparisons, we confirmed that p values remained below the 0.05 criterion when animals (averages from all cells from an animal) were used as data points. Student's independent, two-tailed t test was performed to determine statistical significance between the means of two groups. For multiple group (>2 groups) comparisons, one-way ANOVA and Bonferroni corrected, post hoc analyses were performed, or a general linear model analysis as indicated. For detection of effects within cells, a paired t test or one-way repeated-measures ANOVA was performed. Statistical analysis was performed using GraphPad Prism 7. For clarity, specific tests are described in the Results. In figures significance is displayed at the level of *p ≤ 0.05, **0.01, and ***0.001. Summary data are presented as mean ± SEM. Raw data are available at the Figshare data repository https://figshare.com/s/22f424870163b0e9ed3c.
Results
PTX-resistant components of GABAAR current in knock-in mice
We used CRISPR-Cas9 to edit the endogenous γ2 or δ locus of two separate lines of mice to generate a point mutation rendering either δ- or γ2-containing receptor populations insensitive to PTX (abbreviated δ* KI and γ2* KI herein). We first validated the use of the animals in several ways. We addressed the impact of PTX on agonist responses and phasic GABA transmission in DGCs of the various genotypes. We applied the δ-preferring agonist THIP (1 μm; Belelli et al., 2005; Cope et al., 2005; Jia et al., 2005; Meera et al., 2011) to elicit GABAA receptor-mediated currents (Fig. 1A–F). Consistent with expected THIP selectivity for δ receptors, the current amplitude was enhanced by the putative δ-selective-positive allosteric modulator DS2 in WT, δ* KI and γ2* KI slices (10 μm; Fig. 1A–F; Wafford et al., 2009; Shu et al., 2012; Jensen et al., 2013). Both the DS2-potentiated THIP current and spontaneous phasic currents were eliminated by PTX in WT slices (100 μm; Fig. 1A,B). We observed little evidence of basal tonic current in WT animals, evidenced by the lack of outward current with PTX application, relative to initial baseline (Fig. 1A,B). Unlike WT cells, DS2-potentiated THIP current from δ* KI cells was insensitive to PTX, whereas spontaneous phasic IPSCs were strongly reduced (Fig. 1C,D; WT vs δ* KI holding currents in PTX, t(57) = 8.22; p = 5.8 × 10⁻¹¹, Bonferroni corrected t test). γ2* KI slices exhibited complementary results; THIP current was abolished by PTX, whereas phasic IPSCs remained (Fig. 1E,F; WT vs γ2* KI holding currents in PTX, t(57) = 0.77; p = 0.88, Bonferroni corrected t test). The amplitude of THIP current was not statistically different among genotypes (Fig. 1A–F; F(1,55) = 1.93, p = 0.16; general linear model assessment), suggesting that mutant receptors are expressed similarly to WT. We conclude that δ* KI slices offer a powerful model system for exploring conditions under which δ-containing GABAARs are activated.
In these initial studies we examined the influence of sex on the amplitude of THIP-induced current (Fig. 1B,D,F). We found a modest effect of sex on THIP-induced current across genotype (Fig. 1B,D,F; F(1,55) = 4.2, p = 0.046; general linear model assessment). Throughout remaining figures males and females were pooled and used in approximately equal numbers for each experiment.
Characteristics of spontaneous GABAA receptor-mediated transmission in δ* KI slices were consistent with the idea that mutated δ subunits did not discernibly alter mIPSCs in the presence of tetrodotoxin or sIPSCs (Fig. 1G–N; mIPSC peak: F(2,37) = 1.79, p = 0.18, ANOVA; mIPSC decay: F(2,37) = 31.27, p = 1.1 × 10⁻⁸, ANOVA; t(37) = 0.44, p > 0.99, Bonferroni corrected t test; sIPSC peak: F(2,36) = 0.42, p = 0.66, ANOVA; sIPSC decay: F(2,36) = 26.45, p = 8.6 × 10⁻⁸, ANOVA; t(36) = 0.06, p > 0.99, Bonferroni corrected t test). However, we observed unexpected changes in γ2* KI-mediated sIPSCs and mIPSCs from γ2* KI cells (before PTX application) that limited usefulness of these animals for present purposes. Kinetics of decay of both sIPSCs and mISPCs in γ2* KI cells were faster than WT or δ* KI cells (Fig. 1G–N; mIPSC decay: F(2,37) = 31.27, p = 1.1 × 10⁻⁸, ANOVA; t(37) = 6.73, p = 1.3 × 10⁻⁷, Bonferroni corrected t test; sIPSC decay: F(2,36) = 26.45, p = 8.6 × 10⁻⁸, ANOVA; t(36) = 6.14, p = 9.1 × 10⁻⁷, Bonferroni corrected t test). In addition, the frequency of mIPSCs from γ2* KI animals was lower than that of either WT or of δ* KI animals (Fig. 1J; F(2,37) = 16.72, p = 6.7 × 10⁻⁶, ANOVA; t(37) = 5.54, p = 5.3 × 10⁻⁶, Bonferroni corrected t test). The altered kinetics appears to result from the mutated γ2* KI subunit rather than omission of γ2 or substitution of another subunit, as sIPSCs from γ2* KI cells were resistant to PTX (Fig. 1E). We conclude that the γ2* KI mutation had unanticipated effects on the kinetics of receptor function, which may in turn have induced secondary changes, including the mIPSC frequency decrease. The latter change could suggest fewer postsynaptic sites or presynaptic changes relative to WT cells. As a result of observations in Figure 1, we focused on characterizing δ* KI transmission in subsequent studies.
Contribution of δ subunit-containing receptors to evoked IPSCs, spontaneous IPSCs, and miniature IPSCs
The results of Figure 1 suggest that δ* KI receptors target similarly to WT δ receptors. We also examined light microscopic evidence for this. In tissue immunostained for the δ subunit, we found that characteristic expression patterns in the dentate molecular layer and in certain thalamic nuclei were preserved in δ* KI tissue (Fig. 2A–D). We also found no difference in δ subunit protein levels between δ* KI and WT hippocampal tissues (Fig. 2E,F; t(6) = 0.86, p = 0.42, unpaired t test).
Figure 2.
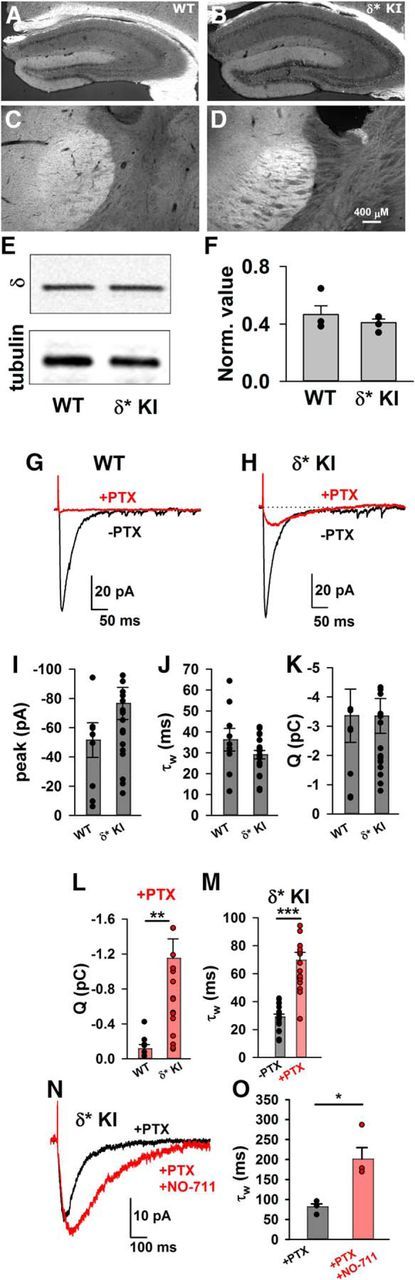
Similar pattern and quantity of δ subunit expression in WT and δ* KI mouse brains. A–D, Immunostains for δ subunit in hippocampus and thalamus from WT (A, C) and δ* KI (B, D) mice at P45. E, F, δ Protein levels were similar in WT and δ* KI hippocampus (n = 4 WT and 4 δ* KI samples, unpaired t test, p = 0.42). Protein levels were expressed relative to α-tubulin. G–O, Evoked IPSCs from WT and δ* KI slices. G, H, Evoked responses in the absence (black) and presence (red) of 100 μm PTX. Stimulus amplitude was set to the lowest level eliciting a reliable response. I–K, Summary of evoked IPSC parameters in the absence of PTX from WT and δ* KI cells (N = 9 WT cells from 4 animals and 19 δ* KI cells from 7 animals; unpaired t test, p = 0.17, 0.14, and 0.99). L, Postsynaptic charge (Q) measured in the presence of PTX from the same cells represented in I–K (unpaired t test, p = 0.004, **).M, IPSC decay τw from δ* KI cells before/after PTX application (N = 19 δ* KI cells from 7 animals; paired t test, p = 1.5 × 10⁻⁶, ***). N, Left, Effect of 10 μm NO-711 perfusion on average evoked IPSC waveform in δ* KI animals in the presence of 100 μm PTX. O, Summary of effect of NO-711 on τw of PTX-isolated IPSCs (N = 4 cells from 2 animals; paired t test, p = 0.018, *).
To verify previous suggestions of weak δ contributions to evoked IPSCs in DGCs (Wei et al., 2003), we examined IPSCs stimulated with weak electrical stimulation, which evoked IPSCs with comparable sizes to sIPSCs, to limit GABA spillover and pooling at extrasynaptic receptors. In the absence of PTX, there was no detectable difference in evoked transmission between WT and δ* KI cells (Fig. 2G–K; peak: t(26) = 1.4, p = 0.17, unpaired t test; decay: t(26) = 1.52, p = 0.14, unpaired t test; Q: t(26) = 0.009, p = 0.99, unpaired t test), again indicating that the genetic manipulation did not cause changes to GABA transmission in the absence of PTX. In WT slices, evoked IPSCs were abolished by 100 μm PTX. By contrast, in δ* KI slices a portion of evoked IPSCs persisted in the presence of PTX (Fig. 2H,L,M; Q: t(26) = 3.12, p = 0.004, unpaired t test). Evoked IPSCs in δ* KI slices exhibited much slower decay kinetics after PTX application (decay: t(18) = 7, p = 1.5 × 10⁻⁶, paired t test), representing direct identification of the δ component previously inferred from subunit deletion studies in DGCs (Wei et al., 2003) and other cell types, such as somatosensory thalamocortical cells (Herd et al., 2013). These previous studies have demonstrated that the δ component of transmission is particularly sensitive to GABA uptake inhibition, consistent with transmitter rebinding or spillover. Indeed, we found that evoked IPSCs from δ* KI cells in the presence of PTX were prolonged by 10 μm NO-711 (Fig. 2N,O; decay: t(3) = 4.76, p = 0.018, paired t test).
We also evaluated the contribution of δ receptors in another cell type, thalamocortical neurons, which, like DGCS, are rich in α4/δ subunits. Previously, positive allosteric modulator potentiation and effects of deletion of the α4 partner subunit have suggested that δ receptors contribute to ventrobasal thalamocortical IPSCs (Herd et al., 2013). Other studies have failed to find a δ receptor component of dorsal thalamocortical IPSCs (Ye et al., 2013). Notably, sensitivity to positive allosteric modulators may artificially amplify the δ contribution and recruit receptors not normally activated. We found that WT, heterozygote (δ*+/−) and δ* KI ventrobasal thalamocortical cells displayed robust THIP-gated current, which was completely blocked by PTX in both WT and δ*+/− but persisted in δ* KI cells, demonstrating the expected PTX insensitivity of δ* receptors (Fig. 3A–C; WT vs δ* KI PTX current: t(9) = 4.51, p = 0.001, unpaired t test), also verifying ample δ receptors in WT, δ*+/−, and δ* KI cells. However, the PTX-insensitive component of IPSC charge in δ* KI cells was larger than that of WT or δ*+/− neurons (Fig. 3D–F; δ% IPSC charge: t(14) = 2.96, p = 0.01, unpaired t test), and δ contribution to peak IPSC amplitudes did not differ from WT or δ*+/− (7.6 ± 2.6% for WT and δ*+/−, and 7.4 ± 1.5% for δ* cells. t(14) = 0.075, p = 0.94). Together, results from DGCs and thalamocortical neurons suggest that the contribution of δ to IPSCs can differ by cell type and brain region.
Figure 3.

Validation of δ expression and picrotoxin resistance in thalamacortical cells from δ* KI slices. A, B, 1 μm THIP induced a δ current that was sensitive to PTX in WT cells but resistant to PTX in δ* KI cells. C, Quantification of current changes relative to baseline in THIP, PTX, and gabazine. THIP-induced current was strongly inhibited in WT and heterozygote (δ*+/−) cells, but persisted in δ* KI cells (N = 2 WT cells from 2 animals, 2 δ*+/− cells from 1 animal, and 7 δ* KI cells from 3 animals; p = 0.001, **). Responses from the heterozygote were indistinguishable from WT so pooled here. D, E, Evoked IPSCs in the absence (black) and presence (red) of PTX in WT or δ* KI cells. F, Postsynaptic charge measured in the presence of PTX was normalized to baseline (before PTX application) to quantify percentage of the PTX insensitive component in grouped WT and δ*+/− cells, and in δ* KI cells. Comparison of the PTX insensitive current reveals a larger PTX insensitive component in δ* KI cells, suggesting involvement of δ receptors in evoked IPSCs (N = 6 WT cells from 2 animals, 3 δ*+/− cell from 1 animal, and 7 δ* KI cells from 3 animals; p = 0.01, *).
The localization of δ receptors to perisynaptic or extrasynaptic regions in DGCs might predict that recruitment of more presynaptic fibers will enhance spillover (Korn and Dingledine, 1986; Isaacson et al., 1993) and increase the proportional contribution of δ receptors to IPSCs. We examined this possibility by systematically increasing stimulus intensity to generate full input/output curves for evoked IPSCs (Fig. 4A,B). Interestingly, the δ receptor contribution to peak IPSC did not increase with stimulation intensity and in fact fell between weak and strong stimulation (Fig. 4C; F(1.73,10.37) = 7.33, p = 0.012, ANOVA; t(6) = 3.79, p = 0.027, Bonferroni corrected t test). On the other hand, the decay of the PTX-insensitive δ component slowed with stimulus intensity (Fig. 4D, bottom; F(1.57,9.41) = 68.34, p = 4.4 × 10⁻⁶, ANOVA; low vs mid: t(6) = 5.98, p = 0.003; mid vs high: t(6) = 7.62, p = 0.0008; low vs high: t(6) = 9.9, p = 0.0002; Bonferroni corrected t test) leading to no overall change in δ contribution to IPSC charge (Fig. 4C, bottom; F(1.61,9.66) = 0.39, p = 0.64, ANOVA). The increased decay of δ IPSCs is consistent with the idea that spread of transmitter and/or rebinding of receptors increases with additional fiber recruitment. Time to peak IPSC, however, decreased between weak and strong stimulation (Fig. 4E; F(1.10,6.59) = 7.26, p = 0.03, ANOVA; t(6) = 3.71, p = 0.03, Bonferroni corrected t test), consistent with the stronger δ contribution to peak IPSC at weak stimulus intensity (Fig. 4C).
Weak δ contributions to sIPSCs and mIPSCs
Some previous studies have used selective pharmacological potentiation to test the role of δ receptors in spontaneous transmission (Vardya et al., 2012; Ye et al., 2013). Caveats with pharmacological potentiation include artificial amplification of receptor contribution and possible nonselectivity. Here, we isolated spontaneous transmission driven purely by δ receptors. To explore δ receptor contributions to spontaneous transmission, we examined sIPSCs, which are driven by a combination of spontaneous action potentials and spontaneous vesicle fusion events, in WT versus δ* KI slices. Compared with evoked IPSCs, sIPSCs are nearly assured of being driven by no more than a single axon. In the absence of PTX, the peak amplitude, rise time, and decay kinetics of sIPSCs were indistinguishable in δ* KI slices compared with sibling WT slices (Fig. 5A–F; cumulative probability: p = 0.63, Kolmogorov–Smirnov test; rise time: t(14) = 1.35, p = 0.2, unpaired t test; decay fast: t(14) = 0.47, p = 0.65, unpaired t test; decay slow: t(14) = 0.081, p = 0.94, unpaired t test; fraction fast: t(14) = 0.35, p = 0.73, unpaired t test), supporting the preliminary analysis in Figure 1. Both genotypes exhibited similar rise times and bi-exponential decay kinetics, including similar proportions of fast and slow decay components (Fig. 5D–F). In the absence of PTX, sIPSCs from δ* KI cells showed minimal or no prolongation by 10 μm NO-711 (Fig. 5G–I; decay: t(7) = 0.44, p = 0.67, paired t test), consistent with observations of others in WT mice (Overstreet and Westbrook, 2003), suggesting that γ2-dominated IPSCs are characterized by very local GABA interaction with synaptic receptors.
Figure 5.

Similar characteristics of baseline sIPSCs in WT and δ* KI mouse brain slices. A–F, sIPSCs in the absence of PTX from WT and δ* KI animals. A, B, Representative sIPSCs from the indicated genotypes. C, Cumulative probability plot of event amplitudes from the two genotypes (N = 560 events in each curve from 8 cells with ≥70 events from 3 animals each for WT and δ* KI). The first 70 events were analyzed from each cell. Six cells were excluded on the basis of <70 events. D, Averaged waveforms (≥173 events each) from representative WT and δ* KI cells (black and red, respectively) are shown superimposed with a bi-exponential fit (gray trace). E, Ten to 90% rise time summary of sIPSCs in the absence of PTX from WT (black) and δ* KI (red). Unpaired t test revealed no difference between groups (p = 0.2). F, Summary of fast and slow time constants and relative contribution of the fast component (right plot) for WT (black) and δ* KI (red) as indicated. No differences were found (N = 8 WT and 8 δ* KI cells, 3 animals for each genotype; unpaired t test, p = 0.65, 0.94 and 0.73). G–I, Effect of 10 μm NO-711 on parameters of IPSCs in δ* KI DGCs. This dataset showed neither a change in peak amplitude nor of decay τw (N = 8 δ* KI cells from 2 animals, p = 0.19 and 0.67, paired t test).
In the presence of PTX, the apparent frequency of sIPSCs strongly decreased, from 6.4 ± 0.8 Hz in the absence of PTX to 0.08 ± 0.009 Hz in PTX (N = 13 δ* KI cells). If the small number of remaining events results from GABA release onto PTX-insensitive δ receptors, we expect that the events should be sensitive to uptake inhibition by NO-711. Indeed, the PTX insensitive population of presumed sIPSCs was sensitive to NO-711 and blocked by gabazine (Fig. 6). NO-711 increased both rise time and decay of sIPSCs, consistent with increased transmitter spread and/or rebinding (Fig. 6F,G; rise time: t(12) = 2.2, p = 0.048, paired t test; decay: t(12) = 3.29, p = 0.006, paired t test). Overall these results are consistent with previous work with genetic deletions and suggest that transmitter spillover augments δ-mediated sIPSCs. We conclude that there is sufficient δ subunit present near at least some synapses to produce phasic, single-axon IPSCs even in the absence of uptake inhibition. Thus, our results positively identify δ-mediated IPSCs, with characteristics consistent with those expected of δ-mediated IPSCs from genetic deficiencies and from positive allosteric modulators.
Figure 6.

Characteristics of δ-mediated sIPSCs obtained in the presence of 100 μm PTX. A, PTX-isolated sIPSCs in δ* KI slice. The black traces represent slow sweeps. NO-711 was used at 10 μm and gabazine at 100 μm. The green and purple horizontal bars above the traces indicate color-matched regions shown in insets below the traces at higher temporal resolution. Five sequential sIPSCs from each condition are shown below the traces in gray. B, Similar representative regions from a WT slice in PTX. C, Average waveforms of PTX-isolated sIPSCs in a δ* KI slice before and during incubation in NO-711 (21 events for “+ PTX”; 28 events for “+PTX+NO-711”, same cell as A). D–G, NO-711 caused a significant increase in each of the indicated parameters of PTX-isolated δ sIPSC (paired t test, p = 0.02*, 0.002**, 0.048*, and 0.006**, respectively; N = 13 cells from 5 animals; one additional cell was excluded from analysis on the basis of only 2 events at baseline).
The results of Figure 6 demonstrate that δ-containing receptors can be recruited by GABA release from single axons. However, the results leave open the possibility that δ IPSCs occur only when action potentials trigger release of more than one vesicle per active zone or release from several terminals of the same axon synchronously. If δ receptor IPSCs are also evident under conditions of single-vesicle release, this would demonstrate that at least some δ receptors are within reach of single quanta and thus do not require interactions among vesicles for activation. To explore this, we examined baseline (−PTX) and PTX-isolated single-vesicle, spontaneous mIPSCs in the presence of TTX in δ* KI slices. Similar to sIPSCs, PTX-isolated, δ-mediated mIPSCs were evident, but at lower apparent frequency than the γ2-dominated mIPSCs observed in the absence of PTX (Fig. 7A–I; frequency: t(9) = 5.4, p = 0.0004, paired t test). The average (mean) amplitude of pre-PTX mIPSCs (γ2 dominated) was larger than that of δ mIPSCs isolated by PTX (Fig. 7B–F; peak: t(9) = 4.93, p = 0.0008, paired t test). Median amplitudes before and after PTX revealed similar results (−22.6 ± 3.9 pA before PTX, −6.9 ± 0.4 pA after PTX; t(9) = 4.07, p = 0.003, paired t test). PTX-resistant mIPSCs did not represent incompletely blocked γ2-mediated mIPSCs because subsaturating concentrations of PTX speed the decay of IPSCs (Yoon et al., 1993; Eisenman et al., 2003), and this was not evident in our experiments. In fact rise times of presumed δ mIPSCs were slower than γ2-dominated mIPSCs obtained in the absence of PTX, but the decay time constant of presumed δ mIPSCs did not differ from the larger (γ2-driven) mIPSCs in the absence of PTX (Fig. 7G,H; decay: t(9) = 1.45, p = 0.18, paired t test; rise time: t(9) = 3.54, p = 0.006, paired t test). Further supporting the idea that events in the presence of PTX represented δ-mediated mIPSCs, DS2 prolonged decays of PTX-isolated δ mIPSCs (10.97 ± 0.30 ms baseline, vs 15.09 ± 0.75 ms DS2, t(4) = 5, p = 0.008, paired t test, N = 5 cells from 3 animals).
Figure 7.

Characteristics of δ-mediated mIPSCs obtained in the presence of 1 μm TTX. A, Representative traces from a δ* KI cell in the indicated conditions. B–D, Representative mIPSCs and peak distribution histograms from WT and δ* KI cells. B, C, Twenty successive events from a WT cell and a δ* KI cell in the absence of PTX. D, Twenty events from the same δ* KI cell as in C, after PTX application. The histograms below each set of traces shows the entire mIPSC peak distribution for the cells (206, 168, and 20 events respectively). E, Representative average waveform for mIPSCs before and during 100 μm PTX application. The black trace represents average waveform of all non-overlapping mIPSCs in a δ* KI cell before PTX application (N = 168 events over 3 min). The red trace indicates PTX-isolated events from the same cell (N = 20 events over 3 min). F–I, Average parameters from δ* KI cells (N = 10 cells from 4 animals). F, Inset, The cumulative amplitude probability plot for events obtained in the presence of PTX (10 events per cell for the cells shown in C). The total number of events per cell ranged from 37 to 645 in the absence of PTX and from 10 to 42 in the presence of PTX. Both peak amplitude and frequency were significantly reduced in PTX (paired t test, p = 0.0008 and 0.0004, respectively). Rise time but not decay time constant was significantly slowed in PTX (paired t test, p = 0.006 and 0.18, respectively). J, Representative average waveform for PTX-isolated mIPSCs before and during 10 μm NO-711 application. Black: before NO-711; N = 87 events over 5 min. Purple: in NO-711; N = 240 events over 5 min). K–M, Comparison of mean peak amplitude, 10–90% rise time and τw of PTX-isolated mIPSCs before/after NO-711 application from δ* KI cells. Peak amplitude, but not rise time or decay τw, was significantly increased in NO-711 (N = 8 cells from 3 animals; paired t test, p = 0.0002, 0.99, and 0.2, respectively). The total number of events per condition ranged from 34 to 266.
To determine whether the faster decay of δ receptor mIPSCs is associated with less transmitter rebinding/diffusion than for sIPSCs, we evaluated the effect of NO-711 on TTX- and PTX-isolated mIPSCs in δ* KI slices. In contrast with sIPSCs and evoked IPSCs, NO-711 did not alter the rise or decay time constant but did increase mIPSC peak amplitude (Fig. 7J–M; rise time: t(7) = 0.018, p = 0.99, paired t test; decay: t(7) = 1.41, p = 0.203, paired t test; peak: t(7) = 6.85, p = 0.0002, paired t test). Comparison of median peak amplitude before and after NO-711 revealed similar results (−6.1 ± 0.3 pA before NO-711, −9.4 ± 0.6 pA after NO-711; t(7) = 7.16, p = 0.0002, paired t test). NO-711 insensitivity of the kinetics suggests that GABA from a single vesicle does not spread far enough or rebind receptors sufficiently to induce temporal expansion of phasic currents. To probe this point further, we directly compared peak amplitude and decay time constants of sIPSCs and mIPSCs (Fig. 8). For γ2-dominated IPSCs recorded in the absence of PTX, TTX application produced no change in either peak or decay time constant, suggesting quantal independence (Fig. 8A,B; peak: t(5) = 0.48, p = 0.65, paired t test; decay: t(5) = 0.31, p = 0.77, paired t test). However, in the presence of PTX, TTX induced smaller, faster δ events (Fig. 8C,D; peak: t(5) = 2.65, p = 0.045, paired t test; decay: t(5) = 2.85, p = 0.036, paired t test). These observations suggest that at small scales of release, δ contribution is graded with vesicular output, as might be expected from extrasynaptic localization.
Figure 8.

Changes to δ sIPSC versus mIPSC waveform. A, Representative average waveform for sIPSCs (black, n = 260 events) and mIPSCs (red, n = 305 events) from a δ* KI cell before PTX application. B, Comparison of τw and peak amplitude (Pk) between sIPSCs and mIPSCs before PTX application (N = 6 cells from 2 animals; paired t test, p = 0.77 and 0.65, respectively). C, Representative average waveform for sIPSCs (black, n = 74 events) and mIPSCs (red, n = 36 events) from a δ* KI cell in PTX. D, Comparison of τw and peak amplitude between sIPSCs and mIPSCs in PTX (N = 6 cells from 2 animals; paired t test, p = 0.036* and 0.045*, respectively).
Estimates of δ contribution to synaptic GABA responses
The preceding results suggest that δ receptors contribute a small amount to all forms of phasic inhibition, but the difference between δ sIPSCs and δ mIPSCs may suggest a graded contribution at different levels of release. We sought to quantify δ receptor contributions to the different ends of the spectrum of release. The contribution of δ receptors to evoked IPSCs is readily quantified as in Figures 2 and 4. Overall, we found that δ receptors contribute 16 ± 2% to peak evoked IPSCs (Fig. 9), obtained from comparing peak IPSC amplitude before PTX to peak amplitude following PTX application in δ* KI slices. We cannot derive a reliable quantitative estimate of δ contribution to sIPSCs because PTX-induced changes may not entirely result from direct postsynaptic inhibition at the recorded cell. If PTX alters the activity of interneurons, the amplitude and frequency of sIPSCs may yield misleading estimates of δ receptor contributions. However, simply comparing peak amplitudes yields an estimate of 11% contribution of δ receptors. In contrast to sIPSCs, mIPSCs arise from action potential independent release and should not be subject to these complicating effects of PTX. To estimate the contribution of δ receptors to mIPSCs, we assumed PTX has no effect on spontaneous vesicle release and that δ contributes evenly, on average, to all mIPSCs. A corollary is that the smallest events drop below detection without the γ2 component to “mark” the events, thereby resulting in the low apparent frequency. To estimate δ receptor contribution, we compared the average amplitude of events detected in the presence of PTX with the largest events of the same number (over an equivalent time period) in the pre-PTX condition (Stell and Mody, 2002). This “event matching” method estimated a δ contribution of 11 ± 2% for mIPSCs (Fig. 9A,B). This value was not statistically different from the estimate for evoked IPSCs (t(31) = 1.41, p = 0.17, unpaired t test).
Figure 9.

Estimates of δ contribution to mIPSCs and to evoked IPSCs. A, Average waveform for PTX-isolated mIPSCs (purple; N = 20 events) and the largest 20 pre-PTX events from a period of the same duration in the absence of PTX (black trace). B, Summary of estimates of relative δ contributions to mIPSCs and evoked IPSCs. The purple bar indicates results from the event-matching protocol described in A and in the Results, which matches all events in PTX to the largest events of the same number in the same amount of time (N = 10 cells from 4 animals; same animals as Fig. 5). The red bar represents estimates derived from peak amplitude of evoked IPSCs pre-PTX and post-PTX in δ* KI cells (N = 23 cells from 9 animals; same animals as Fig. 2; unpaired t test, p = 0.17).
Estimates of δ contribution to total granule-cell GABA current
Results thus far suggest that δ receptors make a clear but relatively minor contribution to evoked transmission, as also reported by others (Stell et al., 2003; Wei et al., 2003; Brickley and Mody, 2012; Herd et al., 2013; Ye et al., 2013). Moreover, we also demonstrated δ receptor-driven mIPSCs, which to our knowledge have not been observed previously without artificial pharmacological potentiation. The prevailing view is that the perisynaptic location of δ receptors accounts for the minor contribution to phasic inhibition, including evoked transmission. However, whether the perisynaptic localization truly limits the contribution of δ receptors to evoked IPSCs has not been experimentally tested. For instance, the high affinity of δ receptors could compensate for localization. A saturation effect at high-affinity δ receptors may help explain the decreasing contribution of δ receptors to peak evoked IPSC amplitude with increasing stimulus intensity (Fig. 4). Thus, an alternative hypothesis to explain the weak δ contribution to evoked transmission is that δ receptors are simply expressed at lower levels than γ2 receptors.
Our initial thought to test the overall contribution of δ receptor was to estimate whole-cell responsiveness to a saturating concentration of a GABAA agonist. Applying a saturating concentration directly is problematic because current amplitude will be influenced by receptor desensitization and shifts in chloride gradient. Therefore, we applied a low effective concentration and extrapolated maximum responses. We challenged DGCs with 0.5 μm muscimol, a broad-spectrum and weakly transported agonist (Lodge et al., 1978), which should reach all parts of the cell at full concentration. Muscimol generated a DGC current that was 69 ± 3% attributable to γ2 receptors and 31% attributable to δ receptors (Fig. 10A).
Figure 10.

Estimates of δ contribution to cell-wide GABA responses. A, Muscimol was applied to a DGC in a δ* KI slice, followed by 100 μm PTX application, as indicated. Inset, γ2-Dominated sIPSCs, which are not significantly occluded by muscimol application, reflecting the low relative activation achieved by 0.5 μm muscimol at γ2 receptors. B, After correction for the estimated EC value of muscimol at the two receptor types, as described in the Results, maximum whole-cell GABA current was estimated. Contribution of δ is estimated to be 10% of total GABA response cell wide (N = 6 cells from 2 δ* KI animals). C, I/O curve of iontophoretic GABA currents in δ* KI slices. Top, Representative iontophoretic GABA current traces from a δ* KI cell. A series of positive currents (0.5 ms), ranging from 10 to 950 nA with 20 nA increments and superimposed on a retaining current of −10 nA, was injected through the iontophoretic pipette to evoke increasing GABA currents in the dendrite of a DGC. Bottom, An I/O curve generated by normalizing peak amplitude of each iontophoretic current to the final current response. Red arrow indicates the response evoked by 900 nA current injection, an intensity selected for pharmacological block by PTX in D–E (N = 12 cells from 4 δ* KI animals). D, Representative examples of GABA iontophoresis in the indicated conditions for δ* KI cells (black, −PTX; red, +PTX). Each set of traces is from a different cell. A current/response curve was obtained for each cell as in C. Receptors containing γ2 clearly dominate cellular responses to saturating GABA. E, Left, Calculated δ contribution (%) to peak iontophoretic GABA currents from δ* KI cells (N = 6 somas/cells, 10 dendrites/cells from 4 animals). Peak amplitude to locally saturating GABA in the presence of PTX was normalized to the peak amplitude in the absence of PTX. Dashed lines mark δ percentage calculated from event-matched mIPSC (purple) and evoked IPSC (red; Fig. 7) for comparison. Right. Summary of decay kinetics of iontophoretic responses ±PTX from somas and dendrites of δ* KI cells (N = 6 somas/cells from 4 animals, paired t test, p = 0.024*; N = 10 dendrites/cells from 4 animals, unpaired t test, p = 0.007**).
To convert the responses to this low concentration to the maximal response to muscimol, we used published values for the EC50 and Hill coefficient for activation of recombinant receptors (You and Dunn, 2007): 6.17 μm and 0.93 for γ 2 and 1.08 μm and 0.93 for δ. These values suggest that the estimated maximal responses for γ2 and δ, shown in Figure 10B, would be 11.3-fold and 3.0-fold larger than the responses to 0.5 μm, respectively. Adjusting the observed relative responses by these factors provides estimates that the maximal response to activation of δ receptors would be 10% of the total [(0.3 × 3)/(0.3 × 3) + (0.7 × 11.3); Fig. 10B]. Using an alternative set of parameter values (Mortensen et al., 2010) gives an estimate of 15%. If the efficacies of muscimol at the two types of receptor are similar, these calculations predict that δ receptors can contribute 10–15% of the total functional response on these cells.
The above analysis relies on estimates of EC50 values for muscimol acting at recombinant γ2 and δ receptors. As a more direct verification of δ contributions to overall GABA responsiveness, we used iontophoresis to apply GABA locally at a saturating concentration (Müller and Remy, 2013) in the absence and presence of PTX (Fig. 10C,D). Because of the ability to achieve rapid, brief GABA application, this method minimizes the pitfalls of desensitization and chloride gradient shifts. We found that decay time constants of iontophoretic events were 56.7 ± 7.6 ms in somas and 47.1 ± 4.81 in dendrites in the absence of PTX, somewhat slower than mIPSCs but similar to the kinetics of evoked IPSCs (Fig. 10E). In the presence of PTX, decay time constants of the remaining events became larger, consistent with the idea that that these PTX-resistant events are mediated by δ (Fig. 10E; soma: t(5) = 3.2, p = 0.024, paired t test; dendrite: t(16) = 3.1, p = 0.007, unpaired t test; compare Fig. 2M). Figure 10C–E shows the results of δ contributions to iontophoretic responses. Although considerably variable, averages from the soma (6 ± 2%) and dendrites (11 ± 2%) of δ* KI cells were similar to estimates obtained from bath muscimol application (Fig. 10A,B). Moreover, δ contributions to total (synaptic + extrasynaptic) GABA current, estimated from the iontophoretic responses, are similar to the range of δ contributions to synaptic GABA responses (Figs. 10E, red and purple dashed lines, 9). Thus, two independent methods suggest small δ receptor contribution to total GABA responsivity. Overall, these results indicate that the functional contributions of δ-containing receptors to synaptically-evoked responses is comparable to their overall functional representation. There is no indication that that δ-containing receptors are functionally excluded from regions reached by synaptically released GABA at the peak of IPSCs. (Figs. 9, 10).
Contribution to phasic inhibition by δ subunit-containing receptors
Does the small contribution of δ receptors to IPSCs meaningfully contribute to inhibition? We addressed this question by comparing the impact of phasic and tonic δ-mediated inhibition on depolarization. To generate phasic inhibition we stimulated molecular layer inhibitory inputs in the presence of NBQX and D-APV to block recurrent glutamatergic activity. We first performed experiments by 'exciting' DGCs with artificial EPSPs (αEPSPs), using scaled sEPSC waveforms as the input in current-clamp recordings. Five EPSCs were injected at 50 Hz (Fig. 11A). The use of αEPSPs aided experimental control and interpretation by avoiding complications of presynaptic plasticity and changes in recurrent excitation with application of GABAR modulators. Unconditioned αEPSPs were compared with sweeps in which each αEPSP was preceded by 10 ms with synaptic stimulation to the inhibitory inputs. Figure 11, A1 and A2, shows that temporal summation was weakened by synaptic inhibition.
Figure 11.

Impact of phasic δ responses on inhibition of neuronal depolarization. We assessed the impact of presumed γ2 and δ receptors with successive application of 100 μm PTX and 100 μm gabazine in WT and δ* KI slices. A, In δ* KI slices, αEPSPs were generated by injecting a scaled EPSC waveform at 50 Hz, with different evoked stimulation and antagonist conditions, as indicated below the traces. The current driving the αEPSPs was adjusted to produce ≥6 mV of initial depolarization in the absence of inhibition. A2–A4, Inhibition was stimulated in the dentate molecular layer 10 ms before each EPSP. The insets show the resulting IPSCs in the indicated conditions, clamped at −40 mV. A potassium gluconate pipette solution was used for these αEPSP experiments to foster an inhibitory effect of GABAA receptor activation. All preceding experiments used CsCl pipette solution to provide strong driving force for GABAA currents at −70 mV. B, Summary of EPSP amplitude, showing that 100 μm PTX did not significantly reduce inhibition, but gabazine significantly abrogated the effect of evoked inhibition observed in PTX only and restored full EPSP summation. The peak amplitudes of the fifth αEPSP from the four conditions were compared pairwise for post hoc statistics (N = 11 cells from δ* KI slices obtained from 7 animals; one-way repeated-measures ANOVA with Bonferroni's multiple-comparisons test). The double asterisk (**) indicates gabazine versus baseline IPSP and gabazine versus PTX, adjusted p value = 0.008 and 0.003, respectively. PTX versus baseline IPSP did not reach statistical significance (adjusted p value = 0.93). C, Electrically evoked EPSPs in WT slices in the absence of NBQX at 50 Hz, with different antagonist conditions, as indicated below the traces. D, Summary of EPSP amplitudes, showing that both PTX and gabazine significantly abrogated the effect of evoked inhibition observed at baseline and increased EPSPs to similar levels. The peak amplitudes of the fifth EPSP were compared between all the conditions (N = 10 cells from WT slices obtained from 5 animals; one-way repeated-measures ANOVA with Bonferroni's multiple-comparisons test; adjusted p value = 0.006** for PTX vs baseline IPSP, and 0.009** for gabazine vs baseline IPSP). There was no difference between gabazine versus PTX conditions (adjusted p value = 0.85). E, Electrically evoked EPSPs in δ* KI slices in the absence of NBQX at 50 Hz, with different antagonist conditions, as indicated below the traces. F, Summary of EPSP summation, showing that 100 μm PTX did not significantly alter the fifth EPSP amplitude, but gabazine significantly increased the EPSP. The peak amplitudes of the fifth EPSP were compared among conditions (N = 8 cells from δ* KI slices obtained from 2 animals; one-way repeated-measures ANOVA with Bonferroni's multiple-comparisons test; adjusted p = 0.24 for PTX vs baseline IPSP, and 0.004** for gabazine vs baseline IPSP). G, In CsCl-filled δ* KI DGCs, 5 μm GABA, a concentration typically used in past studies of tonic-current (Lee and Maguire, 2014) gates a current that is only partly sensitive to PTX and fully blocked by gabazine. H, An I–V curve of GABAAR generated from 10 to 20 μm GABA-induced, gabazine-sensitive currents in δ* KI DGCs filled with Cs methanesulfonate. The resulting I–V relationship was outwardly-rectifying (N = 4 cells from 3 animals). I, GABA (5 μm) application to a potassium gluconate-filled cell had little effect on αEPSPs generated as in A. J, Summary of summation experiments, shown in the same format as B and D. N = 6 cells from δ* KI slices obtained from two animals. There was no significant impact of tonic GABA current on EPSP amplitudes (one-way repeated-measures ANOVA, p = 0.24).
We assessed the impact of presumed γ2 and δ receptors with successive application of 100 μm PTX and 100 μm gabazine in δ* KI slices to isolate the contributions of non-δ receptors and PTX-resistant, presumed δ GABAA receptors, respectively. Results in Figure 11A–B shows that PTX failed to alter inhibition, but gabazine strongly reduced inhibition in the same cells (Fig. 11A–B; F(1.72,17.23) = 18.32, p = 9.0 × 10⁻⁵, ANOVA; PTX vs IPSP: t(10) = 1.54, p = 0.93, Bonferroni corrected t test; gabazine vs PTX: t(10) = 5.14, p = 0.003, Bonferroni corrected t test). These results demonstrate that despite their low functional expression levels, δ receptors contribute substantially to accumulated phasic inhibition under conditions of appropriately timed excitatory–inhibitory interactions. EPSPs in the presence of gabazine were not altered compared with those in the absence of gabazine, confirming that tonic current in the absence of added GABA under our experimental conditions is not an important contributor to inhibition.
Although the αEPSP studies are instructive, they introduce artificial aspects, including the lack of an excitatory conductance change and depolarization of the soma instead of dendrites, where excitatory synapses are most prominent. To circumvent these shortcomings, we examined genuine evoked EPSPs/IPSPs in the absence of NBQX, with combined electrically evoked EPSP and IPSP combinations. Results using natural EPSPs showed similar overall effects as experiments using artificial EPSPs. In WT cells, PTX inhibited the entire set of receptors that were inhibited by gabazine, demonstrating that PTX indeed blocks all GABAA receptors under our experimental conditions (Fig. 11C–D; F(1.25,11.25) = 15.94, p = 0.0013, ANOVA; PTX vs IPSP: t(9) = 4.34, p = 0.0056, Bonferroni corrected t test; gabazine vs PTX: t(9) = 1.14, p = 0.85, Bonferroni corrected t test). By contrast, in δ* KI cells PTX failed to reduce inhibition at the end of a train of stimuli, whereas subsequent addition of gabazine increased EPSP amplitude similar to the effect of PTX in WT cells, consistent with the idea that δ receptors participate in phasic inhibition (Fig. 11E–F; F(1.24,8.65) = 25.04, p = 0.0006, ANOVA; PTX vs IPSP: t(7) = 2.04, p = 0.24, Bonferroni corrected t test; gabazine vs IPSP: t(7) = 5.12, p = 0.004, Bonferroni corrected t test). Together, these experiments demonstrate that electrically evoked δ inhibition (phasic inhibition) has a prominent role in in inhibiting EPSPs and limiting excitation in DGCs.
The experiments above showed no evidence that tonic current in the absence of added GABA inhibits αEPSPs. Some studies apply exogenous GABA to induce tonic current believed to mimic in vivo conditions (Lee and Maguire, 2014). Figure 11 shows that 5 μm GABA, a concentration routinely used to generate putatively physiologically relevant tonic current in DGCs (Glykys et al., 2008; Lee and Maguire, 2014), failed to affect αEPSPs (Fig. 11G,I–J; F(1.999,9.997) = 1.67, p = 0.24, ANOVA). One possible explanation is the high chloride-containing internal solution used to generate driving force for tonic current (Fig. 11G) results in linearization of GABAAR I–V relationship (Pavlov et al., 2009). On the other hand, when the low chloride-containing internal solution, which is considered more physiologically relevant, is being used, GABAAR exhibits a strongly outward-rectified current–voltage relationship (Pavlov et al., 2009). As expected, when we used low chloride internal solution to keep the GABAAR reversal potential negative, the gabazine-sensitive membrane conductance induced by 10–20 μm GABA was negligible at −70 mV compared with + 50 mV (Fig. 11H; N = 4 cells).
Discussion
GABAA receptors containing the δ subunit have important roles in seizure prevention, mood, and cognition (Maguire et al., 2005; Cope et al., 2009; Maldonado-Avilés et al., 2009; Feng et al., 2010; Macdonald et al., 2010; Whissell et al., 2015), and are a target of clinically important drugs (Rudolph and Möhler, 2006; Whissell et al., 2015). Here we demonstrate several new aspects of δ GABAA receptor signaling with likely import for their roles in normal brain function. First, we validate a new resource for investigating synaptic and circuit roles of δ receptors. Second, we unequivocally demonstrate δ receptor participation in IPSCs in DGCs. Third, we show that the quantitative contributions of δ receptors to IPSCs are limited by functional receptor expression in addition to being influenced by extrasynaptic/perisynaptic localization. Fourth, we quantify the contribution of δ receptors to IPSCs at different levels of transmitter output. Finally, we demonstrate a perhaps unexpectedly large impact of phasic δ receptor transmission on EPSPs. Thus, the establishment of the PTX-insensitive mouse line considerably deepens investigative power for studies of δ-containing receptors. Overall, our results revise prevailing explanations for weak δ contributions to IPSCs in DGCs and reveal the inhibitory impact of δ receptors during phasic inhibition.
Our work was based on the previous discovery that a single amino acid substitution at the 6′ position of any one of the five GABAA receptor subunits comprising a functional receptor will dramatically reduce PTX sensitivity without substantially altering other aspects of receptor function (Gurley et al., 1995; Shen et al., 1999; Sedelnikova et al., 2006; Erkkila et al., 2008). Further study will be needed to understand why this did not turn out to be so for the γ2* KI line. The non-steady-state conditions of synaptic activation may reveal differences in behavior of the receptors not evident in the previous studies, which used steady-state measurements in oocytes (Gurley et al., 1995). Alternatively, aspects of the native environment may interact with the γ2 mutation to alter baseline kinetics in ways that were not evident in previous studies. Our results (Figs. 1, 2, 5) support the idea that editing the δ gene locus to confer PTX insensitivity does not substantially alter receptor properties when δ* KI receptors are expressed in native cells under native promoters. THIP-induced currents as well as IPSCs are indistinguishable in WT and δ* KI mice before PTX application (Figs. 1, 2, 5). Thus, the δ* KI genetic model developed here should be useful in future studies of the contributions of δ receptors in additional aspects of inhibition and drug actions.
Although there is substantial range in our estimates of the contribution of δ receptors to the various phasic responses of DGCs, it is clear that the contribution to synaptic responses is not negligible compared with the δ receptor contribution to the whole-cell response. That is, our data do not support the idea that δ receptors are excluded from regions of the cell membrane that are rapidly reached by synaptically released GABA. Indeed, the estimated contribution to evoked IPSCs is at the upper end of estimates for the total cellular representation. The results indicate that both evoked and spontaneous δ IPSCs, which contain events resulting from presynaptic action potentials, exhibit increased amplitude and duration when GABA uptake is inhibited. This effect is consistent with concentrated δ receptors in the perisynaptic region where they can be accessed by the spike-triggered GABA concentration transient, and with a larger and longer response when uptake is inhibited. It is surprising that the δ mIPSCs seen in the combined presence of TTX and PTX have somewhat different properties: the decay time course is more rapid than evoked or spontaneous δ IPSCs, and it is not prolonged by uptake inhibition, although DS2 does potentiate δ receptor mIPSCs. One possibility is that more than one vesicle is often released during action potentials (multivesicular output; Lisman et al., 2007). The larger GABA concentration transient arising from more than one vesicle may lead to larger, slower sIPSCs and evoked IPSCs compared with single-vesicle mIPSCs (Figs. 2, 5–8). Another possibility is that the pool of vesicles participating in the generation of mIPSCs differs from the pool released by action potentials and may access a somewhat different set of postsynaptic receptors (Kavalali, 2015).
δ mIPSCs exhibited faster decay kinetics than δ sIPSCs and similar decay kinetics compared with those of γ2-dominated mIPSCs (Figs. 7G, 8). In heterologous expression systems, δ receptors exhibit faster deactivation than γ2 receptors (Haas and Macdonald, 1999), although in some studies δ receptors exhibit slow deactivation kinetics (Bright et al., 2011). It thus remains unclear whether δ-mediated mIPSCs represent responses to impulse-like synaptic GABA presentation or whether they, like evoked IPSCs, have a diffusional contribution. Regardless, the difference in kinetics among δ mIPSCs, sIPSCs, and evoked IPSCs appears to reflect a δ component that increases in duration with transmitter output. With evoked IPSCs, the diffusional/rebinding contribution of δ receptors increased with stimulus intensity, as measured by decay time of δ IPSCs (Fig. 4D). It is possible that the decrease in time to peak IPSC and δ contribution to peak IPSC amplitude with increasing stimulus intensity (Fig. 4C,E) are explained by the complicated interplay among diffusion/rebinding, receptor localization, and GABA uptake.
Our results suggest that the small contribution of δ receptors to evoked IPSCs arises from low functional expression, and the small contribution to evoked transmission is not solely determined by selective extrasynaptic localization. Functional expression includes the number of surface receptors, the efficacy of the receptors for GABA, and single-channel conductance. Single-channel conductance for the two receptor classes is similar (Mortensen et al., 2010). However, muscimol and GABA are both partial agonists at δ receptors (Brown et al., 2002; Wohlfarth et al., 2002; Akk et al., 2004; You and Dunn, 2007; Mortensen et al., 2010; Eaton et al., 2014). THIP is generally considered to be a full agonist and produces maximal current ∼35–100% larger than GABA acting at δ receptors (Brown et al., 2002; You and Dunn, 2007; Mortensen et al., 2010). Thus, efficacy can account only partially for the weak contribution of δ receptors to maximum overall GABA current, and it appears that a paucity of surface δ receptors relative to γ2 receptors is the main driver of weak δ contributions.
Despite the small contribution to peak IPSCs, δ receptors contribute substantially to total charge transfer and therefore to inhibition generated by IPSPs (Fig. 11). Overlapping decays of δ receptor IPSPs during short trains of stimuli increase the impact further. These observations suggest that phasic inhibition should be accounted for when considering mechanisms of drugs that target δ receptors (Whissell et al., 2015).
The knock-in/chemogenetic approach offered unprecedented sensitivity to parse the role of δ receptors in tonic versus phasic inhibition. Under basal conditions, we found little evidence for tonic current, and even with the addition of 5 μm GABA the impact of tonic inhibition on EPSP-like depolarization was minimal (Fig. 11). The strong outward rectification of GABAA receptors, especially under conditions of low intracellular chloride (Pavlov et al., 2009), likely contributes to weak tonic inhibition (Fig. 11). GABA receptor outward rectification has two sources. First, there is inherent voltage dependence to the gating of receptors at low [GABA] (Weiss, 1988). Second, Goldman–Hodgkin–Katz rectification will reduce current flow at negative membrane potentials when intracellular [Cl−] is low (Hille, 2001). The sum of these two sources of rectification will cause minimal current to flow at negative Vm and will conspire to limit the inhibitory influence of tonic current (Pavlov et al., 2009). A plethora of factors will affect tonic GABA levels in vitro and in vivo (Bright et al., 2014). The many unknowns make it difficult to discern definitively how strongly tonic current will contribute to δ receptor inhibition in various physiological conditions. Past analyses have shown that the ongoing nature of even very small tonic current can be important (Mitchell and Silver, 2003), but our results (Fig. 11) suggest that phasic δ receptor IPSCs are a largely overlooked but important inhibitory influence.
In summary, we have used gene editing to facilitate pharmacological isolation of a mysterious GABAA receptor class in native neurons in situ. The sensitivity of the technique revealed a small yet consistent δ receptor contribution to peak IPSCs and allowed insight into the potential importance of δ-mediated phasic inhibition. Our results reorient attention away from widespread attention on tonic inhibition to the potential importance of δ receptors for phasic inhibition, which has remained largely unappreciated. This cellular contribution could be the basis for the important roles that δ receptors play in mood, cognition, and other aspects of brain function and dysfunction.
Footnotes
This work was supported in part by the Hope Center Transgenic Vectors Core and the Mouse Genetics Core at Washington University School of Medicine; NIH MH111461, MH104506, GM108580; the Bantly Foundation; and the Center for the Investigation of Membrane Excitability Diseases at Washington University (Grant CIMED-17-03). We thank Dr. Werner Sieghart for δ subunit antibody.
C.F.Z. is on the scientific advisory board of Sage Therapeutics. Sage Therapeutics was not involved in the design or funding of this study. The remaining authors declare no competing financial interests.
References
- Akk G, Bracamontes J, Steinbach JH (2004) Activation of GABAA receptors containing the α4 subunit by GABA and pentobarbital. J Physiol 556:387–399. 10.1113/jphysiol.2003.058230 [DOI] [PMC free article] [PubMed] [Google Scholar]
- Belelli D, Peden DR, Rosahl TW, Wafford KA, Lambert JJ (2005) Extrasynaptic GABAA receptors of thalamocortical neurons: a molecular target for hypnotics. J Neurosci 25:11513–11520. 10.1523/JNEUROSCI.2679-05.2005 [DOI] [PMC free article] [PubMed] [Google Scholar]
- Brickley SG, Mody I (2012) Extrasynaptic GABAA receptors: their function in the CNS and implications for disease. Neuron 73:23–34. 10.1016/j.neuron.2011.12.012 [DOI] [PMC free article] [PubMed] [Google Scholar]
- Bright DP, Renzi M, Bartram J, McGee TP, MacKenzie G, Hosie AM, Farrant M, Brickley SG (2011) Profound desensitization by ambient GABA limits activation of delta-containing GABAA receptors during spillover. J Neurosci 31:753–763. 10.1523/JNEUROSCI.2996-10.2011 [DOI] [PMC free article] [PubMed] [Google Scholar]
- Bright D, Houston C, Brickley S (2014) Sources of GABA that activate extrasynaptic GABAA receptors. In: Extrasynaptic GABAA Receptors (Errington AC, Di Giovanni G, Crunelli V, eds), pp 85–124. New York: Springer. [Google Scholar]
- Brown N, Kerby J, Bonnert TP, Whiting PJ, Wafford KA (2002) Pharmacological characterization of a novel cell line expressing human α4β3δ GABAA receptors. Br J Pharmacol 136:965–974. 10.1038/sj.bjp.0704795 [DOI] [PMC free article] [PubMed] [Google Scholar]
- Clements JD, Bekkers JM (1997) Detection of spontaneous synaptic events with an optimally scaled template. Biophys J 73:220–229. 10.1016/S0006-3495(97)78062-7 [DOI] [PMC free article] [PubMed] [Google Scholar]
- Cope DW, Hughes SW, Crunelli V (2005) GABAA receptor-mediated tonic inhibition in thalamic neurons. J Neurosci 25:11553–11563. 10.1523/JNEUROSCI.3362-05.2005 [DOI] [PMC free article] [PubMed] [Google Scholar]
- Cope DW, Di Giovanni G, Fyson SJ, Orbán G, Errington AC, Lorincz ML, Gould TM, Carter DA, Crunelli V (2009) Enhanced tonic GABAA inhibition in typical absence epilepsy. Nat Med 15:1392–1398. 10.1038/nm.2058 [DOI] [PMC free article] [PubMed] [Google Scholar]
- Dengler CG, Coulter DA (2016) Normal and epilepsy-associated pathologic function of the dentate gyrus. Prog Brain Res 226:155–178. 10.1016/bs.pbr.2016.04.005 [DOI] [PMC free article] [PubMed] [Google Scholar]
- Eaton MM, Bracamontes J, Shu HJ, Li P, Mennerick S, Steinbach JH, Akk G (2014) Gamma-aminobutyric acid type A α4, β2, and δ subunits assemble to produce more than one functionally distinct receptor type. Mol Pharmacol 86:647–656. 10.1124/mol.114.094813 [DOI] [PMC free article] [PubMed] [Google Scholar]
- Eisenman LN, He Y, Fields C, Zorumski CF, Mennerick S (2003) Activation-dependent properties of pregnenolone sulfate inhibition of GABAA receptor-mediated current. J Physiol 550:679–691. 10.1113/jphysiol.2003.043810 [DOI] [PMC free article] [PubMed] [Google Scholar]
- Erkkila BE, Sedelnikova AV, Weiss DS (2008) Stoichiometric pore mutations of the GABAAR reveal a pattern of hydrogen bonding with picrotoxin. Biophys J 94:4299–4306. 10.1529/biophysj.107.118455 [DOI] [PMC free article] [PubMed] [Google Scholar]
- Feng Y, Kapornai K, Kiss E, Tamás Z, Mayer L, Baji I, Daróczi G, Benák I, Kothencné VO, Dombovári E, Kaczvinszk E, Besnyő M, Gádoros J, Székely J, Kovacs M, Vetró Á, Kennedy JL, Barr CL (2010) Association of the GABRD gene and childhood-onset mood disorders. Genes Brain Behav 9:668–672. 10.1111/j.1601-183X.2010.00598.x [DOI] [PMC free article] [PubMed] [Google Scholar]
- Glykys J, Mann EO, Mody I (2008) Which GABAA receptor subunits are necessary for tonic inhibition in the hippocampus? J Neurosci 28:1421–1426. 10.1523/JNEUROSCI.4751-07.2008 [DOI] [PMC free article] [PubMed] [Google Scholar]
- Gurley D, Amin J, Ross PC, Weiss DS, White G (1995) Point mutations in the M2 region of the alpha, beta, or gamma subunit of the GABAA channel that abolish block by picrotoxin. Receptors Channels 3:13–20. [PubMed] [Google Scholar]
- Haas KF, Macdonald RL (1999) GABAA receptor subunit gamma2 and delta subtypes confer unique kinetic properties on recombinant GABAA receptor currents in mouse fibroblasts. J Physiol 514:27–45. 10.1111/j.1469-7793.1999.027af.x [DOI] [PMC free article] [PubMed] [Google Scholar]
- Herd MB, Brown AR, Lambert JJ, Belelli D (2013) Extrasynaptic GABAA receptors couple presynaptic activity to postsynaptic inhibition in the somatosensory thalamus. J Neurosci 33:14850–14868. 10.1523/JNEUROSCI.1174-13.2013 [DOI] [PMC free article] [PubMed] [Google Scholar]
- Hille B. (2001) Ion channels of excitable membranes, Ed 3 Sunderland, MA: Sinauer. [Google Scholar]
- Hoestgaard-Jensen K, Dalby NO, Wolinsky TD, Murphey C, Jones KA, Rottländer M, Frederiksen K, Watson WP, Jensen K, Ebert B (2010) Pharmacological characterization of a novel positive modulator at α4β3δ-containing extrasynaptic GABAA receptors. Neuropharmacology 58:702–711. 10.1016/j.neuropharm.2009.12.023 [DOI] [PubMed] [Google Scholar]
- Hollrigel GS, Soltesz I (1997) Slow kinetics of miniature IPSCs during early postnatal development in granule cells of the dentate gyrus. J Neurosci 17:5119–5128. 10.1523/JNEUROSCI.17-13-05119.1997 [DOI] [PMC free article] [PubMed] [Google Scholar]
- Holter NI, Zylla MM, Zuber N, Bruehl C, Draguhn A (2010) Tonic GABAergic control of mouse dentate granule cells during postnatal development. Eur J Neurosci 32:1300–1309. 10.1111/j.1460-9568.2010.07331.x [DOI] [PubMed] [Google Scholar]
- Isaacson JS, Solís JM, Nicoll RA (1993) Local and diffuse synaptic actions of GABA in the hippocampus. Neuron 10:165–175. 10.1016/0896-6273(93)90308-E [DOI] [PubMed] [Google Scholar]
- Jensen ML, Wafford KA, Brown AR, Belelli D, Lambert JJ, Mirza NR (2013) A study of subunit selectivity, mechanism and site of action of the delta selective compound 2 (DS2) at human recombinant and rodent native GABA(A) receptors. Br J Pharmacol 168:1118–1132. 10.1111/bph.12001 [DOI] [PMC free article] [PubMed] [Google Scholar]
- Jia F, Pignataro L, Schofield CM, Yue M, Harrison NL, Goldstein PA (2005) An extrasynaptic GABAA receptor mediates tonic inhibition in thalamic VB neurons. J Neurophysiol 94:4491–4501. 10.1152/jn.00421.2005 [DOI] [PubMed] [Google Scholar]
- Kavalali ET. (2015) The mechanisms and functions of spontaneous neurotransmitter release. Nat Rev Neurosci 16:5–16. 10.1038/nrn3875 [DOI] [PubMed] [Google Scholar]
- Korn SJ, Dingledine R (1986) Inhibition of GABA uptake in the rat hippocampal slice. Brain Res 368:247–255. 10.1016/0006-8993(86)90568-8 [DOI] [PubMed] [Google Scholar]
- Lee CY, Liou HH (2013) GABAergic tonic inhibition is regulated by developmental age and epilepsy in the dentate gyrus. Neuroreport 24:515–519. 10.1097/WNR.0b013e32836205bc [DOI] [PubMed] [Google Scholar]
- Lee V, Maguire J (2014) The impact of tonic GABAA receptor-mediated inhibition on neuronal excitability varies across brain region and cell type. Front Neural Circuits 8:3. 10.3389/fncir.2014.00003 [DOI] [PMC free article] [PubMed] [Google Scholar]
- Lisman JE, Raghavachari S, Tsien RW (2007) The sequence of events that underlie quantal transmission at central glutamatergic synapses. Nat Rev Neurosci 8:597–609. 10.1038/nrn2191 [DOI] [PubMed] [Google Scholar]
- Lodge D, Curtis DR, Johnston GA (1978) Does uptake limit the action of GABA agonists in vivo? Experiments with muscimol, isoguvacine and THIP in cat spinal cord. J Neurochem 31:1525–1528. 10.1111/j.1471-4159.1978.tb06580.x [DOI] [PubMed] [Google Scholar]
- Macdonald RL, Kang JQ, Gallagher MJ (2010) Mutations in GABAA receptor subunits associated with genetic epilepsies. J Physiol 588:1861–1869. 10.1113/jphysiol.2010.186999 [DOI] [PMC free article] [PubMed] [Google Scholar]
- Maguire JL, Stell BM, Rafizadeh M, Mody I (2005) Ovarian cycle-linked changes in GABAA receptors mediating tonic inhibition alter seizure susceptibility and anxiety. Nat Neurosci 8:797–804. 10.1038/nn1469 [DOI] [PubMed] [Google Scholar]
- Maldonado-Avilés JG, Curley AA, Hashimoto T, Morrow AL, Ramsey AJ, O'Donnell P, Volk DW, Lewis DA (2009) Altered markers of tonic inhibition in the dorsolateral prefrontal cortex of subjects with schizophrenia. Am J Psychiatry 166:450–459. 10.1176/appi.ajp.2008.08101484 [DOI] [PMC free article] [PubMed] [Google Scholar]
- Martenson JS, Yamasaki T, Chaudhury NH, Albrecht D, Tomita S (2017) Assembly rules for GABAA receptor complexes in the brain. eLife 6:e30826. 10.7554/eLife.27443 [DOI] [PMC free article] [PubMed] [Google Scholar]
- Meera P, Wallner M, Otis TS (2011) Molecular basis for the high THIP/gaboxadol sensitivity of extrasynaptic GABAA receptors. J Neurophysiol 106:2057–2064. 10.1152/jn.00450.2011 [DOI] [PMC free article] [PubMed] [Google Scholar]
- Mitchell SJ, Silver RA (2003) Shunting inhibition modulates neuronal gain during synaptic excitation. Neuron 38:433–445. 10.1016/S0896-6273(03)00200-9 [DOI] [PubMed] [Google Scholar]
- Mortensen M, Ebert B, Wafford K, Smart TG (2010) Distinct activities of GABA agonists at synaptic- and extrasynaptic-type GABAA receptors. J Physiol 588:1251–1268. 10.1113/jphysiol.2009.182444 [DOI] [PMC free article] [PubMed] [Google Scholar]
- Müller C, Remy S (2013) Fast micro-iontophoresis of glutamate and GABA: A useful tool to investigate synaptic integration. J Vis Exp 77:e50701. 10.3791/50701 [DOI] [PMC free article] [PubMed] [Google Scholar]
- Nusser Z, Sieghart W, Somogyi P (1998) Segregation of different GABAA receptors to synaptic and extrasynaptic membranes of cerebellar granule cells. J Neurosci 18:1693–1703. 10.1523/JNEUROSCI.18-05-01693.1998 [DOI] [PMC free article] [PubMed] [Google Scholar]
- Overstreet LS, Westbrook GL (2003) Synapse density regulates independence at unitary inhibitory synapses. J Neurosci 23:2618–2626. 10.1523/JNEUROSCI.23-07-02618.2003 [DOI] [PMC free article] [PubMed] [Google Scholar]
- Pavlov I, Savtchenko LP, Kullmann DM, Semyanov A, Walker MC (2009) Outwardly rectifying tonically active GABAA receptors in pyramidal cells modulate neuronal offset, not gain. J Neurosci 29:15341–15350. 10.1523/JNEUROSCI.2747-09.2009 [DOI] [PMC free article] [PubMed] [Google Scholar]
- Peng Z, Hauer B, Mihalek RM, Homanics GE, Sieghart W, Olsen RW, Houser CR (2002) GABAA receptor changes in δ subunit-deficient mice: altered expression of α4 and γ2 subunits in the forebrain. J Comp Neurol 446:179–197. 10.1002/cne.10210 [DOI] [PubMed] [Google Scholar]
- Rudolph U, Möhler H (2006) GABA-based therapeutic approaches: GABAA receptor subtype functions. Curr Opin Pharmacol 6:18–23. 10.1016/j.coph.2005.10.003 [DOI] [PubMed] [Google Scholar]
- Sedelnikova A, Erkkila BE, Harris H, Zakharkin SO, Weiss DS (2006) Stoichiometry of a pore mutation that abolishes picrotoxin-mediated antagonism of the GABAA receptor. J Physiol 577:569–577. 10.1113/jphysiol.2006.120287 [DOI] [PMC free article] [PubMed] [Google Scholar]
- Shen W, Mennerick S, Zorumski EC, Covey DF, Zorumski CF (1999) Pregnenolone sulfate and dehydroepiandrosterone sulfate inhibit GABA-gated chloride currents in Xenopus oocytes expressing picrotoxin-insensitive GABA(A) receptors. Neuropharmacology 38:267–271. 10.1016/S0028-3908(98)00172-5 [DOI] [PubMed] [Google Scholar]
- Shu HJ, Bracamontes J, Taylor A, Wu K, Eaton MM, Akk G, Manion B, Evers AS, Krishnan K, Covey DF, Zorumski CF, Steinbach JH, Mennerick S (2012) Characteristics of concatemeric GABAA receptors containing alpha4/delta subunits expressed in Xenopus oocytes. Br J Pharmacol 165:2228–2243. 10.1111/j.1476-5381.2011.01690.x [DOI] [PMC free article] [PubMed] [Google Scholar]
- Spigelman I, Li Z, Liang J, Cagetti E, Samzadeh S, Mihalek RM, Homanics GE, Olsen RW (2003) Reduced inhibition and sensitivity to neurosteroids in hippocampus of mice lacking the GABA(A) receptor delta subunit. J Neurophysiol 90:903–910. 10.1152/jn.01022.2002 [DOI] [PubMed] [Google Scholar]
- Stell BM, Mody I (2002) Receptors with different affinities mediate phasic and tonic GABAA conductances in hippocampal neurons. J Neurosci 22:RC223. 10.1523/JNEUROSCI.22-10-j0003.2002 [DOI] [PMC free article] [PubMed] [Google Scholar]
- Stell BM, Brickley SG, Tang CY, Farrant M, Mody I (2003) Neuroactive steroids reduce neuronal excitability by selectively enhancing tonic inhibition mediated by δ subunit-containing GABAA receptors. Proc Natl Acad Sci U S A 100:14439–14444. 10.1073/pnas.2435457100 [DOI] [PMC free article] [PubMed] [Google Scholar]
- Sun C, Sieghart W, Kapur J (2004) Distribution of alpha1, alpha4, gamma2, and delta subunits of GABAA receptors in hippocampal granule cells. Brain Res 1029:207–216. 10.1016/j.brainres.2004.09.056 [DOI] [PMC free article] [PubMed] [Google Scholar]
- Tao JX, Yung I, Lee A, Rose S, Jacobsen J, Ebersole JS (2013) Tonic phase of a generalized convulsive seizure is an independent predictor of postictal generalized EEG suppression. Epilepsia 54:858–865. 10.1111/epi.12094 [DOI] [PubMed] [Google Scholar]
- Vardya I, Hoestgaard-Jensen K, Nieto-Gonzalez JL, Dósa Z, Boddum K, Holm MM, Wolinsky TD, Jones KA, Dalby NO, Ebert B, Jensen K (2012) Positive modulation of δ-subunit containing GABAA receptors in mouse neurons. Neuropharmacology 63:469–479. 10.1016/j.neuropharm.2012.04.023 [DOI] [PubMed] [Google Scholar]
- Wafford KA, van Niel MB, Ma QP, Horridge E, Herd MB, Peden DR, Belelli D, Lambert JJ (2009) Novel compounds selectively enhance δ subunit containing GABAA receptors and increase tonic currents in thalamus. Neuropharmacology 56:182–189. 10.1016/j.neuropharm.2008.08.004 [DOI] [PubMed] [Google Scholar]
- Wei W, Zhang N, Peng Z, Houser CR, Mody I (2003) Perisynaptic localization of δ subunit-containing GABAA receptors and their activation by GABA spillover in the mouse dentate gyrus. J Neurosci 23:10650–10661. 10.1523/JNEUROSCI.23-33-10650.2003 [DOI] [PMC free article] [PubMed] [Google Scholar]
- Weiss DS. (1988) Membrane potential modulates the activation of GABA-gated channels. J Neurophysiol 59:514–527. 10.1152/jn.1988.59.2.514 [DOI] [PubMed] [Google Scholar]
- Whissell PD, Lecker I, Wang DS, Yu J, Orser BA (2015) Altered expression of δGABAA receptors in health and disease. Neuropharmacology 88:24–35. 10.1016/j.neuropharm.2014.08.003 [DOI] [PubMed] [Google Scholar]
- Wohlfarth KM, Bianchi MT, Macdonald RL (2002) Enhanced neurosteroid potentiation of ternary GABAA receptors containing the δ subunit. J Neurosci 22:1541–1549. 10.1523/JNEUROSCI.22-05-01541.2002 [DOI] [PMC free article] [PubMed] [Google Scholar]
- Wu X, Wu Z, Ning G, Guo Y, Ali R, Macdonald RL, De Blas AL, Luscher B, Chen G (2012) gamma-aminobutyric acid type A (GABAA) receptor alpha subunits play a direct role in synaptic versus extrasynaptic targeting. J Biol Chem 287:27417–27430. 10.1074/jbc.M112.360461 [DOI] [PMC free article] [PubMed] [Google Scholar]
- Wu X, Gangisetty O, Carver CM, Reddy DS (2013) Estrous cycle regulation of extrasynaptic delta-containing GABA(A) receptor-mediated tonic inhibition and limbic epileptogenesis. J Pharmacol Exp Ther 346:146–160. 10.1124/jpet.113.203653 [DOI] [PMC free article] [PubMed] [Google Scholar]
- Ye Z, McGee TP, Houston CM, Brickley SG (2013) The contribution of delta subunit-containing GABAA receptors to phasic and tonic conductance changes in cerebellum, thalamus and neocortex. Front Neural Circuits 7:203. 10.3389/fncir.2013.00203 [DOI] [PMC free article] [PubMed] [Google Scholar]
- Yoon KW, Covey DF, Rothman SM (1993) Multiple mechanisms of picrotoxin block of GABA-induced currents in rat hippocampal neurons. J Physiol 464:423–439. 10.1113/jphysiol.1993.sp019643 [DOI] [PMC free article] [PubMed] [Google Scholar]
- You H, Dunn SM (2007) Identification of a domain in the δ subunit (S238–V264) of the α4β3δ GABAA receptor that confers high agonist sensitivity. J Neurochem 103:1092–1101. 10.1111/j.1471-4159.2007.04817.x [DOI] [PubMed] [Google Scholar]