Abstract
Hemodialysis patients are at higher risk of cardiovascular disease due to traditional and dialysis-related risk factors. Our aim was to study the effects of hemodialysis on the corrected QT interval (QTc) and QTc dispersion in chronic kidney disease (CKD) without clinically manifest heart disease. Two hundred cases of CKD on chronic intermittent hemodialysis of >3 months' duration were included in the study. Twelve-lead electrocardiography and samples for serum creatinine, potassium, calcium, and magnesium were taken before and after dialysis. The mean age of patients was 52.4 ± 17 years with male-to-female ratio of 3:1. QTc interval and QTc dispersion were prolonged in 47% and 59% before and 50% and 89% of patients after hemodialysis, respectively. The mean values of QTc were 433.4 ± 36.9 ms before and 451.4 ± 39.6 ms after hemodialysis (p = 0.001) and the mean values of QTc dispersion were 60.5 ± 19.3 ms before and 81.5 ± 24.4 ms after hemodialysis (p = 0.001). Similar pattern was observed in all etiological groups of CKD, except for QTc dispersion in malignancy-related CKD (p = 0.216). After hemodialysis, there was a significant fall in the mean values of serum potassium (p = 0.001), rise in serum calcium (p = 0.001), and no change in magnesium (p = 0.424). Patients with post hemodialysis QTc dispersion >74 ms had significantly low mean values of serum potassium and calcium as compared to <74 ms group. Large numbers of hemodialysis patients have a prolonged QTc interval and QTc dispersion with a significant increase in the mean values after hemodialysis. There is a significant fall in serum potassium and rise in serum calcium after dialysis.
Keywords: Calcium, corrected QT dispersion, hemodialysis, potassium
Introduction
Cardiovascular disease is the major cause of death, accounting for 43% of all-cause mortality among hemodialysis patients. In addition to increased traditional risk factors, hemodialysis patients also have a number of nontraditional cardiovascular risk factors.[1] The QT interval is a measure of ventricular depolarization and repolarization. Prolonged QT interval is a predictor of cardiovascular death in healthy population.[2]
QTc dispersion is defined as the difference between the longest and shortest QTc interval on surface electrocardiography (ECG). It has been proposed as a noninvasive ECG parameter that might predict an increased risk of malignant arrhythmias.[3] Dialysis patients have prolonged QTc interval and QTc dispersion.[4] A single session of hemodialysis might further increase QTc dispersion in both children and adults.[5,6,7,8] Moreover, QTc interval may be a predictor of ventricular arrhythmia and cardiovascular mortality in chronic kidney disease (CKD) and dialysis patients.[9] Most of the earlier reported studies had smaller number of patients, and the cardiovascular comorbidities due to uremia were not excluded.
The aim of our study was to determine the effects of hemodialysis on the corrected QT interval and QTc dispersion in patients of CKD without any clinically manifest heart disease in a large cohort.
Materials and Methods
This prospective study was conducted in the dialysis unit of the department of nephrology of our tertiary care hospital. The study was cleared by the institutional ethics committee on human research. Two hundred, randomly selected, dry weight, stable CKD patients on chronic intermittent hemodialysis of at least 3-month duration were included in the study. All patients received 4-h thrice-a-week hemodialysis with identical parameters using polysulfone dialyzers and bicarbonate dialysate containing sodium 136 mEq/L, potassium 2.6 mEq/L, calcium 6.01 mg/dl, magnesium 2.43 mg/dl, acetate 3.0 mEq/L, and bicarbonate 35 mEq/L. The exclusion criteria included patients with known heart disease (ischemic, valvular, or hypertensive heart disease or cardiomyopathy), atrial fibrillation, supraventricular or ventricular ectopics, paroxysmal supraventricular tachycardia, and left bundle branch block; patients on antiarrhythmic drugs known to prolong the QT interval (e.g., quinidine and amiodarone) and beta blockers; and those where end of T wave was not clear in more than three leads. All our patients had negative history of chest pain, absence of regional wall motion abnormalities, and gross left ventricular hypertrophy on echocardiography and had a normal left ventricular ejection fraction of >50%.
After taking written informed consent, a detailed history into duration and etiology of CKD and drug intake was taken and detailed examination was done in each case. Demographic characteristics including age, sex, weight, height, body mass index, body surface area, duration on chronic intermittent hemodialysis, and interdialytic weight gain were recorded in each patient. Blood pressure was recorded before and after hemodialysis. Twelve-lead ECG performed at 10 mm/mv and 25 mm/s was recorded before and after hemodialysis session. The QT interval was measured from the onset of the QRS complex to the end of T wave. When the T wave was inverted, the endpoint was taken where the trace returned to the T_P baseline, and when U waves were present, the end of the T wave was not clear in a particular lead and then it was excluded from the analysis.
Three successive QT interval measurements were done in each of the 12 leads and the mean value was calculated. The maximum QT interval was corrected for heart rate (QTc max) using Bazett's formula: QTc = QT/√(RR).[10] Serum potassium, serum calcium, and serum magnesium were measured in each patient before starting and after closing the hemodialysis.
Statistical analysis
Results were expressed as mean ± standard deviation for continuous variables and percentages for categorical data. The difference between the mean values between pre- and post dialysis was analyzed using ANOVA. Analysis employed the Student's t-test for the paired data to determine the significance of differences. Univariate correlation coefficients were examined to assess the effects of electrolyte and blood pressure changes on the QT dispersion. p < 0.05 was considered statistically significant. All statistical analyses were performed using the Statistical Package for the Social Sciences (SPSS) for windows, Version 16.0 (SPSS, Inc., Chicago, IL, USA).
Results
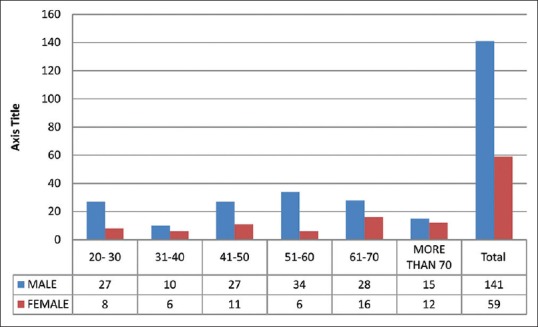
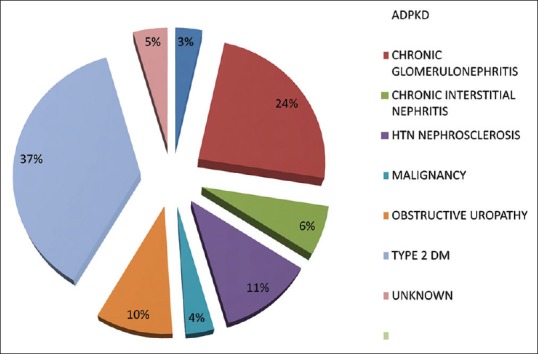
The study included 200 patients (141 males) with a mean age of 52.4 ± 17 and age range of 20–82 years. Predominant etiologies of CKD were diabetic nephropathy (37%), chronic glomerulonephritis (24%), and hypertensive nephrosclerosis (12%). Exact etiology could not be ascertained in 9% of patients. Seven cases of malignancy-related CKD included five cases of myeloma cast nephropathy and one case each of renal cell carcinoma and carcinoma cervix [Figures 1 and 2].
Figure 1.

Patient characteristics – age and sex
Figure 2.

Etiology of chronic kidney disease
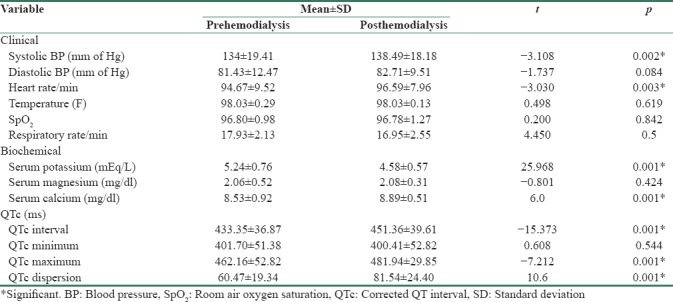
Prolonged corrected QT interval (QTc >440 ms in males and >460 ms in females) was seen in 93 (46.5%) before and 99 (49.5%) after hemodialysis. Prolonged QTc dispersion (>60 ms) was observed in 118 (59%) before and 177 (88.5%) after hemodialysis. On comparing the mean values of various clinical, biochemical, and ECG parameters before and after hemodialysis, there was a significant increase in systolic blood pressure, heart rate, serum calcium, QTc interval, QTc maximum, and QTc dispersion and decrease in serum potassium after hemodialysis [Table 1].
Table 1.
Clinical, biochemical, and electrocardiographic parameters before and after hemodialysis (n=200)

On comparing the mean values of ECG parameters, there was a significant rise in QTc and QTc dispersion after hemodialysis in all etiological groups of CKD, except for an insignificant rise in QTc dispersion in malignancy-related CKD [Table 2].
Table 2.
Corrected QT interval and corrected QT dispersion in relation to etiology of chronic kidney disease

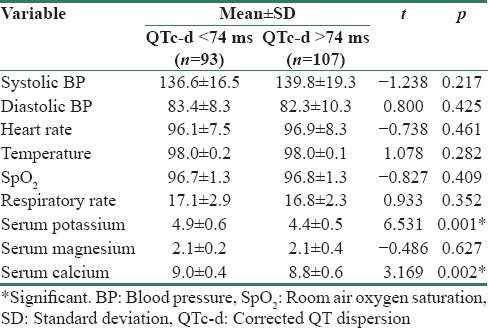
On comparing the mean values of various clinical, biochemical, and ECG parameters post hemodialysis in patients with QTc dispersion >74 ms with those with QTc dispersion <74 ms, the mean values of serum potassium and serum calcium were found to be significantly low [Table 3].
Table 3.
Comparison of various variables with corrected QT interval dispersion <74 ms versus >74 ms after hemodialysis

Discussion
Our study showed a marked variability in QTc interval and QTc dispersion. Approximately half of our patients had prolonged QTc interval before and after the hemodialysis. Prolonged QTc dispersion was seen even more commonly, i.e., 59% before and 88% after hemodialysis. Hemodialysis patients carry a large burden of cardiovascular disease, the most onerous being the high risk of sudden cardiac death. In addition to the traditional cardiac risks present in patients with end-stage kidney disease, dialysis-related arrhythmic triggers may also be significant.[11]
Prolonged QTc interval is a risk factor for sudden cardiac death. Our study, as also reported by others,[5,8,12] has shown a highly significant increase in the mean values of both QTc interval and QTc dispersion after hemodialysis in CKD patients without significant heart disease. On the contrary, Covic et al.[13] reported that hemodialysis increases QTc interval, but not QTc dispersion in end-stage renal disease without manifest cardiac disease.
Our results indicate that the nonhomogeneity of regional ventricular repolarization increases during hemodialysis, which is suggested by increased QTc maximum interval and QTc interval dispersion.
The mechanism of QTc dispersion prolongation in CKD patients during hemodialysis is a matter of speculation. Interstitial myocardial fibrosis and calcium deposition in uremic hearts which increases myocardial nonhomogeneity have been shown on autopsy[14] and quantitative echocardiography. Patients with chronic renal failure had a greater QTc interval and QTc dispersion compared with healthy controls.[4]
Dialysis patients with QTc dispersion longer than 74 ms were shown to be at risk of serious ventricular arrhythmias or sudden death.[9] More than half (54%) of our patients had QTc dispersion >74 ms, and the mean values of serum potassium and calcium in these patients were significantly low when compared with those with QTc dispersion <74 ms. These findings have been substantiated in many earlier reports,[15,16,17] demonstrating that QTc dispersion inversely correlated with serum potassium and calcium. Genovesi et al.[18] compared the effect of six dialysis baths with different ion compositions on the QTc interval duration and observed that the longest QTc interval duration occurred with the low-potassium/low-calcium dialysate, whereas the shortest occurred with the high-potassium/high-calcium dialysate. Interestingly, like the findings of our study, they reported an inverse correlation between the QT interval changes and serum potassium and calcium levels, but not with serum magnesium.
A large cohort of 200 hemodialysis patients of CKD without clinically manifest heart disease is the strength of our study.
Conclusion
The results of this study have shown that a significant number of patients of CKD on chronic maintenance hemodialysis have prolonged QTc interval and QTc interval dispersion with highly significant increase after hemodialysis. The prolonged QTc dispersion was inversely correlated with serum potassium and calcium. Post hemodialysis ECG would effectively identify patients whose repolarization surrogates increase after dialysis sessions. In these individuals, a dialysis regimen can be adopted which is less likely to affect ventricular repolarization.
Financial support and sponsorship
Nil.
Conflicts of interest
There are no conflicts of interest.
References
- 1.Kanbay M, Afsar B, Goldsmith D, Covic A. Sudden death in hemodialysis: An update. Blood Purif. 2010;30:135–45. doi: 10.1159/000320370. [DOI] [PubMed] [Google Scholar]
- 2.Higham PD, Campbell RW. QT dispersion. Br Heart J. 1994;71:508–10. doi: 10.1136/hrt.71.6.508. [DOI] [PMC free article] [PubMed] [Google Scholar]
- 3.Wu VC, Lin LY, Wu KD. QT interval dispersion in dialysis patients. Nephrology (Carlton) 2005;10:109–12. doi: 10.1111/j.1440-1797.2005.00391.x. [DOI] [PubMed] [Google Scholar]
- 4.Kantarci G, Ozener C, Tokay S, Bihorac A, Akoğlu E. QT dispersion in hemodialysis and CAPD patients. Nephron. 2002;91:739–41. doi: 10.1159/000065038. [DOI] [PubMed] [Google Scholar]
- 5.Ozdemir D, Mese T, Agin H, Calkavur S, Bak M. Impact of haemodialysis on QTc dispersion in children. Nephrology (Carlton) 2005;10:119–23. doi: 10.1111/j.1440-1797.2005.00378.x. [DOI] [PubMed] [Google Scholar]
- 6.Morris ST, Galiatsou E, Stewart GA, Rodger RS, Jardine AG. QT dispersion before and after hemodialysis. J Am Soc Nephrol. 1999;10:160–3. doi: 10.1681/ASN.V101160. [DOI] [PubMed] [Google Scholar]
- 7.Malhis M, Al-Bitar S, Farhood S, Zaiat KA. Changes in QT intervals in patients with end-stage renal disease before and after hemodialysis. Saudi J Kidney Dis Transpl. 2010;21:460–5. [PubMed] [Google Scholar]
- 8.Khosoosi Niaki MR, Saravi M, Oliaee F, Akbari R, Noorkhomami S, Bozorgi Rad SH, et al. Changes in QT interval before and after hemodialysis. Caspian J Intern Med. 2013;4:590–4. [PMC free article] [PubMed] [Google Scholar]
- 9.Beaubien ER, Pylypchuk GB, Akhtar J, Biem HJ. Value of corrected QT interval dispersion in identifying patients initiating dialysis at increased risk of total and cardiovascular mortality. Am J Kidney Dis. 2002;39:834–42. doi: 10.1053/ajkd.2002.32005. [DOI] [PubMed] [Google Scholar]
- 10.Bazett H. An analysis of time relation of the electrocardiogram. Heart. 1920;7:353–70. [Google Scholar]
- 11.Makar MS, Pun PH. Sudden cardiac death among hemodialysis patients. Am J Kidney Dis. 2017;69:684–95. doi: 10.1053/j.ajkd.2016.12.006. [DOI] [PMC free article] [PubMed] [Google Scholar]
- 12.Cupisti A, Galetta F, Morelli E, Tintori G, Sibilia G, Meola M, et al. Effect of hemodialysis on the dispersion of the QTc interval. Nephron. 1998;78:429–32. doi: 10.1159/000044972. [DOI] [PubMed] [Google Scholar]
- 13.Covic A, Diaconita M, Gisbeth-Tatomir P, Covic M, Botezan A, Ungureanu G, et al. Haemodialysis increases QTc interval but not QTc dispersion in ESRD patients without manifest cardiac disease. Nephrol Dial Transplant. 2002;17:2170–7. doi: 10.1093/ndt/17.12.2170. [DOI] [PubMed] [Google Scholar]
- 14.Ansari A, Kaupke CJ, Vaziri ND, Miller R, Barbari A. Cardiac pathology in patients with end-stage renal disease maintained on hemodialysis. Int J Artif Organs. 1993;16:31–6. [PubMed] [Google Scholar]
- 15.Di Iorio B, Torraca S, Piscopo C, Sirico ML, Di Micco L, Pota A, et al. Dialysate bath and QTc interval in patients on chronic maintenance hemodialysis: Pilot study of single dialysis effects. J Nephrol. 2012;25:653–60. doi: 10.5301/jn.5000036. [DOI] [PubMed] [Google Scholar]
- 16.Näppi SE, Virtanen VK, Saha HH, Mustonen JT, Pasternack AI. QTc dispersion increases during hemodialysis with low-calcium dialysate. Kidney Int. 2000;57:2117–22. doi: 10.1046/j.1523-1755.2000.00062.x. [DOI] [PubMed] [Google Scholar]
- 17.Sabzghabaei F, Heydariezade SA, Joodat RS. The effects of different electrolyte composition in dialysate on QTc interval; A controlled trial. J Renal Inj Prev. 2016;5:153–6. doi: 10.15171/jrip.2016.32. [DOI] [PMC free article] [PubMed] [Google Scholar]
- 18.Genovesi S, Dossi C, Viganò MR, Galbiati E, Prolo F, Stella A, et al. Electrolyte concentration during haemodialysis and QT interval prolongation in uraemic patients. Europace. 2008;10:771–7. doi: 10.1093/europace/eun028. [DOI] [PubMed] [Google Scholar]


