Bacterial iac genes code for the enzymatic conversion of the plant hormone indole-3-acetic acid (IAA) to catechol. Here, we demonstrate that the iac genes of soil bacterium Enterobacter soli LF7 enable growth on IAA by coarrangement and coexpression with a set of pca and cat genes that code for complete conversion of catechol to central metabolites. This work contributes in a number of novel and significant ways to our understanding of iac gene biology in bacteria from (non-)plant environments. More specifically, we show that LF7's response to IAA involves derepression of the MarR-type transcriptional regulator IacR, which is quite fast (less than 25 min upon IAA exposure), highly specific (only in response to IAA and chlorinated IAA, and with few genes other than iac, cat, and pca induced), relatively sensitive (low micromolar range), and seemingly tailored to exploit IAA as a source of carbon and energy.
KEYWORDS: Enterobacter asburiae LF7a, Enterobacter soli LF7, IAA, auxin, iac genes, indole-3-acetic acid catabolism
ABSTRACT
We show for soil bacterium Enterobacter soli LF7 that the possession of an indole-3-acetic acid catabolic (iac) gene cluster is causatively linked to the ability to utilize the plant hormone indole-3-acetic acid (IAA) as a carbon and energy source. Genome-wide transcriptional profiling by mRNA sequencing revealed that these iac genes, chromosomally arranged as iacHABICDEFG and coding for the transformation of IAA to catechol, were the most highly induced (>29-fold) among the relatively few (<1%) differentially expressed genes in response to IAA. Also highly induced and immediately downstream of the iac cluster were genes for a major facilitator superfamily protein (mfs) and enzymes of the β-ketoadipate pathway (pcaIJD-catBCA), which channels catechol into central metabolism. This entire iacHABICDEFG-mfs-pcaIJD-catBCA gene set was constitutively expressed in an iacR deletion mutant, confirming the role of iacR, annotated as coding for a MarR-type regulator and located upstream of iacH, as a repressor of iac gene expression. In E. soli LF7 carrying the DNA region upstream of iacH fused to a promoterless gfp gene, green fluorescence accumulated in response to IAA at concentrations as low as 1.6 μM. The iacH promoter region also responded to chlorinated IAA, but not other aromatics tested, indicating a narrow substrate specificity. In an iacR deletion mutant, gfp expression from the iacH promoter region was constitutive, consistent with the predicted role of iacR as a repressor. A deletion analysis revealed putative −35/−10 promoter sequences upstream of iacH, as well as a possible binding site for the IacR repressor.
IMPORTANCE Bacterial iac genes code for the enzymatic conversion of the plant hormone indole-3-acetic acid (IAA) to catechol. Here, we demonstrate that the iac genes of soil bacterium Enterobacter soli LF7 enable growth on IAA by coarrangement and coexpression with a set of pca and cat genes that code for complete conversion of catechol to central metabolites. This work contributes in a number of novel and significant ways to our understanding of iac gene biology in bacteria from (non-)plant environments. More specifically, we show that LF7's response to IAA involves derepression of the MarR-type transcriptional regulator IacR, which is quite fast (less than 25 min upon IAA exposure), highly specific (only in response to IAA and chlorinated IAA, and with few genes other than iac, cat, and pca induced), relatively sensitive (low micromolar range), and seemingly tailored to exploit IAA as a source of carbon and energy.
INTRODUCTION
The ability of bacteria to degrade the plant hormone indole-3-acetic acid (IAA) has been recognized for over 60 years (1), but it was not until more recently (2) that a set of genes underlying this property was first described and characterized. These so-called iac genes have since been identified in the genomes of representatives from the bacterial classes Alphaproteobacteria, Betaproteobacteria, and Gammaproteobacteria as well as the phylum Actinobacteria (2). Many iac-carrying species are known to associate with plants, but some are not, which has raised questions about the ecological role(s) of iac genes (2).
Pseudomonas putida 1290 was the strain for which a link between iac genes and IAA catabolism was first demonstrated (2). Originally isolated from the foliage of a pear tree, P. putida 1290 can use IAA as a sole source of carbon, nitrogen, and energy (3). It carries the iac genes clustered on the chromosome as iacABCDEFG→-iacR←-iacHI→ (superscript arrows indicate the relative orientation of single genes or groups of genes). This cluster was sufficient to confer upon P. putida KT2440 (not an iac gene carrier) the ability to grow on IAA (2). Heterologous expression of the iac gene cluster in Escherichia coli revealed that iacA is involved in the initial conversion of IAA to 2-hydroxy-IAA (2-OH-IAA), which is then converted via 3-hydroxy-2-oxo-IAA (diOxIAA) to catechol, the end product of the iac-encoded IAA degradation pathway (4). In P. putida 1290, catechol is ortho cleaved and channeled into central metabolism by-products of the cat and pca genes (2). These cat and pca genes are necessary for the growth of P. putida 1290 on IAA as the sole source of carbon and energy (2).
Two other bacterial strains for which iac gene function has been confirmed are Acinetobacter baumannii ATCC 19606 and Paraburkholderia phytofirmans PsJN. The first of these two strains was isolated from a patient with a urinary tract infection and carries its iac genes as iacR←-iacHABICDEFG→ (5). Wild-type Acinetobacter baumannii ATCC 19606, but not the iacA-inactivated transposon mutant AB6-2, was able to grow on M9 minimal medium with IAA as a sole carbon source, while crude cell extracts of ATCC 19606 but not mutant AB6-2 showed IAA catabolic activity (6). Both sets of observations confirm a role for IacA in the IAA degradation pathway. The ability to grow on IAA was also demonstrated for the iac-carrying plant-growth-promoting rhizobacterium P. phytofirmans PsJN (7). In this strain, originally isolated from onion roots, the organization of iac genes is more complex than in strains 1290 and ATCC 19606 (iacF→-catCAB←-catR1→-iacR2←-iacCDYT1→-iacS←-iacABIHE→-iacR1←-iacG→, with a second locus iacT2→-iacA2G2→ elsewhere on the chromosome), with iac genes separated into what appear to be multiple transcriptional units, sometimes present in more than one copy (e.g., iacA), and interspersed with cat and other nonarchetypal iac genes (e.g., iacY). In strain PsJN, insertional inactivation of iacA1, iacB, iacC, iacD, iacE, iacF, iacH, or iacI, but not iacA2, iacG, iacG2, iacY, iacS, iacT1, or iacT2, led to a loss of the ability to grow on IAA, thus conclusively linking iacF, iacCD, and iacABIHE to the IAA degradative phenotype (7).
The regulation of iac gene expression has been studied in all three strains for which iac genes have been linked to IAA degradation. Reverse transcription quantitative PCR (RT-qPCR) showed that the expression of iac genes in P. putida 1290 and P. phytofirmans PsJN was inducible with IAA (4, 7). Similarly, the exposure to IAA led to the production of IacA protein in A. baumannii ATCC 19606 (5, 6). In the case of P. putida 1290 and A. baumannii ATCC 19606, experimental evidence suggests a role for the iacR gene product in iac gene expression. A derivative of the P. putida 1290 iac gene cluster with the iacR gene insertionally inactivated (i.e., iacABCDEFG-iacR::Tn5-iacHI) showed constitutive iac expression in heterologous host E. coli (4), suggesting that iacR codes for a repressor of iac genes in P. putida 1290. As for A. baumannii ATCC 19606, the use of an E. coli reporter system consisting of an isopropyl β-d-1-thiogalactopyranoside (IPTG)-inducible iacR gene and the iacH promoter fused to the gene for green fluorescent protein (gfp), revealed that the induction of iacR diminished GFP production, suggesting that the product of iacR represses iac gene expression. Furthermore, in electrophoretic mobility shift assays, purified IacR from ATCC 19606 was shown to bind to a DNA fragment encompassing the iacR-iacH intergenic region in the absence of IAA and to lose the affinity for this region in the presence of IAA (6). These findings are consistent with the annotation of iacR as coding for a MarR, or multiple antibiotic resistance repressor, family-type protein and with a model of iac gene expression that involves IAA as an inducer of its own degradation in P. putida 1290 and A. baumannii ATCC 19606. Unlike the iacR gene products in these two strains, iacR1 and iacR2 from P. phytofirmans PsJN are predicted transcriptional regulators of the LuxR and LysR families, respectively. It was proposed that the regulation of iac gene expression in PsJN involves the product of iacS, which is a sensor kinase that stimulates IacR1 upon recognition of IAA, which in turn activates the expression of iacABIHE and iacG. This transcriptional activation then initiates the IAA degradation pathway and leads to the accumulation of diOxIAA, which, together with IacR2, acts to induce the expression of iacCD and iacF for further conversion into catechol (7).
The organization of iac genes into multiple and differently regulated transcriptional units, as appears to be the case for P. phytofirmans PsJN, may represent an adaptation that enables bacteria to express only a subset of the IAA degradation pathway components (7). Perhaps for PsJN, which colonizes plants as an endophyte, the possession of iac genes gives the bacterium control over its host's IAA homeostasis through IAA inactivation, for which it would be sufficient to express only the first step(s) of the pathway. In bacteria that instead use the iac genes to extract carbon and energy from IAA, one would expect the iac genes to be more tightly organized, possibly into a single operon, under the control of a single promoter. We identified Enterobacter soli LF7 (synonym, Enterobacter asburiae LF7a) as a bacterial strain that appears to meet these criteria. Originally isolated from soil in the Tambopata National Reserve (Peru) for its ability to grow on lignin cellulose as a sole source of carbon (8), this bacterium carries the iac genes as a contiguous cluster iacHABICDEFG with an iacR homolog upstream of iacH and with pcaIJD and catBCA genes immediately downstream of, and in the same transcriptional orientation as, iacG. We are interested in E. soli LF7 as a model strain representing what is arguably the most efficient way to organize iac genes on a bacterial genome, i.e., iac genes clustered all together, seemingly organized as an operon and syntenically coupled to genes (cat and pca) that shuttle the product of the iac-encoded IAA degradation pathway (catechol) into central metabolism. Here, we report on the coexpression of iac, cat, and pca genes in E. soli LF7, the specificity, sensitivity, and speed of iac gene induction, and the role of iacR as a repressor of iac gene expression, as well as the numbers, types, and functions of other genes whose expression is altered in response to IAA.
RESULTS
Organization of the iac genes on the LF7 genome and their contribution to the IAA degradative phenotype.
The genome of E. soli LF7 harbors a complete set of iac genes, arranged as iacR→-iacHABICDEFG→ (Fig. 1). All nine genes immediately downstream of iacG have the same orientation as the iac genes. These downstream genes include mfs (predicted to code for a major facilitator superfamily protein), pcaIJD (coding for the conversion of β-ketoadipate enol-lactone to β-ketoadipyl-CoA), catBCA (catechol to β-ketoadipate enol-lactone), a gene coding for a fatty acid desaturase (locus Entas_2467), and one for the periplasmic component of an ABC-type transport system (Entas_2466). While there is a 333-bp gap between the stop codon of iacR and the start codon of iacH, all 17 genes downstream of iacH show little or no intergenic space (Fig. 1). An FGENESB analysis predicted an operonic structure for the 16 contiguous genes iacHABICDEFG-mfs-pcaIJD-catBCA, while iacR and Entas_2467-2466 each constitute a separate single transcriptional unit (Fig. 1).
FIG 1.
Graphical representation of the region of the E. soli LF7 chromosome (CP003026) which harbors the iacR-iacHABICDEFG gene cluster. Individual genes are represented as block arrows, and shown for each gene are its relative size, direction, and location, as well as the last two digits of its NCBI locus_tag Entas_24xx (e.g., for iacH, xx equals 83 because its locus tag is Entas_2483). Highlighted in black are the iac genes, in gray are the pcaIJD and catBCA genes. Line arrows indicate the size and direction of transcriptional units (operons) as predicted by FGENESB.
We confirmed that E. soli LF7 is able to utilize IAA as a sole source of carbon and energy (Fig. 2A). An iacA deletion derivative of E. soli LF7 (ΔiacA::cat) was not able to grow at the expense of IAA (Fig. 2B), supporting the expected contribution of iacA to the IAA-degradative phenotype. An iacR deletion mutant of E. soli LF7 (ΔiacR::cat) was still able to grow on IAA (Fig. 2C), which is consistent with its predicted role as a repressor of iac gene expression.
FIG 2.
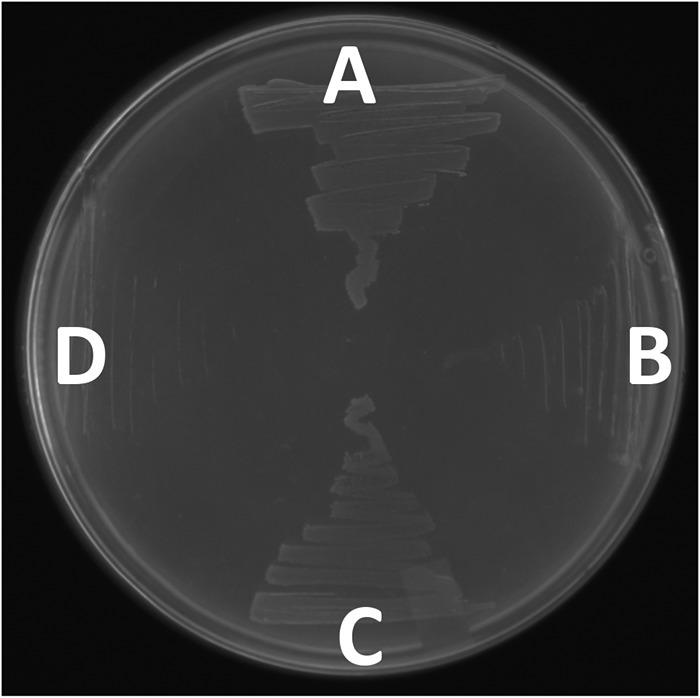
Wild-type E. soli LF7 (A), E. soli LF7 ΔiacA::cat (B), E. soli LF7 ΔiacR::cat (C), and negative control E. coli TOP10 (D) streaked on M9 minimal agar containing 5 mM IAA as the sole source of carbon and energy.
Genome-wide transcriptional profiling of wild-type E. soli LF7 and its iacR deletion mutant in response to IAA.
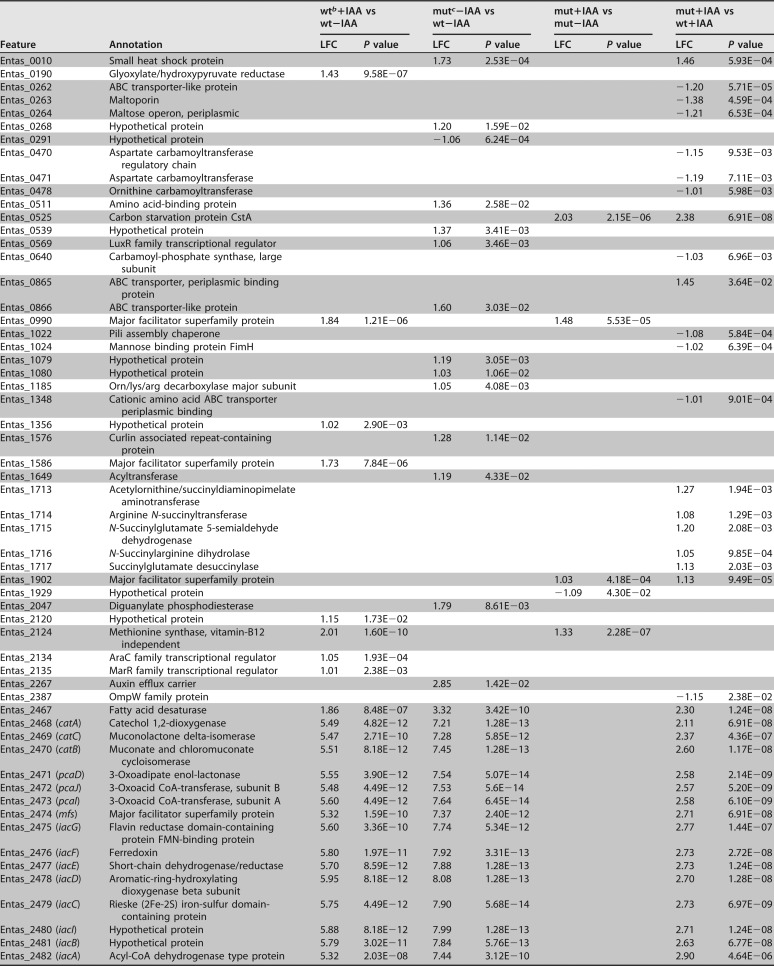
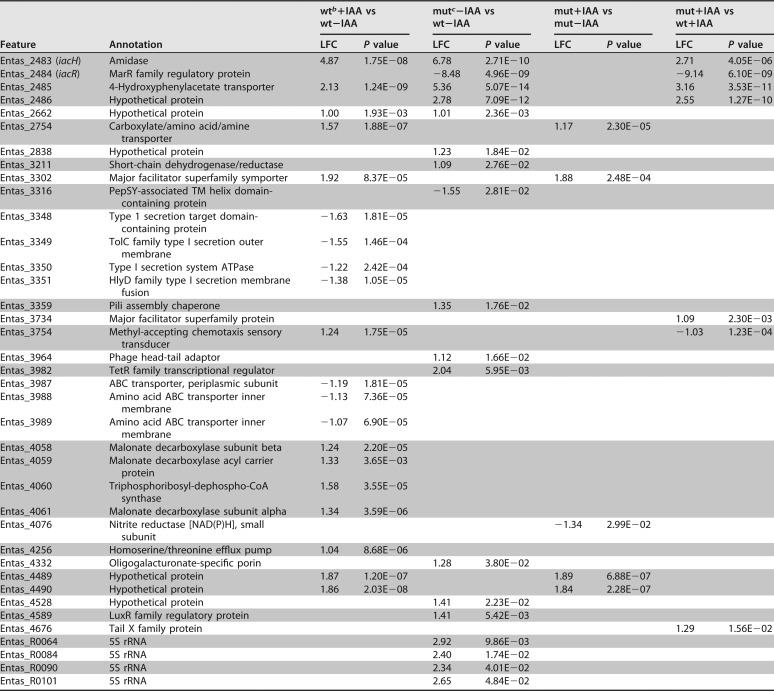
We collected and compared transcriptome sequencing (RNA-Seq) data from replicate cultures (n = 3) of wild-type E. soli LF7 (wt) or its ΔiacR::cat derivative (mut) which were exposed to 200 μM IAA or water (control) for 2 h while growing exponentially on minimal medium with succinate. We refer to these four treatments as wt+IAA, wt−IAA, mut+IAA, and mut−IAA, respectively. We identified 96 genes (2.1% of the 4,582 genes on the LF7 genome) that were differentially expressed in at least one of the following pairwise comparisons: wt+IAA versus wt−IAA, mut−IAA versus wt−IAA, mut+IAA versus mut−IAA, and mut+IAA versus wt+IAA (Table 1). For each comparison, a gene was considered “differentially expressed” if its calculated value for log2-fold change (LFC) was greater than 1 or smaller than −1 (i.e., transcript levels were >2-fold higher or lower in one treatment than in the other), with an adjusted P value of <0.05. We will describe these differentially expressed genes in more detail below.
TABLE 1.
Differentially expressed genes in wild-type E. soli LF7 and its ΔiacR deletion mutant exposed (or not) to IAAa
Differentially expressed genes have an LFC value smaller than −1 or greater than 1, with an adjusted P value of <0.05. For these genes, LFCs and corresponding P values are shown for four pairwise comparison. A blank entry indicates that the gene was not differentially expressed in that comparison. Gray shading reveals which genes are next to each other on the LF7 chromosome.
bwt, wild-type E. soli LF7.
cmut, ΔiacR deletion mutant.
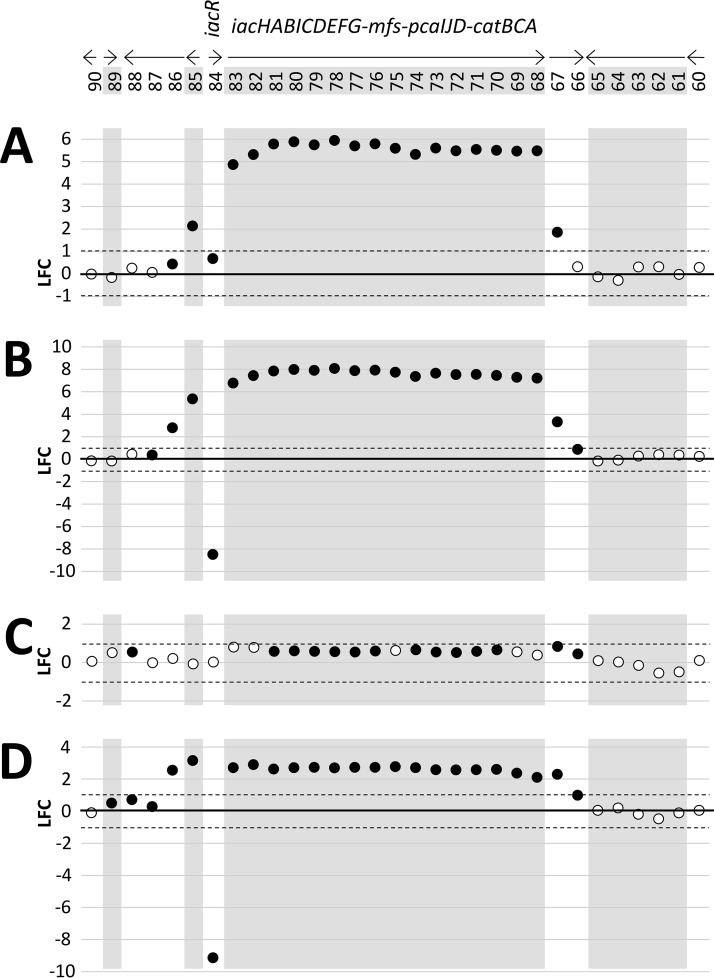
The wt+IAA versus wt−IAA comparison revealed 44 differentially expressed genes. Of these, 37 were “induced” in response to IAA (i.e., showed LFC values greater than 1 in wt+IAA compared to that in wt−IAA), while 7 were “repressed” by IAA (Table 1). The 16 highest expressed genes in response to IAA (LFC values of 4.87 to 5.95) were the 16 genes belonging to the iacHABICDEFG-mfs-pcaIJD-catBCA cluster (Fig. 3A). This observation is consistent with the observed inducibility of iac genes in other bacterial species and with the prediction that in LF7, these genes form a single operonic unit. Also induced were the Entas_2467 fatty acid desaturase gene downstream of catA (LFC = 1.9) and the Entas_2485 gene upstream of iacR (LFC = 2.13), which is predicted to code for a 4-hydroxyphenylacetate transporter (Fig. 3). The iacR gene itself (Entas_2484) was not differentially expressed in response to IAA. Other genes induced by IAA (Table 1) were mdcABCD (Entas_4061-4058; LFC = 1.2 to 1.6), annotated as components of the malonate decarboxylase system, as well as genes predicted to code for transcriptional regulators (Entas_2134, _2135), major facilitator superfamily proteins (Entas_0990, _1586, _3302), a homoserine/threonine efflux pump (Entas_4256), a carboxylate/amino acid/amine transporter (Entas_2754), glyoxylate/hydroxypyruvate reductase (Entas_0190), a methyl-accepting chemotaxis protein (Entas_3754), or hypothetical proteins (Entas_1356, _2662, _4489, and _4490) (Table 1). The seven genes that appeared to be significantly repressed by IAA in wild-type E. soli LF7 were found in two clusters on the LF7 chromosome. The first set of genes (Entas_3348-3351; LFC, −1.2 to −1.6) resembles the lapABCE system of Pseudomonas fluorescens, in which the lapEBC-encoded ABC transporter participates in the secretion of LapA, a large protein required for biofilm formation, more specifically, for irreversible surface attachment (9). The second set of IAA-repressed genes (Entas_3987-3989, LFC = −1.1 to −1.2) is annotated to code for components of a general amino acid ABC transport system.
FIG 3.
Relative differences in the transcript levels of genes within or near the iac gene cluster of succinate-grown E. soli LF7 wild-type (wt) and its ΔiacR derivative (mut), exposed (+) or not exposed (−) to IAA. Shown are log2-fold changes (LFC; see the text) for the following comparisons: (A) wt+IAA versus wt−IAA, (B) mut−IAA versus wt−IAA, (C) mut+IAA versus mut−IAA, and (D) mut+IAA versus wt+IAA. Genes are identified by the last two digits of their Entas_24xx locus tag number (see Fig. 1). Filled symbols represent genes for which the adjusted P values were <0.05. Dashed lines mark LFC = 1 and LFC = −1 (i.e., 2-fold higher or lower transcript levels, respectively).
To confirm the notion that iacR is a repressor of iac gene expression, we compared the RNA-Seq-based transcriptional profile of the E. soli LF7 iacR deletion mutant (mut) to that of the wild-type E. soli LF7 (wt) in the absence of IAA. In this mut−IAA versus wt−IAA comparison, we identified 48 differentially expressed genes: 45 for which transcript levels were higher in the iacR mutant than in the wild type, and 3 for which levels were lower (Table 1). The gene with the lowest LFC was iacR, as would be expected, given that this gene had been deleted in the ΔiacR mutant. Among the 45 induced genes in the mutant, the 18 highest LFC values were observed for the very same genes that were most responsive to IAA in the wild-type strain, namely, iacHABICDEFG-mfs-pcaIJD-catBCA, Entas_2485 (upstream of iacR), and Entas_2467 (immediately downstream of catA) (Fig. 3B). These 18 genes, together with Entas_2662 (hypothetical protein), were the only genes that were (i) induced by IAA in the wild type and (ii) upregulated in the iacR deletion mutant. This result is wholly consistent with the proposed role of the iacR gene product as a repressor of iac gene expression in the absence of IAA and with a mechanism of IAA-induced derepression of iacHABICDEFG-mfs-pcaIJD-catBCA, Entas_2485, Entas_2467, and Entas_2662.
The mut+IAA versus mut−IAA comparison showed that in the ΔiacR mutant, none of the genes in or near the iacHABICDEFG-mfs-pcaIJD-catBCA cluster were differentially expressed in response to IAA (Fig. 3C). This suggests that in the ΔiacR mutant, the derepression of these genes is maximal. Only 10 genes responded to IAA in the ΔiacR mutant (Table 1). Among the eight that were induced by IAA, six (Entas_0990, _2124, _2754, _3302, _4489, and _4490) were also induced by IAA in the wild type, suggesting that their response to IAA might be iacR independent and not related to IAA degradation.
By comparing the transcriptional profiles of the ΔiacR mutant to those of the wild-type strain under identical conditions of IAA exposure (i.e., mut+IAA versus wt+IAA), we found 43 genes differentially expressed (Table 1): 13 that showed lower transcript levels in the mutant than in the wild type (including, as expected, iacR itself) and 30 that showed higher levels (Table 1). Among the latter were all 16 genes in the iacHABICDEFG-mfs-pcaIJD-catBCA cluster, as well as Entas_2467 (fatty acid desaturase), Entas_2485 (4-hydroxyphenylacetate transporter), and Entas_2486 (hypothetical protein) (Fig. 3D). This observation suggests that the derepression of these genes by 200 μM IAA in wild-type LF7 was less than what is achievable by the deletion of iacR. The other genes that showed higher expression in the ΔiacR mutant than in the wild type in the presence of IAA included Entas_1713-1717 (LFC, 1.1 to 1.3; conversion of arginine to glutamate) and Entas_0525 (LFC = 2.38, annotated to code for carbon starvation protein CstA). The genes that were expressed at lower levels in the ΔiacR mutant than in the wild-type strain in the presence of IAA included genes coding for a maltose uptake system (Entas_0262-0264) and carbamoyltransferases or -synthases (Entas_0470-0471, _0478, and _0640).
Identification and characterization of the iac promoter/operator region.
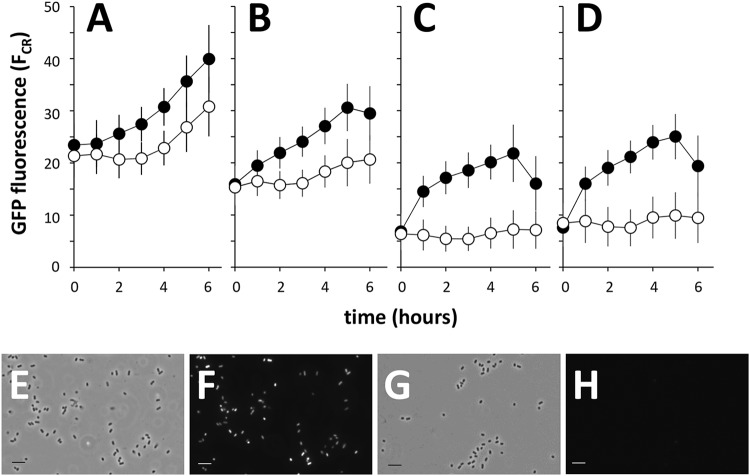
We focused on the iacR-iacH intergenic region as the most likely to harbor the promoter(s) that drives the expression of the iac genes, as well as the putative operator(s) that is targeted by the IacR repressor. Cloned upstream of a promoterless gfp gene, a 480-bp iacR-iacH intergenic fragment (designated PiacH) resulted in IAA-inducible expression of green fluorescence in host E. soli LF7 (Fig. 4). The relative difference in green fluorescence between induced and uninduced cells varied depending on the variant of gfp that was used, i.e., gfp[tagless] (Fig. 4A), gfp[ASV] (Fig. 4B), gfp[AAV] (Fig. 4C), or gfp[LVA] (Fig. 4D). These variants code for green fluorescent proteins with different half-lives (10). The highest induced-to-uninduced GFP ratio was observed with gfp[AAV] (Fig. 4C). Figure 4E to H shows representative images of E. soli LF7 cells carrying a PiacH-gfp[AAV] fusion during growth on IAA or succinate: only during growth on IAA did the cells accumulate green fluorescence.
FIG 4.
IAA-induced GFP fluorescence in E. soli LF7 cells carrying the iacH promoter region (PiacH) fused to the promoterless gfp gene variants tagless (A), ASV (B), AAV (C), or LVA (D). Shown as a function of time since induction with 200 μM IAA (•) or water (control, ○) are the means and standard deviations of single-cell GFP fluorescence (measured by flow cytometry and expressed as the cube root of FL-1, or FCR) in bacterial cultures growing exponentially on M9 with succinate. Fluorescence microscope images of E. soli LF7(pPiacH-gfp[AAV]) cells growing exponentially in M9 liquid medium containing 5 mM IAA (E, F) or 12.55 mM succinate (G, H). Shown are representative phase contrast (E, G) or GFP channel (F, H) images. Bars, 5 μm.
Inducer specificity and catabolite repression.
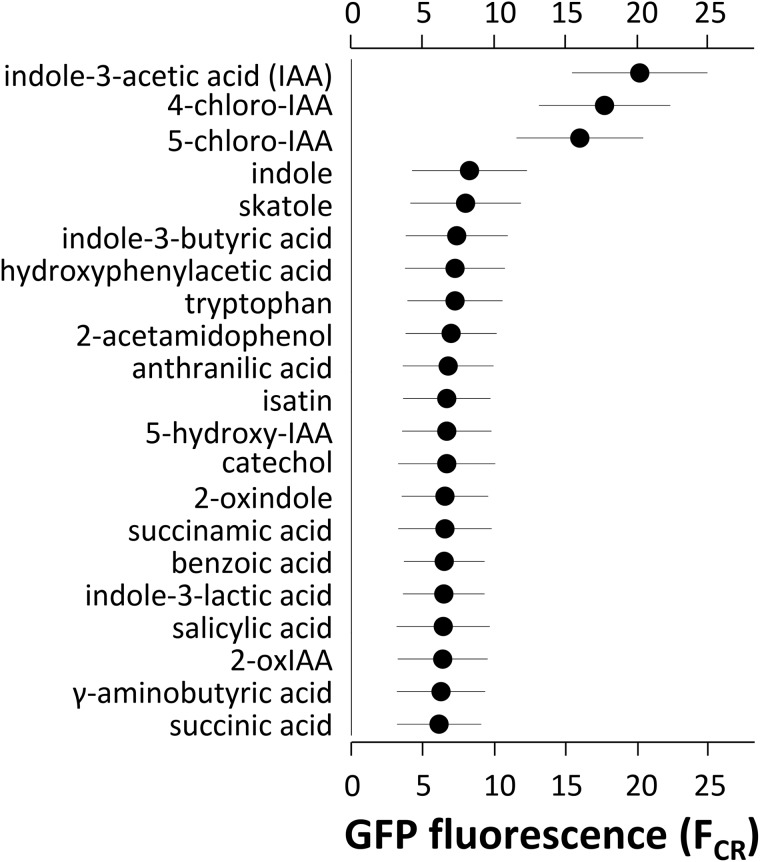
Cultures of E. soli LF7(pPiacH-gfp[AAV]) were grown on succinate and spiked with various compounds at a concentration of 200 μM to test their ability to induce PiacH. The tested compounds were skatole (3-methylindole), 2-oxindole-3-acetic acid, isatin, indole-3-lactic acid, anthranilate, acetamidophenol, 5-hydroxyindoleacetic acid, catechol, indolebutyric acid, salicylate, succinamic acid, tryptophan, benzoate, gamma-aminobutyric acid, hydroxyphenylacetic acid, indole, oxindole, succinate, 4-chloro-indoleacetic acid, 5-chloro-indoleacetic acid, and IAA. Of these, only IAA and its two chlorinated derivatives (4-chloro-IAA and 5-chloro-IAA) were able to induce fluorescence (Fig. 5), suggesting a high specificity for iac gene induction. We also tested the ability of E. soli LF7(pPiacH-gfp[AAV]) to respond to 200 μM IAA while growing on carbon sources other than succinate. Compared to succinate (Fig. 6A), both glucose (Fig. 6B) and fructose (Fig. 6C) repressed IAA-induced GFP expression, while on benzoate (Fig. 6D), gene expression was elevated even in the absence of IAA but still inducible with IAA. The highest levels of fluorescence were found with cells growing on IAA (Fig. 6E).
FIG 5.
Means and standard deviations of single-cell GFP fluorescence of E. soli LF7(pPiacH-gfp[AAV]) growing in M9 liquid medium with succinate and exposed for 4 to 5 h to 200 μM IAA or one of the other compounds listed, before analysis of single-cell GFP fluorescence by flow cytometry. FCR, cube root of the mean of 30,000 cells registered by the FL-1 channel output in flow cytometry.
FIG 6.
Mean GFP fluorescence (and standard deviation) in single cells of E. soli LF7(pPiacH-gfp[AAV]) growing exponentially on 12.55 mM succinate (A), 8.33 mM glucose (B), 8.33 mM fructose (C), 7.14 mM benzoate (D), or 5 mM IAA (E), and spiked at t = 0 with 200 μM IAA (•) or water control (○).
Dose response of iac gene expression.
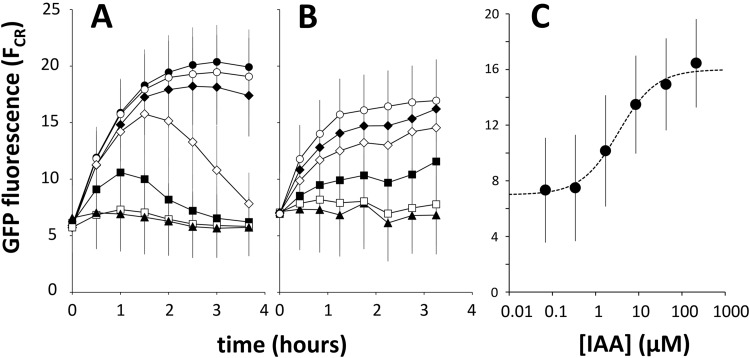
To determine the sensitivity of the iacH promoter to IAA, we exposed cultures of E. soli LF7(pPiacH-gfp[AAV]) to IAA concentrations ranging from 0 to 1 mM. This experiment revealed a quasi-dose-dependent response to IAA, i.e., no response to IAA in the 0 to 0.36 μM range, a transient accumulation of GFP with 1.6 to 8 μM IAA, and a maximal response at concentrations of 40 μM and higher (Fig. 7A). At concentrations of 1.6 μM or greater, an increase in fluorescence was already measurable at the very first sampling point (20 to 25 min after the IAA spike), suggesting a rapid response of PiacH to IAA.
FIG 7.
Accumulation of GFP fluorescence in E. soli LF7(pPiacH-gfp[AAV]) cells (A) or in E. soli LF7 ΔiacA::cat(pPiacH-gfp[AAV]) cells (B) in response to a range of IAA concentrations. Cells were growing exponentially in M9 medium supplemented with 12.55 mM succinate when they were exposed to IAA at time t = 0. IAA concentrations were as follows: •, 1 mM; ○, 200 μM; ◆, 40 μM, ♢ 8 μM; ■, 1.6 μM; ◽, 0.32 μM; ▲, no IAA. (C) IAA dose-response curve for E. soli LF7 ΔiacA::cat(pPiacH-gfp[AAV]) cells. Shown are the GFP fluorescence averages over the time period of 1.25 to 2.75 h after IAA exposure, as a function of IAA concentration. The stippled line represents the best fit of a Hill equation with a coefficient of 1 and a half-maximal GFP fluorescence at 3.4 μM IAA.
We suspected that the transient expression of GFP in IAA-exposed cultures of E. soli LF7(pPiacH-gfp[AAV]) at 1.6 and 8 μM (Fig. 7A) was due to IAA being consumed by the bacteria. To test this hypothesis, we transformed the iacA deletion mutant E. soli LF7 ΔiacA::cat (unable to grow on IAA) with the plasmid pPiacH-gfp[AAV] and measured GFP accumulation in response to IAA. Consistent with our hypothesis, this strain did not show transient expression at low IAA concentrations (Fig. 7B). Instead, GFP reached more or less steady-state levels approximately 2 h after the IAA spike. From these levels, we constructed a dose-response curve for IAA (Fig. 7C), showing a half-maximal response at 3.4 μM IAA and a dose-responsive range between 1 and 20 μM. The results from this experiment also would suggest that IAA, as opposed to an IAA degradation pathway intermediate, is the inducer of iac gene expression, assuming that IacA catalyzes the first enzymatic step in the IAA degradation pathway.
Expression of PiacH-gfp in a ΔiacR background.
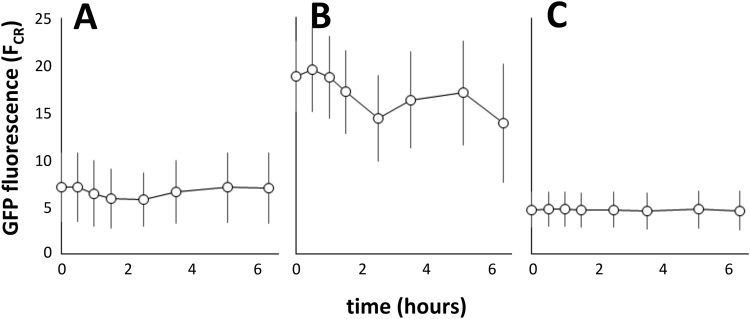
We used the pPiacH-gfp[AAV] construct to confirm the role of iacR as a repressor of iac gene expression. For this, we transformed an iacR deletion mutant E. soli LF7 ΔiacR::cat with the pPiacH-gfp[AAV] construct or with an iacR-complemented derivative of pPiacH-gfp[AAV], i.e., piacR-PiacH-gfp[AAV]. The latter construct harbors a complete iacR gene, including its native promoter, upstream of the iacR-iacH intergenic region. In the absence of IAA, GFP fluorescence in succinate-grown E. soli LF7(pPiacH-gfp[AAV]) was low, as before (Fig. 8A). Under the same conditions, GFP fluorescence in E. soli ΔiacR::cat(pPiacH-gfp[AAV]) was elevated to levels that were much higher (Fig. 8B). This result is consistent with the RNA-Seq data which showed that iacR is a repressor of expression from the iacH promoter. Complementation with iacR abolished the constitutive expression of PiacH in E. soli LF7 ΔiacR::cat (Fig. 8C).
FIG 8.
Single-cell GFP fluorescence of E. soli LF7(pPiacH-gfp[AAV]) (A), E. soli LF7 ΔiacR::cat(pPiacH-gfp[AAV]) (B), and E. soli LF7 ΔiacR::cat(piacR-PiacH-gfp[AAV]) (C) as a function of time. Cells were growing on M9 plus 12.5 mM succinate.
Identification of a putative iac promoter/operator region.
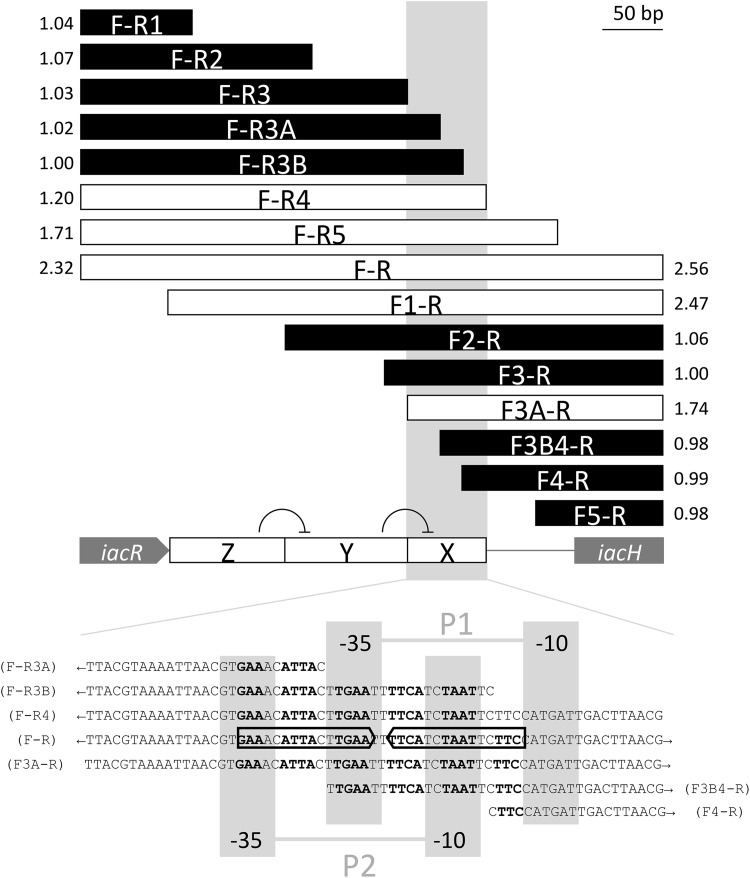
To identify the location of possible promoter and operator regions upstream of iacH, we generated 5′ or 3′ sequential deletions of the 480-bp iacR-iacH intergenic space and fused these to gfp[AAV] for testing in wild-type E. soli LF7. The results of this analysis are shown in Fig. 9. Deletions of 388, 289, 210, 183, and 165 bp from the 3′ end of the PiacH fragment (i.e., constructs F-R1, F-R2, F-R3, F-R3A, and F-R3B, respectively) resulted in a complete loss of the IAA response, whereas no loss was observed following deletions of 145 (construct F-R4) or 86 (construct F-R5) bp from the 3′ end. This result is compatible with the prediction by PromoterHunter (11) of a −35/−10 promoter sequence (TTGAAT-N16-CATGAT) at positions 310 to 337 of the PiacH fragment, as F-R1, F-R2, F-R3, F-R3A, and F-R3B lack this sequence (P1) partially or entirely (Fig. 9). Deletions from the other end of the PiacH fragment gave a more complicated result. IAA responsiveness was lost with 5′ deletions of 376, 315, and 297 bp (constructs F5-R, F4-R, and F3B-R, respectively), but not with a deletion of 270 bp (construct F3A-R). This is consistent with a predicted −35/−10 promoter sequence (GTGAAA-N17-TCTAAT) at positions 286 to 314 of the PiacH fragment, as F5-R, F4-R, and F3B-R, but not F3A-R, lack this sequence (P2) partially or entirely (Fig. 9). A deletion of 251 or 169 bp from the 5′ end of PiacH (constructs F3-R or F2-R, respectively) also abolished IAA responsiveness, but not a deletion of 72 bp only (construct F1-R). Together, this would suggest that in the absence of the F1-R2 region of PiacH (labeled Z in Fig. 9), the F2-R3 region (labeled Y in Fig. 9) has a negative effect on promoter activity driven from F3A-R4 (labeled X in Fig. 9). We noted that predicted promoters P1 and P2 overlap with each other and with a DNA sequence that represents an imperfect palindromic sequence (5′-GAAACATTACTTGAAT•TTTCATCTAATTCTTC-3′) that meets the general criterion of a MarR-type regulator binding site (the bullet represents the symmetry center of the palindrome) (12).
FIG 9.
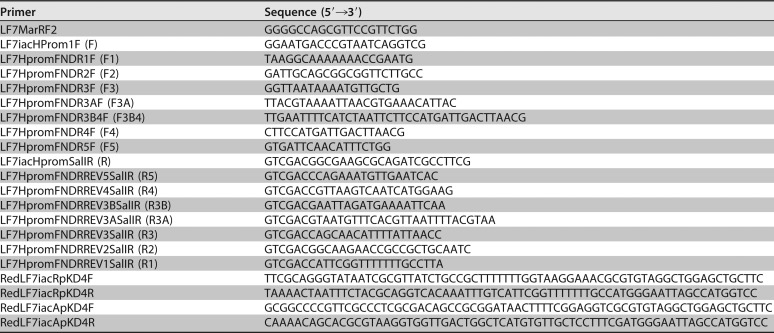
Deletion analysis of the iacR-iacH intergenic region to locate putative iacH promoters and IacR operator sites. The F-R bar represents the full 480-bp DNA fragment that was amplified from E. soli LF7 using primer pair F and R (Table 3) and fused to a promoterless gfp gene in pPROBE′-gfp[AAV] to test responsiveness to 200 μM IAA in a LF7 wild-type background. All other bars represent subfragments of F-R, using either F or R in combination with another forward or reverse primer (e.g., F-R5 represents an amplicon obtained with primers LF7iacHProm1F and LF7HpromFNDRREV5SalIR, see Table 3). White bars represent fragments that showed IAA inducibility, while black bars represent fragments that did not respond to IAA. The number next to each bar is a measure for inducibility, expressed as the ratio of mean FCR of IAA-exposed cells to the mean FCR of unexposed cells, measured 1 h after IAA exposure. The boxed gray area (also marked as region X on the iacR-iacH intergenic region) represents a sequence within F-R that is minimally required for transcriptional response to IAA. Within this sequence (shown at the bottom of the figure), we identified two possible −35/−10 promoters (P1, TTGAAT/CATGAT; and P2, GTGAAA/TCTAAT) as well as an imperfect 16-bp inverted repeat (5′-GAAnnATTAnnTGAAnnTTCAnnTAATnnTTC-3′) overlapping both promoters and possibly representing an IacR operator site. The results of the deletion analysis are consistent with a model where the presence of sequence Z on the iacR-iacH intergenic region is required to reverse the negative effect of sequence Y on the IacR-regulated expression of iacH from sequence X (see the text for more details on this proposed model).
DISCUSSION
The work we describe here establishes E. soli LF7 as the fourth bacterial strain for which the possession of an iac gene cluster has been experimentally linked to the use of IAA as the sole source of carbon and energy. The three other strains with such a link (i.e., P. putida 1290, A. baumannii ATCC 19606, and P. phytofirmans PsJN) were isolated from plants (3, 13) or urine (14). Plants and urine both contain IAA in quantities that are sufficiently high (15, 16) to justify the maintenance of iac genes in support of bacterial growth at the expense of IAA. E. soli LF7 was isolated from a Peruvian soil for which IAA measurements, insofar as we know, are not available (8). While IAA levels are generally low in soils (17), concentrations as high as 210 μg/kg have been reported for some organic soils (18), which (assuming a 10% to 60% soil water content) translates into an IAA concentration range of 2 to 12 μM. It is worth noting that this estimate overlaps with the range of IAA concentrations that, in our experiments, induced iac gene expression in E. soli LF7 (Fig. 7). We consider this to be at least consistent with the possibility that the iac genes contribute to the fitness of E. soli LF7, and other iac-carrying bacteria, in certain soil environments. The most likely sources of soil IAA are plants and microorganisms, both of which are known to produce IAA and use it as a signal molecule (19). The ability to destroy IAA bestows upon E. soli LF7 the potential to interfere with this signaling, especially as it pertains to the root-associated microorganisms that promote plant growth or suppress the plant innate immunity response by the production of IAA (19). The presence and activity of iac-carrying bacteria such as E. soli LF7 at the root-soil interface could thus have a significant impact on plant-microbe interactions.
Our study is not the first to generate a genome-wide transcriptional profile of a bacterial response to IAA (20–23). However, we are not aware of a study that did so for an iac-carrying bacterium or used RNA-Seq (instead of microarrays). In E. coli MG1655 (20) and Bradyrhizobium japonicum USDA 110 (23), IAA elicits a generalized stress response; more specifically, it induces phenotypes that increase survival when bacteria are challenged with cold, heat, osmotic, or oxidative shock. The exposure to IAA also stimulated exopolysaccharide production and biofilm formation (20, 23). In Azospirillum brasilense Sp245 (22) and Agrobacterium tumefaciens C58 (21), IAA elicited a more specific response by impacting the expression of genes that are known to be important for the interaction of these bacteria with their plant host. For example, IAA induced the expression of genes coding for a type VI secretion system (T6SS) in A. brasilense and repressed the expression of the vir regulon in A. tumefaciens. The response to IAA of the bacterium under study here, E. soli LF7, is best characterized as specific rather than general: only 44 of 4,582 (<1%) genes were differentially expressed in response to IAA, and of those, 18 were genes in or near the iac cluster (including pca and cat genes) involved in IAA/catechol catabolism. This suggests a response of LF7 to IAA that is highly specific to IAA as a source of carbon and energy. This response includes the activation of Entas_2474 (mfs), for which the most similar orthologs in the genome of P. phytofirmans PsJN are iacT1 (Bphyt_2159) and iacT2 (Bphyt_6111), implemented in the transport of the IAA pathway intermediate diOxIAA (7). The role of Entas_2474 in the transport of IAA(-like compounds) remains untested for LF7, but its coexpression with iac genes make it a prime candidate for such a role, together with other predicted transporter genes that were induced in LF7 upon exposure to IAA (i.e., Entas_0990, _1586, _2485, and _3302).
We present several lines of experimental evidence (Fig. 3 and 8) that confirm a role of the iacR gene product as a repressor of iac gene expression in E. soli LF7 in the absence of IAA, as has been previously reported for A. baumannii ATCC 19606 (6). MarR-type proteins typically bind to 16- to 20-bp inverted repeats (12). We identified upstream of the first gene in the iac cluster of LF7 (i.e., iacH) a potential binding site for IacR (Fig. 9). This sequence (5′-GAAACATTACTTGAATTTTCATCTAATTCTTC-3′) overlaps with two putative −35/−10 promoters for iacH expression (Fig. 9). Interestingly, the center portion of this DNA sequence shows significant homology to the MarR DNA-binding site II of E. coli, which is 5′-ATTACTTGccagggCAaCTAAT-3′ (identical nucleotides capitalized). The binding of IacR at this location sterically prevents RNA polymerase from interacting with the putative iacH promoter(s). A deletion analysis of the LF7 iacR-iacH intergenic region (Fig. 9) suggests, however, that the regulation of iac gene expression in this bacterium involves more than just IacR and RNA polymerase. The analysis is consistent with a model that divides the iacR-iacH intergenic region into three functional sections, X, Y, and Z (Fig. 9), where X encompasses the iacH −35/−10 promoter(s) and IacR-binding site and is sufficient for inducible expression of iacH, Y represents a DNA sequence that silences iacH gene expression from section X, and Z is required to suppress the activity of Y. In the context of this proposed model for PiacH expression, it is interesting to note the placement of a large, imperfect inverted repeat across sections Z and Y, where one part of the repeat is located in section Z (5′-TAAnGCAAAAAAnnCGAA-n63-AACCGCnGnTGCAA-3′) and separated by 4 nucleotides (5′-GTGA-3′) from the other repeat in section Y (5′-TTGCAnCnGCGGTT-n9-TTCGnnTTTTTTGCnTTA-3′). Interestingly, immediately downstream of the repeat in section Y is a stretch of DNA (5′-TTTTCATC-3′) that is directly repeated in section X and overlaps with both of the predicted −35/−10 promoters as well as with the proposed IacR binding site. This configuration might point to the involvement of a secondary DNA structure to stabilize transcription from the iacH promoter.
It is worth remarking that the E. soli LF7(pPiacH-gfp[AAV]) strain that we generated and used in this study has several characteristics that make it a suitable bacterial bioreporter (24) for IAA. Because its output is GFP fluorescence, the exposure to IAA can be assessed at the resolution of single cells (Fig. 4E to H), which permits the interrogation of environments where IAA availability is suspected to be spatially heterogeneous, such as plant surfaces or tissues (25). The response of E. soli LF7(pPiacH-gfp[AAV]) to IAA is quick and sensitive to a range of concentrations that are biologically relevant, not only in soils as already explained above, but also in plants (16, 21) and animal urine (15). Also, the response of E. soli LF7(pPiacH-gfp[AAV]) appears to be specific to IAA and its chlorinated derivatives (Fig. 5), which would limit false-positive feedback from the bioreporter. A notable exception to the specificity of E. soli LF7(pPiacH-gfp[AAV]) is benzoate, which did not induce iac expression when added at 200 μM to a culture growing on succinate (Fig. 5) but did so during growth on 7.14 mM benzoate as the sole source of carbon and energy (Fig. 6D). For comparison, the iac genes in P. phytofirmans PsJN were not induced during the growth of PsJN on benzoate (7). In the LF7 genome, there appears to be no additional set of catBCA and pcaIJD genes beside the one (Entas_2468-2473) that lies immediately downstream of the iac genes. Since these genes code for shuttling catechol into central metabolism, and since catechol typically is the end product of benzoate degradation pathways (26), perhaps the induction of iac genes during growth on benzoate may be interpreted to mean that the cat and pca genes are transcriptionally coupled to the iac genes in LF7. In other words, to utilize catechol produced from benzoate, the expression of cat and pca is needed, which would require the expression of the iac genes if cat and pca were part of the same operon as the iac genes. However, this invites the question of what, during growth on benzoate, is the inducer of iac expression, if not IAA. An even more pertinent question is how E. soli LF7 is able to grow on benzoate in the first place. The E. soli LF7 genome features at least one gene (Entas_2116) that is annotated to code for a benzoate transporter but no genes that are linked to enzymes in known benzoate degradation pathways, such as Bphyt_1591-1594 (benABCD) in P. phytofirmans PsJN (GenBank accession numbers WP_012432614 to WP_012432617). These benzoate anomalies require an experimental scrutiny that is beyond the scope of the study described here.
The syntenic arrangement of iac genes on the LF7 genome and the proximity to and IAA-specific coexpression with pca and cat genes can be interpreted as an adaptation that enables the efficient and complete degradation of IAA into components of the citric acid cycle for the generation of cellular building blocks and energy. Under this assumption, the iacHABICDEFG-mfs-pcaIJD-catBCA arrangement as it is found in LF7 would make most sense in environments where IAA is available as a food source and in (relative) abundances that offer its bacterial host a competitive advantage over other bacteria. Interestingly, the exact same gene arrangement can be found on the genomes of other Enterobacteriaceae, including Lelliottia sp. PFL01 (27), Leclercia sp. LSNIH1 and LSNIH3 (28), and Leclercia adecarboxylata strain USDA-ARS-USMARC-60222 (29). However, the environments from which these particular strains were isolated are very different, i.e., fermented seafood (27), hospital plumbing (28), and livestock (29), respectively. This confirms that while the possession of iac genes is a good predictor of its host being able to grow at the expense of the plant hormone IAA (as shown for E. soli LF7 here), it is not prognostic of a plant-environmental origin of the iac-carrying bacterial host. An independent case in point for the latter is presented by the iaa genes, which were first described in 2012 (30) as underlying the ability of the betaproteobacterium Aromatoleum aromaticum strain EbN1 to degrade IAA anaerobically, although strain EbN1 was originally isolated from river mud samples with no obvious plant association (31). The discovery of bacterial IAA catabolism in these environments pleads for studies that examine in more detail the genesis and/or accumulation of IAA in nonplant microbial habitats and its exploitation by microorganisms in those habitats.
MATERIALS AND METHODS
Bacterial strains and growth conditions.
The bacterial strains used in this study are listed in Table 2. E. soli LF7 was obtained as accession number B-59409 from the USDA-ARS Culture Collection (https://nrrl.ncaur.usda.gov). The deletion mutants of LF7 (ΔiacA and ΔiacR) were generated by the protocol of Datsenko and Wanner (32) using E. coli strains MB613 and MB616 (kindly shared by Maria Brandl, USDA-ARS, Albany, CA). For this purpose, primer sets RedLF7iacApKD4F/R and RedLF7iacRpKD4F/R were designed to generate an amplicon that carries the cat (chloramphenicol resistance) gene of MB613 flanked on either side with 50-bp sequences immediately upstream and downstream of iacA and iacR, respectively (Table 3). PCR was done with GoTaq Green master mix (Promega, Madison WI) with the following settings: 95°C for 5 min, 30 cycles of 94°C for 30 s, 59°C for 30 s, and 72°C for 2 min, and then 72°C for 5 min. E. soli LF7 was transformed with plasmid pKD46 from MB616 using a Bio-Rad Gene Pulser Xcell (Bio-Rad, Hercules, CA) according to the manufacturer's recommendations. RedLF7iacApKD4F/R and RedLF7iacRpKD4F/R amplicons were digested with NdeI, purified (Qiaquick PCR purification kit; Qiagen), and electroporated into E. soli LF7(pKD46). The transformants were screened for growth on LB agar plates containing chloramphenicol and checked by PCR for the loss of iacA or iacR. The confirmed deletion mutants of iacA and iacR are referred to as E. soli LF7 ΔiacA::cat and E. soli LF7 ΔiacR::cat, respectively.
TABLE 2.
Strains and plasmids used in this study
| Strain or plasmid | Description | Reference or source |
|---|---|---|
| Strains | ||
| Enterobacter soli LF7 | Can utilize IAA as sole carbon source (this study) | 8 |
| Enterobacter soli LF7 ΔiacA::cat | E. soli LF7 derivative; iacA replaced with cat gene | This study |
| Enterobacter soli LF7 ΔiacR::cat | E. soli LF7 derivative; iacR replaced with cat gene | This study |
| Escherichia coli TOP10 | Cloning host | Thermo Fisher Scientific |
| Escherichia coli MB613 | Host of pKD3 harboring cat gene | 32 |
| Escherichia coli MB616 | Host of pKD46 | 32 |
| Plasmids | ||
| pPROBE′-gfp[tagless] | gfp expression vector | 10 |
| pPROBE′-gfp[LVA] | gfp[LVA] expression vector | 10 |
| pPROBE′-gfp[AAV] | gfp[AAV] expression vector | 10 |
| pPROBE′-gfp[ASV] | gfp[ASV] expression vector | 10 |
| pCR2.1TOPO | PCR amplicon cloning vector | Thermo Fisher Scientific |
| pPiacH-gfp[tagless] | PiacH fragment (F-R) fused to gfp[tagless] | This study |
| pPiacH-gfp[LVA] | PiacH fragment (F-R) fused to gfp[LVA] | This study |
| pPiacH-gfp[AAV] | PiacH fragment (F-R) fused to gfp[AAV] | This study |
| pPiacH-gfp[ASV] | PiacH fragment (F-R) fused to gfp[ASV] | This study |
| piacR-PiacH-gfp[AAV] | iacR-PiacH fragment fused to gfp[AAV] | This study |
| pPiacH-gfp[AAV]FNDR1 | PiacH subfragment (F1-R) fused to gfp[AAV] | This study |
| pPiacH-gfp[AAV]FNDR2 | PiacH subfragment (F2-R) fused to gfp[AAV] | This study |
| pPiacH-gfp[AAV]FNDR3 | PiacH subfragment (F3-R) fused to gfp[AAV] | This study |
| pPiacH-gfp[AAV]FNDR3A | PiacH subfragment (F3A-R) fused to gfp[AAV] | This study |
| pPiacH-gfp[AAV]FNDR3B4 | PiacH subfragment (F3B4-R) fused to gfp[AAV] | This study |
| pPiacH-gfp[AAV]FNDR4 | PiacH subfragment (F4-R) fused to gfp[AAV] | This study |
| pPiacH-gfp[AAV]FNDR5 | PiacH subfragment (F5-R) fused to gfp[AAV] | This study |
| pPiacH-gfp[AAV]FNDR1REV | PiacH subfragment (F-R1) fused to gfp[AAV] | This study |
| pPiacH-gfp[AAV]FNDR2REV | PiacH subfragment (F-R2) fused to gfp[AAV] | This study |
| pPiacH-gfp[AAV]FNDR3REV | PiacH subfragment (F-R3) fused to gfp[AAV] | This study |
| pPiacH-gfp[AAV]FNDR3AREV | PiacH subfragment (F-R3A) fused to gfp[AAV] | This study |
| pPiacH-gfp[AAV]FNDR3BREV | PiacH subfragment (F-R3B) fused to gfp[AAV] | This study |
| pPiacH-gfp[AAV]FNDR4REV | PiacH subfragment (F-R4) fused to gfp[AAV] | This study |
| pPiacH-gfp[AAV]FNDR5REV | PiacH subfragment (F-R5) fused to gfp[AAV] | This study |
TABLE 3.
Primers used in this study
In a typical growth experiment, LF7 or one of its derivatives (LF7 ΔiacA::cat, LF7 ΔiacR::cat, or LF7 carrying an iac plasmid construct, see below) was grown overnight at 28°C, with shaking at 250 rpm, in lysogeny broth (LB) (33) supplemented with antibiotics as appropriate. After centrifugation of overnight cultures at 2,500 × g for 5 min, the bacterial pellets were resuspended in sterile phosphate-buffered saline (PBS), centrifuged and resuspended again, and diluted 100-fold in M9 minimal medium (33) containing 12.5 mM succinate (or another carbon source), 0.2% Casamino Acids, and 6.58 μM FeSO4 and supplemented with antibiotics as appropriate. M9 cultures were incubated at 28°C, with shaking at 250 rpm. For growth on solid medium, agar was added to M9 or LB at a concentration of 1.5%. Antibiotics were added to the following final concentrations: kanamycin, 50 μg · ml−1; ampicillin, 30 μg · ml−1; chloramphenicol, 25 μg · ml−1.
RNA-Seq analysis of E. soli LF7 and E. soli LF7 ΔiacR::cat in response to IAA.
After 3 h of growth in M9 medium with succinate (see above), three replicate cultures (each) of wild-type E. soli LF7 and E. soli LF7 ΔiacR::cat were spiked with 200 μM IAA (Sigma-Aldrich, Bangalore, India), while another three replicate cultures of each strain were spiked with water (control). After 2 h of additional incubation, all 12 cultures (2 strains, with or without IAA, 3 replicates for each) were treated with 3 volumes of bacterial RNAprotect (Qiagen), followed by total RNA isolation using an RNeasy kit (Qiagen) as per the manufacturer's instructions, which included the DNase I treatment. RNA quality and concentration were checked on an Agilent Bioanalyzer prior to submission to the UC Davis Expression Analysis Core Facility for rRNA depletion, cDNA synthesis, library preparation, and sequencing using the HiSEQ4000 SR50 platform. Single-end reads (50 bp) were subjected to adapter trimming using Scythe (https://github.com/vsbuffalo/scythe), followed by base-quality trimming by sickle (https://github.com/najoshi/sickle). Bases with quality of less than 30 were trimmed, and all reads that were less than 30 bp were removed. Reads that passed quality control were queried against the SILVA rRNA database v123.1 (34) to remove rRNA contamination. The remaining reads were aligned to the E. asburiae LF7a genome (GenBank accession number NC_015968) using Rockhopper (35). The parameters were set to account for the second-strand sequencing protocol. Raw-counts data for each annotated feature in the genome were generated by Rockhopper. Genes with less than 1 count-per-million in all samples were removed prior to analysis, leaving a total of 4,582 genes. The counts were normalized using the calcNormFactors function from the edgeR package (36). Differential expression analyses were conducted using limma-voom (http://www.genomebiology.com/2014/15/2/R29). We used Softberry's online FGENESB tool (http://www.softberry.com/berry.phtml?topic=index&group=programs&subgroup=gfindb) for bacterial operon and gene prediction.
Construction of iac promoter-gfp fusion constructs.
Using primers LF7iacHProm1F and LF7iacHpromSalIR (Table 3), the intergenic region between iacR and iacH was amplified as a 480-bp fragment that stretches from 72 bp into the 3′ end of the iacR gene to 72 bp beyond the start codon of iacH. We refer to this fragment as PiacH or F-R. We also generated a series of 5′ deletion derivatives of PiacH by using primer LF7iacHpromSalIR in combination with so-called FNDR forward primers (Table 3) that targeted the iacR-iacH intergenic space in different positions and produced increasingly shorter fragments of 409, 312, 230, 211, 184, 166, or 105 bp. Similarly, we used primer LF7iacHProm1F in combination with so-called FNDRREV primers (Table 3) to generate 3′-end deletion derivatives sized 92, 191, 270, 297, 316, 335, or 394 bp. Using primers LF7MarRF2 and LF7iacHpromSalIR (Table 3), we generated an amplicon that encompasses PiacH as well as a full copy of iacR and its presumed promoter. PCRs were performed as described above. PCR products were ligated into vector pCR2.1-TOPO-TA (Thermo Fisher Scientific), transformed into E. coli TOP10, excised as an EcoRI/SalI fragment (EcoRI located in the vector, SalI located in the reverse primer), and ligated into EcoRI/SalI-digested pPROBE′-gfp[tagless], -gfp[AAV], -gfp[ASV], and/or -gfp[LVA] for transformation into E. coli TOP10 and subsequently E. soli LF7.
Flow cytometry and fluorescence microscopy.
Flow cytometry was performed on live E. soli LF7 cells harvested from M9 cultures by centrifugation at 10,000 × g for 1.5 min at 4°C and resuspended in 1 ml phosphate-buffered saline (33). Settings on the Accuri C6 flow cytometer (BD Biosciences) were as follows: “slow” speed (14 μl/min; core size, 10 μm) with an event threshold of 20,000 FSC (forward scatter), to collect 30,000 events for each sample. Fluorescence data for individual samples was exported as comma-separated value spreadsheets (Microsoft Excel), and each data point collected in the FL-1 channel (green fluorescence) was cube-root (CR) transformed into an FCR value, representing the GFP content of each individual cell. Microscopy was performed on a Zeiss Axio Imager.M2 (Carl Zeiss MicroImaging Gmbh, Göttingen, Germany) using an EC Plan-Neofluar ×100/1.30 oil objective (Zeiss) and Axiocam MRm camera (Zeiss). Light sources were a halogen 12-V 100-W lamp at 2.7 V for phase contrast imaging and a mercury vapor short-arc lamp (HBO 103W2) at 75% intensity passed through a Zeiss Filter 38 (BP 470/40, FT 495, BP525/50) to visualize GFP fluorescence. Images were captured at a 50-ms exposure time for both phase contrast and GFP channels.
Accession number(s).
Supporting RNA-Seq data have been deposited in the Gene Expression Omnibus (GEO) database (https://www.ncbi.nlm.nih.gov/geo/) and are available under accession number GSE114050.
ACKNOWLEDGMENTS
The research described here was funded from grants 2010-03544 and 2013-02075 awarded to J.H.J.L. by the United States Department of Agriculture (USDA) National Institute of Food and Agriculture (NIFA) Agriculture and Food Research Initiative (AFRI).
We thank Robin Tecon for advice on bioreporter construction and flow cytometry, Rick Bostock and Becky Parales for feedback on early draft versions of the manuscript, and Jessie Li for assistance with the generation, annotation, and interpretation of RNA-Seq data.
REFERENCES
- 1.Proctor MH. 1958. Bacterial dissimilation of indoleacetic acid: a new route of breakdown of the indole nucleus. Nature 181:1345. doi: 10.1038/1811345a0. [DOI] [PubMed] [Google Scholar]
- 2.Leveau JHJ, Gerards S. 2008. Discovery of a bacterial gene cluster for catabolism of the plant hormone indole 3-acetic acid. FEMS Microbiol Ecol 65:238–250. doi: 10.1111/j.1574-6941.2008.00436.x. [DOI] [PubMed] [Google Scholar]
- 3.Leveau JHJ, Lindow SE. 2005. Utilization of the plant hormone indole-3-acetic acid for growth by Pseudomonas putida strain 1290. Appl Environ Microbiol 71:2365–2371. doi: 10.1128/AEM.71.5.2365-2371.2005. [DOI] [PMC free article] [PubMed] [Google Scholar]
- 4.Scott JC, Greenhut IV, Leveau JH. 2013. Functional characterization of the bacterial iac genes for degradation of the plant hormone indole-3-acetic acid. J Chem Ecol 39:942–951. doi: 10.1007/s10886-013-0324-x. [DOI] [PubMed] [Google Scholar]
- 5.Lin GH, Chen HP, Huang JH, Liu TT, Lin TK, Wang SJ, Tseng CH, Shu HY. 2012. Identification and characterization of an indigo-producing oxygenase involved in indole 3-acetic acid utilization by Acinetobacter baumannii. Antonie Van Leeuwenhoek 101:881–890. doi: 10.1007/s10482-012-9704-4. [DOI] [PubMed] [Google Scholar]
- 6.Shu HY, Lin LC, Lin TK, Chen HP, Yang HH, Peng KC, Lin GH. 2015. Transcriptional regulation of the iac locus from Acinetobacter baumannii by the phytohormone indole-3-acetic acid. Antonie Van Leeuwenhoek 107:1237–1247. doi: 10.1007/s10482-015-0417-3. [DOI] [PubMed] [Google Scholar]
- 7.Donoso R, Leiva-Novoa P, Zuniga A, Timmermann T, Recabarren-Gajardo G, Gonzalez B. 2017. Biochemical and genetic bases of indole-3-acetic acid (auxin phytohormone) degradation by the plant-growth-promoting rhizobacterium Paraburkholderia phytofirmans PsJN. Appl Environ Microbiol 83:e01991-. doi: 10.1128/AEM.01991-16. [DOI] [PMC free article] [PubMed] [Google Scholar]
- 8.Manter DK, Hunter WJ, Vivanco JM. 2011. Enterobacter soli sp nov.: a lignin-degrading gamma-proteobacteria isolated from soil. Curr Microbiol 62:1044–1049. doi: 10.1007/s00284-010-9809-9. [DOI] [PubMed] [Google Scholar]
- 9.Hinsa SM, Espinosa-Urgel M, Ramos JL, O'Toole GA. 2003. Transition from reversible to irreversible attachment during biofilm formation by Pseudomonas fluorescens WCS365 requires an ABC transporter and a large secreted protein. Mol Microbiol 49:905–918. doi: 10.1046/j.1365-2958.2003.03615.x. [DOI] [PubMed] [Google Scholar]
- 10.Miller WG, Leveau JH, Lindow SE. 2000. Improved gfp and inaZ broad-host-range promoter-probe vectors. Mol Plant Microbe Interact 13:1243–1250. doi: 10.1094/MPMI.2000.13.11.1243. [DOI] [PubMed] [Google Scholar]
- 11.Klucar L, Stano M, Hajduk M. 2010. phiSITE: database of gene regulation in bacteriophages. Nucleic Acids Res 38:D366–D370. doi: 10.1093/nar/gkp911. [DOI] [PMC free article] [PubMed] [Google Scholar]
- 12.Grove A. 2013. MarR family transcription factors. Curr Biol 23:R142–R143. doi: 10.1016/j.cub.2013.01.013. [DOI] [PubMed] [Google Scholar]
- 13.Frommel MI, Nowak J, Lazarovits G. 1991. Growth enhancement and developmental modifications of in vitro grown potato (Solanum tuberosum spp. tuberosum) as affected by a nonfluorescent Pseudomonas sp. Plant Physiol 96:928–936. doi: 10.1104/pp.96.3.928. [DOI] [PMC free article] [PubMed] [Google Scholar]
- 14.Hugh R, Reese R. 1968. A comparison of 120 strains of Bacterium anitratum Schaub and Hauber with the type strain of this species. Int J Syst Evol Microbiol 18:207–229. doi: 10.1099/00207713-18-3-207. [DOI] [Google Scholar]
- 15.Anderson GM, Purdy WC. 1979. Liquid chromatographic-fluorometric system for the determination of indoles in physiological samples. Anal Chem 51:283–286. doi: 10.1021/ac50038a030. [DOI] [PubMed] [Google Scholar]
- 16.Bandurski RS, Schulze A. 1977. Concentration of indole-3-acetic acid and its derivatives in plants. Plant Physiol 60:211–213. doi: 10.1104/pp.60.2.211. [DOI] [PMC free article] [PubMed] [Google Scholar]
- 17.Martens DA, Frankenberger WTJ. 1993. Stability of microbial-produced auxins derived from l-tryptophan added to soil. Soil Sci 155:263–271. doi: 10.1097/00010694-199304000-00005. [DOI] [Google Scholar]
- 18.Szajdak L, Maryganova V. 2007. Occurrence of IAA auxin in some organic soils. Agron Res 5:175–187. [Google Scholar]
- 19.Spaepen S, Vanderleyden J. 2011. Auxin and plant-microbe interactions. Cold Spring Harb Perspect Biol 3:a001438. doi: 10.1101/cshperspect.a001438. [DOI] [PMC free article] [PubMed] [Google Scholar]
- 20.Bianco C, Imperlini E, Calogero R, Senatore B, Amoresano A, Carpentieri A, Pucci P, Defez R. 2006. Indole-3-acetic acid improves Escherichia coli's defences to stress. Arch Microbiol 185:373–382. doi: 10.1007/s00203-006-0103-y. [DOI] [PubMed] [Google Scholar]
- 21.Yuan ZC, Haudecoeur E, Faure D, Kerr KF, Nester EW. 2008. Comparative transcriptome analysis of Agrobacterium tumefaciens in response to plant signal salicylic acid, indole-3-acetic acid and gamma-amino butyric acid reveals signalling cross-talk and Agrobacterium–plant co-evolution. Cell Microbiol 10:2339–2354. doi: 10.1111/j.1462-5822.2008.01215.x. [DOI] [PubMed] [Google Scholar]
- 22.Van Puyvelde S, Cloots L, Engelen K, Das F, Marchal K, Vanderleyden J, Spaepen S. 2011. Transcriptome analysis of the rhizosphere bacterium Azospirillum brasilense reveals an extensive auxin response. Microb Ecol 61:723–728. doi: 10.1007/s00248-011-9819-6. [DOI] [PubMed] [Google Scholar]
- 23.Donati AJ, Lee HI, Leveau JH, Chang WS. 2013. Effects of indole-3-acetic acid on the transcriptional activities and stress tolerance of Bradyrhizobium japonicum. PLoS One 8:e76559. doi: 10.1371/journal.pone.0076559. [DOI] [PMC free article] [PubMed] [Google Scholar]
- 24.Leveau JH, Lindow SE. 2002. Bioreporters in microbial ecology. Curr Opin Microbiol 5:259–265. doi: 10.1016/S1369-5274(02)00321-1. [DOI] [PubMed] [Google Scholar]
- 25.Brandl MT, Quinones B, Lindow SE. 2001. Heterogeneous transcription of an indoleacetic acid biosynthetic gene in Erwinia herbicola on plant surfaces. Proc Natl Acad Sci U S A 98:3454–3459. doi: 10.1073/pnas.061014498. [DOI] [PMC free article] [PubMed] [Google Scholar]
- 26.Pérez-Pantoja D, De la Iglesia R, Pieper DH, Gonzalez B. 2008. Metabolic reconstruction of aromatic compounds degradation from the genome of the amazing pollutant-degrading bacterium Cupriavidus necator JMP134. FEMS Microbiol Rev 32:736–794. doi: 10.1111/j.1574-6976.2008.00122.x. [DOI] [PubMed] [Google Scholar]
- 27.Yuk KJ, Kim YT, Huh CS, Lee JH. 2018. Lelliottia jeotgali sp. nov., isolated from a traditional Korean fermented clam. Int J Syst Evol Microbiol 68:1725–1731. doi: 10.1099/ijsem.0.002737. [DOI] [PubMed] [Google Scholar]
- 28.Weingarten RA, Johnson RC, Conlan S, Ramsburg AM, Dekker JP, Lau AF, Khil P, Odom RT, Deming C, Park M, Thomas PJ, NISC Comparative Sequencing Program, Henderson DK, Palmore TN, Segre JA, Frank KM. 2018. Genomic analysis of hospital plumbing reveals diverse reservoir of bacterial plasmids conferring carbapenem resistance. mBio 9:e02011-. doi: 10.1128/mBio.02011-17. [DOI] [PMC free article] [PubMed] [Google Scholar]
- 29.DeDonder KD, Apley MD, Li M, Gehring R, Harhay DM, Lubbers BV, White BJ, Capik SF, KuKanich B, Riviere JE, Tessman RK. 2016. Pharmacokinetics and pharmacodynamics of gamithromycin in pulmonary epithelial lining fluid in naturally occurring bovine respiratory disease in multisource commingled feedlot cattle. J Vet Pharmacol Ther 39:157–166. doi: 10.1111/jvp.12267. [DOI] [PubMed] [Google Scholar]
- 30.Ebenau-Jehle C, Thomas M, Scharf G, Kockelkorn D, Knapp B, Schuhle K, Heider J, Fuchs G. 2012. Anaerobic metabolism of indoleacetate. J Bacteriol 194:2894–2903. doi: 10.1128/JB.00250-12. [DOI] [PMC free article] [PubMed] [Google Scholar]
- 31.Rabus R, Widdel F. 1995. Anaerobic degradation of ethylbenzene and other aromatic hydrocarbons by new denitrifying bacteria. Arch Microbiol 163:96–103. doi: 10.1007/BF00381782. [DOI] [PubMed] [Google Scholar]
- 32.Datsenko KA, Wanner BL. 2000. One-step inactivation of chromosomal genes in Escherichia coli K-12 using PCR products. Proc Natl Acad Sci U S A 97:6640–6645. doi: 10.1073/pnas.120163297. [DOI] [PMC free article] [PubMed] [Google Scholar]
- 33.Sambrook J, Russell DW. 2001. Molecular cloning: a laboratory manual, 3rd ed Cold Spring Harbor Laboratory Press, Cold Spring Harbor, NY. [Google Scholar]
- 34.Quast C, Pruesse E, Yilmaz P, Gerken J, Schweer T, Yarza P, Peplies J, Glockner FO. 2013. The SILVA ribosomal RNA gene database project: improved data processing and web-based tools. Nucleic Acids Res 41:D590–D596. doi: 10.1093/nar/gks1219. [DOI] [PMC free article] [PubMed] [Google Scholar]
- 35.McClure R, Balasubramanian D, Sun Y, Bobrovskyy M, Sumby P, Genco CA, Vanderpool CK, Tjaden B. 2013. Computational analysis of bacterial RNA-Seq data. Nucleic Acids Res 41:e140. doi: 10.1093/nar/gkt444. [DOI] [PMC free article] [PubMed] [Google Scholar]
- 36.Robinson MD, McCarthy DJ, Smyth GK. 2010. edgeR: a Bioconductor package for differential expression analysis of digital gene expression data. Bioinformatics 26:139–140. doi: 10.1093/bioinformatics/btp616. [DOI] [PMC free article] [PubMed] [Google Scholar]


