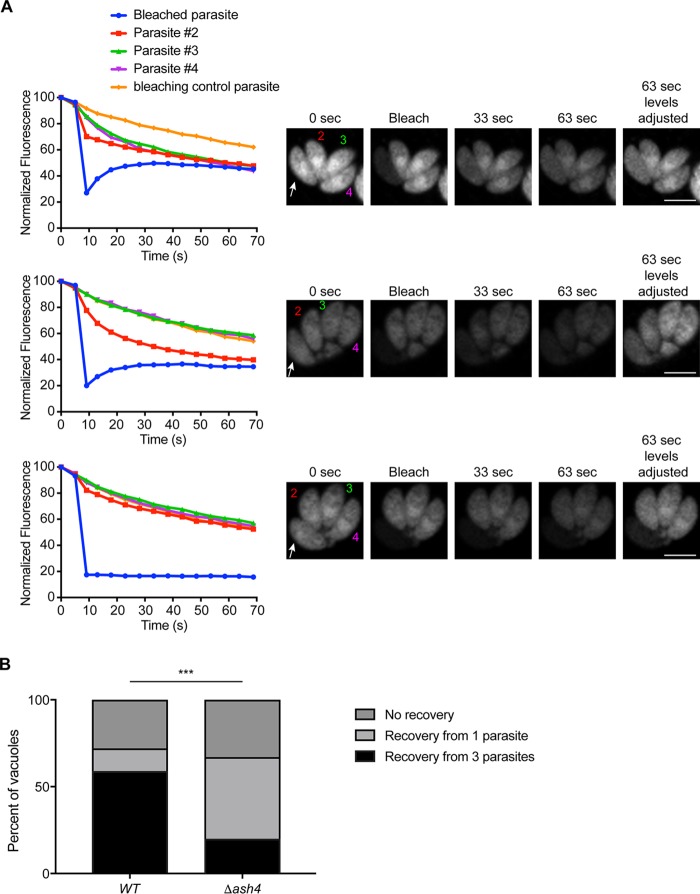
FIG 5.
The majority of Δash4 parasites are ordered in pairs. (A) Fluorescence recovery after photobleaching (FRAP) assays for wild-type and Δash4 parasites. The top graph is representative of the data that result when a bleached parasite (white arrow; blue line in graph) recovers from all of the parasites in a vacuole (numbered parasites; distributed recovery). The middle graph shows data that are representative of recovery from a single parasite (single recovery). The bottom graph is representative of a parasite with no recovery. Graphs show the normalized fluorescence of each parasite in the vacuole, with an orange line depicting the normalized fluorescence of a parasite in a separate vacuole to indicate photobleaching due to imaging. Images at the right are representative of the results seen in the graphs and at various time points after bleaching of a single parasite as indicated. (B) Graph of the percentage of parasites that recovered by each of the three recovery types described in the panel A legend for wild-type and Δash4 parasites. At least 30 vacuoles were counted for each strain. Statistical significance was calculated by the chi-square test using raw count numbers. ***, P < 0.001.

