

Abstract
Native AMPA receptors (AMPARs) exhibit rapid and profound desensitization in the sustained presence of glutamate. Desensitization therefore contributes to short-term depression at synapses in which glutamate accumulates. At synapses that do not exhibit desensitization-dependent depression, AMPARs are thought to be protected against prolonged or repetitive exposure to synaptically released glutamate. At the cerebellar mossy fiber to granule cell (GC) synapse, in which high release probability and glutamate spillover produce a substantial buildup of glutamate concentration in the cleft ([Glut]cleft) during high-frequency transmission, only moderate desensitization of the phasic AMPAR EPSC occurs. To investigate how such currents are produced, we examined the kinetic properties of synaptic AMPARs in GCs using glutamate uncaging. Photolysis of 4-methoxy-7-nitroindolinyl-caged l-glutamate with large illumination spots produced step-like increases in [Glut]cleft that could be used to systematically probe AMPAR kinetics. At low levels of activation, synaptic AMPARs exhibited little desensitization. With larger activations, the desensitization time course became faster, but the level of desensitization was only weakly dependent on receptor occupancy. Indeed, a substantial desensitization-resistant current component remained (17%) in saturating glutamate. Photolysis with small illumination spots produced brief [Glut]cleft waveforms and transient AMPAR activations, similar to the EPSC current components. Paired-pulse uncaging with such spots revealed little desensitization after spillover-like activations and modest depression after activations that mimicked quantal and spillover components together. Our results show that GC AMPARs exhibit a resistance to desensitization at low occupancies and that this property is crucial for sustaining high-frequency transmission at a synapse in which glutamate accumulates.
Keywords: synapse, spillover, AMPA receptor, cerebellum, desensitization, glutamate receptor
Introduction
AMPA receptor (AMPAR) desensitization contributes to short-term depression (STD) of the EPSC at various synaptic connections in auditory brainstem, striatum, cerebellum, thalamus, and cortex (Hestrin, 1993; Trussell et al., 1993; Isaacson and Walmsley, 1996; Carter and Regehr, 2000; Rozov et al., 2001; Chen et al., 2002; Wong et al., 2003; Xu-Friedman and Regehr, 2004; Wall, 2005; Akopian and Walsh, 2007; Crowley et al., 2007). However, at many other synapses, desensitization does not influence STD (Dobrunz et al., 1997; Dittman and Regehr, 1998; Silver et al., 1998; Hjelmstad et al., 1999; Renden et al., 2005). Although it is unclear what determines the level of desensitization at a particular synapse, it is thought to be influenced by two factors: (1) the amplitude and time course of glutamate concentration in the cleft ([Glut]cleft), and (2) the kinetic properties of AMPARs (Jones and Westbrook, 1996; Jonas, 2000).
AMPAR deactivation and desensitization rates vary over a 10-fold range across preparations (Hestrin, 1993; Raman et al., 1994; Geiger et al., 1995), contributing to the wide range of observed EPSC time courses (Jonas, 2000). However, all native AMPARs characterized to date desensitize profoundly in saturating glutamate (>95%: Colquhoun et al., 1992; Geiger et al., 1995; Hausser and Roth, 1997; Jahn et al., 1998; except Hilar mossy cells, 90%: Geiger et al., 1995). Desensitization also occurs at low concentrations because of an apparent affinity in the micromolar range (Trussell and Fischbach, 1989; Colquhoun et al., 1992; Raman and Trussell, 1992; Hausser and Roth, 1997). At glomerular and calyceal structures, modeling and experimental studies have proposed that slow [Glut]cleft waveforms arising from spillover preferentially desensitize AMPARs (Otis et al., 1996a; Xu-Friedman and Regehr, 2003; Taschenberger et al., 2005). At the cerebellar mossy fiber (MF)–granule cell (GC) synapse, the factors determining [Glut]cleft have been well characterized and favor prolonged activation of AMPARs: high release probability (Sargent et al., 2005), rapid replenishment of releasable vesicles (Saviane and Silver, 2006), and pronounced glutamate spillover (DiGregorio et al., 2002; Nielsen et al., 2004). However, high-frequency stimuli produce only a modest desensitization of the EPSC (Saviane and Silver, 2006). This is surprising given the rapid and profound desensitization observed in immature cultured GCs (Silver et al., 1996a; Wall et al., 2002), raising the question of how the properties of synaptic AMPARs enable this high-frequency signaling.
Because the AMPARs that give rise to the EPSC (Cathala et al., 2005) are not present on the GC soma (Silver et al., 1996a; Smith et al., 2000) and are therefore inaccessible to conventional outside-out patch methods, we used glutamate uncaging to examine their properties. This has the advantage that the AMPARs are in the same state as for synaptic activation, e.g., phosphorylation state (Greengard et al., 1991), subunit and splice variant composition (Cull-Candy et al., 2006), and binding to AMPAR-associated proteins (Priel et al., 2005; Tomita et al., 2005). Our results demonstrate that synaptic AMPARs on GCs exhibit a relatively low level of desensitization at occupancies that occur during synaptic transmission and do not fully desensitize even in saturating glutamate. We show that these distinct desensitization properties of GC AMPARs underlie their ability to transform quantal release into fast EPSCs with modest STD and convert the sustained spillover [Glut]cleft into tonic currents during high-frequency stimulus trains.
Materials and Methods
Recording conditions.
Parasagittal slices of cerebellum were prepared from 25- to 35-d-old Sprague Dawley rats (mean, 27.2 ± 0.3 postnatal days; n = 86) as described previously (Silver et al., 1996b; Nielsen et al., 2004). The external solution contained the following (in mm): 125 NaCl, 2.5 KCl, 2 CaCl2, 1 MgCl2, 1.25 NaH2PO4, 26 NaHCO3, and 25 glucose, pH 7.3. Fire-polished patch electrodes were backfilled with the following internal solution (in mm): 100 K-MeSO4, 40 HEPES, 6 NaOH, 5 EGTA, 1.78 CaCl2, 4 MgCl2, 0.3 NaGTP, 4 NaATP, and 10 μm Alexa 594. Tip resistances were 5–10 MΩ. Whole-cell voltage-clamp recordings were made from GCs at −70 to −80 mV at near physiological temperature 35.9 ± 0.1°C (n = 86) in the presence of 10 μm APV and 20 μm 7-chlorokynurenic acid (Tocris Bioscience, Bristol, UK) to isolate non-NMDA receptor currents. SR 95531 [2-(3-carboxypropyl)-3-amino-6-(4-methoxyphenyl)pyridazinium bromide] at 10 μm was added to block GABAA receptors in some experiments, and 50 μm GYKI 53655 [1-(4-aminophenyl)-3-methylcarbamyl-4-methyl7,8-methylenedioxy-3,4-dihydro-5H-2,3-benzodiazepine] (Sigma, St. Louis, MO) was used to confirm that the photolysis evoked EPSC (pEPSC) was mediated by AMPARs (supplemental Fig. 1, available at www.jneurosci.org as supplemental material) as shown previously for synaptic currents (DiGregorio et al., 2002). GCs were identified on the basis of their capacitance (<5 pF; mean, 2.35 ± 0.26; n = 83). Series resistance was 21 ± 1 MΩ (n = 86), giving an electrode-cell filter frequency of 4.1 kHz. The junction potential of −6.3 mV was corrected when stated. The caged compound 4-methoxy-7-nitroindolinyl-caged l-glutamate (MNI-glutamate) [gift from Dr. John Corrie (Mill Hill, London, UK National Institute for Medical Research) or purchased from Tocris Biosciences] at 10 mm was locally perfused via patch pipettes with 2–3 μm tip diameters. The perfusion solution contained (in mm): 110 NaCl, 2.5 KCl, 40 HEPES, 2 CaCl2, 1 MgCl2, 1.25 NaH2PO4, 2 NaHCO3, 25 glucose, and 50 μm APV (titrated to a pH of 7.3 after adding MNI-glutamate). Alexa 488 at 50 μm was added to the solution to visualize the perfusion plume. Bath perfusion of 10 mm MNI-glutamate had no significant effect on the amplitude, time course, and frequency of mEPSCs, or holding current (p > 0.1; n = 4). pEPSCs were recorded with an Axopatch 200B amplifier (Molecular Devices, Palo Alto, CA), filtered at 10 kHz, and digitized at 150 kHz using an analog-to-digital converter (ADC) board (model 6052E; National Instruments, Austin, TX) and Nclamp software (available from www.neuromatic.thinkrandom.com/).
Optical imaging and uncaging.
The custom photolysis system was built in collaboration with Prairie Technologies (Middleton, WI) on an upright microscope (Olympus Optical, Tokyo, Japan). The beam from a continuous mode argon laser (model I328; Coherent, Santa Clara, CA) was modulated with an acousto-optic tunable filter (AOTF); (Neos Technologies, Melbourne, FL), gated by a hard shutter (to completely block residual UV excitation; Uniblitz, Rochester, NY), and passed through a 364 nm bandpass filter. The UV beam was focused onto a single-mode optical fiber (Oz Optics, Ottawa, Ontario, Canada), which delivered the light to the microscope. An aspheric lens was used to either fill the back aperture of a 100×, 1.0 numerical aperture (NA) dipping objective (Olympus Optical) to form a diffraction-limited small spot or focused onto a small area of the back aperture of a 60×, 0.9 NA objective (Olympus Optical) to form a large spot in the focal plane of the objective. The UV laser light was coupled into the image path using a 400 nm long-pass dichroic mirror between the objective and the visible epifluorescence dichroics. The whole lens/fiber system was adjusted with respect to a second tube lens to align the UV spot to the focal plane of the visible wavelengths. The UV spot was positioned in the specimen plane in a “point and shoot” manner using the fluorescence CCD image as a reference and computer-controlled stepper motors to move the output of the fiber in the x and y directions (Prairie Technologies). The AOTF and hard shutter were controlled via a 1 MHz digital-to-analog converter (model 6713; National Instruments), whose output clock was linked to the clock of the ADC, to synchronize the illumination pulse and voltage-clamp acquisition.
Estimation of the UV spot size and intensity.
Fluorescent beads (Invitrogen, Carlsbad, CA), 110 nm, were suspended in agar (diluted 1:500 into a 5% agar solution at <50°C and left to cool). The lateral dimensions of the small-spot illumination volume were estimated by measuring the fluorescence from a 110 nm bead as the focused UV spot was stepped across in 50 nm increments. At each location, 10 ms exposures of UV light produced step changes in fluorescence that were detected with a cooled avalanche photodiode and patch-clamp amplifier (Photomax; Dagan, Minneapolis, MN). The axial resolution was estimated similarly but by adjusting the focus in 200 nm increments. The three-dimensional (3D) illumination point spread function (iPSF) was estimated by fitting the averaged axial intensity profile with the diffraction integral representation of a high NA objective using a sin2x series function to account for spherical aberrations (Sheppard and Török, 1997; C. Sheppard, personal communication). To measure the size of the large spot, fluorescent bead “monolayers” were prepared by diluting 110 nm fluorescent beads 1:500 in 95% ethanol, followed by vortexing, and then sonication for 5–10 min. One to 2 μl were then smeared onto a coverslip and left to dry at room temperature for 10–30 min. A homogenous region of the slide was chosen with a covering of beads a few layers thick, and the fluorescence arising from the large-spot illumination was imaged using the cooled CCD camera. The laser power at the preparation was estimated routinely using a fluorescent solution (10 μm fluorescein and 20 mm HEPES, pH 8.0), which was calibrated to the measured laser output from the objective using a power meter. For experiments not associated with a measurement, light levels were estimated by linear interpolation.
Data analysis.
Data analysis was performed using the Neuromatic analysis package (www.neuromatic.thinkrandom.com/) and custom routines within the Igor Pro environment (WaveMetrics, Lake Oswego, OR). Peak amplitudes and rise times were measured from traces after digital filtering with a binomial smoothing routine (3–6 kHz Gaussian filter). Traces were baselined using a 1 ms window before the uncaging pulse. pEPSC amplitudes were averaged over a 100 μs window at the peak of the largest current in a particular scan. For paired-pulse experiments, the amplitude of the second pulse was measured from the baseline (i.e., without subtraction of the current from the first trace). In some cases, the peak amplitude and rise time of the pEPSC were determined by fitting an empirical function that describes well the rising phase and dual-exponential decay of the currents as described previously (Nielsen et al., 2004):
 |
Normalized integrals were calculated by scaling the current peak amplitudes to one and then calculating the integral over a 9 ms window after the peak, unless otherwise stated. Steady-state current (Iss) values were calculated from the fit of pEPSCs with Equation 1. Those cells in which the current slowly increased over a 100 ms window were excluded from the analysis of Iss (4 of 20 cells), to ensure that distant receptors did not distort our measurements. Only the saturated pEPSCs evoked with the large illumination spot were corrected for the voltage drop across the pipette. Nonstationary fluctuation analysis (NSFA) of the pEPSCs was performed using a pairwise overlapping method (Heinemann and Conti, 1992). Currents were baselined 15–30 ms before the UV pulse, and the baseline variance was measured over the same window. Consecutive evoked currents were determined to be stable if the amplitude over a 100–200 μs window passed a Spearman's rank correlation test (Silver et al., 1996b). A similar test of the 10–90% rise times was used. Following this strict stability criterion, 9–40 pEPSCs per spot location were analyzed without additional off-line filtering. The mean and variance were calculated for 10 equal current bins. The binned mean versus variance plots were fit with a binomial equation. The fit was weighted by the theoretical estimate of the error in the variance (Heinemann and Conti, 1992) and only accepted if the fit was significant (χ2 statistic smaller than the threshold for rejection, p = 0.05). The single-channel conductance was calculated, accounting for the junction potential, assuming an AMPAR reversal potential of 0 mV.
The time course of desensitization was quantified by fitting the decay of the large-spot pEPSC with a single-exponential function with a y offset (see Fig. 3C, inset). Although these fits were good, we also fit the pEPSC with dual-exponential functions to compare fast components of desensitization with the decay of the miniature EPSC (mEPSC) (Wall et al., 2002). At half-maximal activation, pEPSCs from 12 of 20 cells were better fit with a double-exponential function. On average, the fast time constant was 1.9 ms with relative amplitude 0.80 (n = 20), whereas the slow time constant was 6.1 ms (n = 12); values of single-exponential fits were lumped with the fast time constants. For saturated pEPSCs, the fast time constant was 0.9 ms with relative amplitude 0.80 (n = 18) and slow time constant 4.7 ms (n = 16); only 2 of 18 cells converged to a single exponential. Although the fast component of the saturated large-spot pEPSCs approached the time course of the saturated small-spot pEPSC, raising the possibility that desensitization could be limiting in some recordings, it was still more than twofold too slow to account for the mEPSC decay.
Figure 3.

Kinetic properties of synaptic AMPARs at various receptor occupancies. A, Normalized traces from Figure 2A and their fit to an empirical rising and decaying function (Eq. 1). B, Relationship between 10–90% rise time (R.T.) of the pEPSCs and fraction of saturated current for each cell (Norm pEPSC; n = 20). Only pEPSCs activated with brief illumination durations were used (≤200 μs; x and y error bars indicate SEM). The solid line is an exponential fit using a floating offset. Dashed line indicates the limiting value (i.e., the last value corresponding to the last data point). C, Relationship between the decay time constant of pEPSC and normalized pEPSC activated with brief illumination pulses (≤200 μs; n = 20). Solid line is a single-exponential fit to the data points, and the dashed line shows the limiting decay time constant. Inset shows an example of a single-exponential fit (black) to the decay of a large-spot pEPSC. D, Relationship between the fractional steady-state current (Iss/Ipeak) at 18 ms after the light pulse (filled circles) and the peak amplitude of the normalized pEPSCs (n = 16). The solid line is an exponential fit to the data. The long dashed line shows the limiting value of Iss/Ipeak calculated from the last two 18 ms points. Color symbols represent the Iss/Ipeak measured at 10 times decay time constant for the three native AMPAR model simulations in response to step changes in [Glut]. WJ is Wadiche and Jahr (Wadiche and Jahr, 2001), RT is Raman and Trussel (Raman and Trussell, 1995), and JMS2 is Jonas, Major, and Sakmann scheme 2 (Jonas et al., 1993). For these simulations [Glut] values were adjusted to reproduce the range of fractional activation of the GC experimental data.
CCD images were analyzed using ImageTool (University of Texas Health Science, San Antonio, TX). Small-spot line profiles were set to 3 pixels thick (95 nm/pixel) and lengths corresponding to the uncaging line scans. The spatial profile of the large-spot pEPSC was determined by making seven equidistant spot measurements along the dendritic axis or orthogonal to it. Data were pooled by fitting individual profiles with a Gaussian function and aligning on the peak of the fit. Once aligned and normalized, the pooled data from each axis were refit with a Gaussian function to determine the spatial profile. All values are expressed ± SEM unless otherwise stated.
Numerical simulations of glutamate uncaging and quantal release.
Numerical simulations were performed with D3D, an in-house diffusion simulator based on an explicit finite difference method (Nielsen et al., 2004). The MF–GC contact area comprised 11 × 11 dendritic digits, each 600 nm in width (Xu-Friedman and Regehr, 2003) spaced 20 nm apart and 1.24 μm long (Nielsen et al., 2004). The dendritic digits were bordered by GC bodies represented by 7 μm cubes. For the small-spot simulations, the GC layer only extended above the synaptic area, giving a simulation volume of 6.48 × 6.48 × 4.28 μm (x × y × z dimensions). For the large-spot simulations, GCs were added laterally around the synaptic area, expanding the simulation volume to 28.08 × 28.08 × 2.28 μm. To reduce simulation time, we reduced the depth of the diffusional space and simulated one-quarter of the entire space to take advantage of symmetry. The diffusion coefficient of glutamate was set to 0.33 μm2 ms−1 (Nielsen et al., 2004), and MNI-glutamate was set to 0.25 μm2 ms−1 [estimated from (MWglut)1/3/(MWMNI)1/3 × Dglut].
To simulate photolysis-evoked glutamate transients, we collapsed the uncaging reaction to a simple first-order reaction scheme, because the dark reaction is fast (<1 μs) (Morrison et al., 2002). MNI-glutamate was converted to free glutamate using a light-dependent rate constant. We set the caged concentration to 8 mm, based on a 20% dilution effect of local perfusion (Dittman and Regehr, 1997). The reaction rates were implemented in the 3D diffusional space according to a spatial weighting set by the illumination function. For the small-spot simulations, the measured light intensity was distributed according to the relative intensity values of the measured iPSF. For the large-spot simulations, the light distribution intensity was simulated as a cylinder with 2D Gaussian profile [full-width at half-maximum (FWHM) of 9.2 μm] centered on the MF–GC contact area. The duration of the uncaging reaction was set to the values used in the experiments (20 μs to 1 ms). To estimate the glutamate and MNI-glutamate experienced by the receptors in a postsynaptic density (PSD), concentrations were averaged over a 200 × 200 × 20 nm volume at various locations in which dendritic digits contacted the MF. The mean glutamate concentration across the glomerulus was estimated by weighting the simulated concentration waveforms, detected at various distances (center of each digit) from the center, by their relative area over 200-nm-wide rings.
Simulations of AMPAR responses to trains of synaptic activation.
Trains of synaptic glutamate release and spillover were simulated in a geometry identical to previous simulations (Nielsen et al., 2004). Stochastic quantal release variables were generated using the uniform random number routine (“enoise”) of Igor Pro. To mimic the presynaptic component of STD, we used the following release probabilities: 0.61, 0.52, 0.48, 0.47, and 0.47 for the initial five pulses and then 0.46 for the remaining pulses (Saviane and Silver, 2006). The number of glutamate molecules per vesicle (4000) was chosen to produce a receptor activation ∼50%, because this corresponds to our estimate of AMPAR activation (see below). The contribution of uptake and long-range diffusion was implemented at the outer edges of the diffusional space using a removal rate of 0.2 ms−1 per simulation voxel. This value produced a 21 ms slow decay of glutamate similar to the slow decay in the EPSC (DiGregorio et al., 2002). This method also predicted well the current ratio in the presence and absence of dl-threo-β-benzyloxyaspartic acid (DiGregorio et al., 2002). AMPAR kinetic schemes were implemented as described previously (Nielsen et al., 2004), except they were not adjusted to 37°C. This preserved their original behavior, because adjusting the rate constants for elevated temperature generally increased the amount of the depression within the train.
Estimation of photolysis-evoked glutamate concentration and time course.
The probability of uncaging was estimated from the following equation based on that used by Lowe (Lowe, 2003): Pu = σ × ΦMNI × Es/ξλ, where the absorption cross section is σ = 2.303 × εMNI/Nav, and the cross-sectional energy at the focal point is Es = ρ × Tp/A. εMNI and ΦMNI are the extinction coefficients (4300 cm/m) and the quantum yield (0.085) of MNI-glutamate, respectively (Papageorgiou, 2000). ξλ is the photon energy of 364 nm light. Nav is Avogadro's number. ρ is the power exiting the microscope objective, Tp is the duration of the light pulse, and A is the area of the illumination at the focal plane (assuming circular radius of 1/e2 of a Gaussian fit to the PSF of 195 nm). For a 20 μs pulse of low laser power (15 μW), we predict an uncaging probability of 0.75 in the small spot, which, when multiplied by the MNI-glutamate concentration, is ∼6 mm peak concentration (compare with Fig. 6D, blue trace, k = 100 ms−1). This calculation assumes linearity of the uncaging reaction and does not account for diffusion. It is likely that, with higher light levels (200–400 μW), the uncaging reaction is saturated and [Glut] reaches levels close to the concentration of MNI-glutamate in the slice (8 mm).
Figure 6.
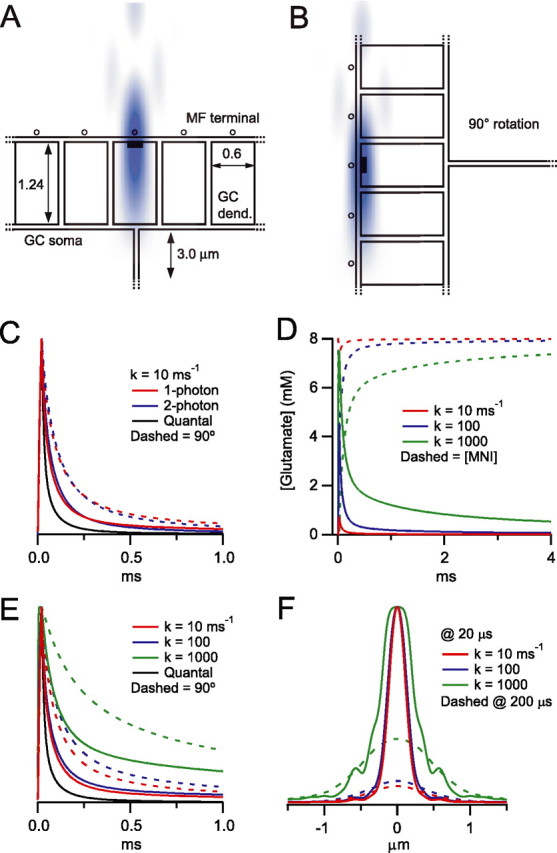
Numerical simulations of single-photon and two-photon diffraction-limited uncaging within a simplified 3D MF–GC structure. A, Cross section (x–z plane) of part of the MF–GC diffusional space and the superimposed small diffraction-limited UV iPSF (blue) used for small-spot simulations. Glutamate uncaging and diffusion occurred in the space between dendritic digits, GC soma, and the MFs (20 nm wide). Black rectangle indicates 200 nm PSD. Open circles represent MF synaptic vesicles. B, Diffusional space rotated by 90° with respect to the iPSF used to estimate the extreme condition when the long axis of iPSF is parallel to the synaptic cleft. C, Simulated photolysis-evoked [Glut]cleft transients for a brief illumination pulse (20 μs) using the measured one-photon iPSF (from Fig. 4B; red) and a simulated two-photon excitation volume (blue). The two-photon excitation volume was approximated by a 3D Gaussian function with lateral and axial dimensions corresponding to the minimum theoretical values for 720 nm light (FWHMs of 276 and 995 nm; NA 1.0) (Zipfel et al., 2003). Solid traces are simulations when the iPSF orientation is as in A, and dashed lines are when the iPSF is rotated 90° as in B. The black trace is the simulated quantal [Glut]cleft decay waveform arising from the instantaneous release of 4000 glutamate molecules (Nielsen et al., 2004) aligned to start at the end of the illumination pulse. All traces are normalized to their peak values. D, Simulated one-photon iPSF photolysis-evoked [Glut]cleft transients (solid lines) and [MNI-glutamate]cleft (dashed lines) for three different uncaging rate constants (k), using a 20 μs uncaging duration. E, Peak normalized simulated [Glut]cleft transients from D (solid lines) and simulations for the 90° rotation (dashed lines). Black trace is the simulated quantal [Glut]cleft time course as in C. F, Spatial profile of the [Glut] at the end of a 20 μs uncaging pulse for the upright spot orientation and different values of k (FWHM of 0.27, 0.30, and 0.49 μm for increasing uncaging rates, respectively). Dashed lines are the predicted spatial profiles at 200 μs after the start of the uncaging pulse, which are scaled to their corresponding peak amplitude at 20 μs (the color code is preserved; 0.90, 0.94, and 1.15 μm for increasing uncaging rates, respectively).
Results
Generating step-like glutamate concentration waveforms using UV photolysis of caged glutamate
Desensitization is defined as the decay in the receptor response in the continued presence of agonist. AMPAR desensitization has been measured previously in outside-out patches by rapidly applying glutamate in a step-like manner. However, AMPARs in mature GCs are located within the PSDs (DiGregorio et al., 2002; Cathala et al., 2005), with little or no expression on the soma (Silver et al., 1996a; Smith et al., 2000), making them inaccessible to this technique. Previous studies circumvented this problem by using immature cultured GCs that do express non-NMDA receptors on their soma (Silver et al., 1996a; Wall et al., 2002), but these cultures form aberrant GC–GC synaptic connections not seen in vivo and express non-NMDA receptors with a wider range of conductances than observed at the MF–GC synapse (Silver et al., 1996a; Cathala et al., 2005), raising the possibility that the AMPARs expressed are different. We therefore used glutamate uncaging to study GC AMPAR properties within the synaptic environment in acute slices. To study the properties of AMPAR desensitization, it was first necessary to generate a step change in [Glut]cleft. Because the time required for diffusion to clear glutamate depends on its spatial extent, we used an optical configuration (Fig. 1A) that produced a relatively large (∼10 μm) collimated UV laser beam to uncage MNI-glutamate (Fig. 1B). Simulations of uncaging and glutamate diffusion predicted that [Glut]cleft waveforms increased during the light pulse and decayed slowly because of the slow clearance of glutamate from the large spot (Fig. 1C). Predicted [Glut]cleft waveforms averaged across the glomerulus decayed to 84% of their peak value by 20 ms and are therefore approximately “step-like” on the EPSC timescale.
Figure 1.
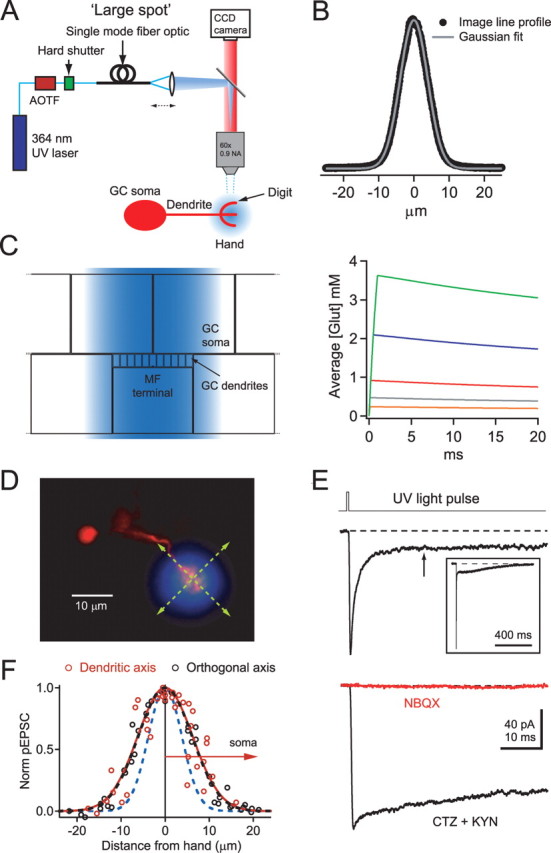
Glutamate uncaging with a large UV illumination spot produces step-like glutamate concentration changes. A, Simplified optical configurations for the large UV illumination spot with a diagram of a GC soma, dendrite, “hand,” and “digit.” A large collimated illumination spot was generated by coupling a UV laser beam into a single-mode fiber optic whose output was focused at the back aperture of the objective. B, Intensity profile for the large UV spot measured from a CCD image of fluorescence produced by illuminating a monolayer of beads. The gray trace shows a fit to a Gaussian function. C, Schematic diagram showing an x–z cross section through part of the extended diffusional space and large-spot illumination profile (blue) used for large-spot uncaging simulations. Right is simulated [Glut]cleft transients produced by large-spot illumination for various uncaging durations and intensities (0.1 ms for an uncaging rate k = 0.37 ms−1, and 0.1–1 ms for k = 0.73 ms−1). Traces represent spatial averages over the glomerulus calculated from five PSD measurements at equal distances from the center to the edge and their corresponding radial areas (200-nm-wide rings). D, Fluorescence image of the soma and dendrite of a GC with a semitransparent image of the large UV spot superimposed. Green lines illustrate scan directions in F. E, pEPSC evoked using the large UV spot and 0.5 ms pulse duration. Inset shows full pEPSC from a different cell on a longer timescale. Arrow indicates the 18 ms point. The bottom traces are current responses in the presence of 100 μm CTZ and 2 mm KYN (black), followed by the addition of 100 μm NBQX (red). F, Normalized current amplitudes evoked with the large UV spot at different locations along dendritic axis (red symbols, arrow indicates direction toward soma) or orthogonal to dendritic axis (black symbols). Gaussian fits gave FWHMs of 14.7 and 14.4 μm for the dendritic and orthogonal axis, respectively. Blue dashed line shows a Gaussian fit to large UV spot illumination profile (B).
GC dendrites were imaged using a cooled CCD camera, and a large pipette was used to locally perfuse a HEPES-based external solution containing 10 mm MNI-glutamate over the dendrite. Figure 1D shows a GC dendritic “hand,” onto which an individual MF–GC synaptic connection is made, and the larger dimensions of the UV illumination spot superimposed. Dendrites that were well isolated from the others, and with hands located relatively close to the surface (∼10 μm), were chosen to ensure efficient perfusion and minimal light scattering. Figure 1E (top) shows the current response to a large-spot illumination of 500 μs duration in the presence of the NMDA receptor antagonist APV. The pEPSC activated and decayed rapidly and exhibited a steady-state current at late times. We examined whether the initial decay was set by desensitization by blocking desensitization and lowering the apparent affinity of the AMPARs with bath application of 50–100 μm cyclothiazide (CTZ) and the rapidly equilibrating antagonist kynurenic acid (KYN) (2 mm). This resulted in a slowly decaying pEPSC at high light levels (Fig. 1E, bottom) (76 ± 7% of peak amplitude at 18 ms; n = 4). Similarly, pEPSCs that were evoked by low-intensity light levels (peak activation of <10% of the maximum) also decayed slowly (88 ± 5% of peak amplitude at 18 ms). These findings confirm the presence of desensitization and show that large-spot uncaging can produce a nearly step-like [Glut]cleft at early times.
In the absence of CTZ and KYN, the large-spot pEPSCs exhibited a significant tonic current component for ∼100 ms that then decayed back to the baseline level on a much slower timescale (∼1 s) (Fig. 1E, inset), presumably after the decay of glutamate. Bath application of the non-NMDA antagonist 2,3-dihydroxy-6-nitro-7-sulfonyl-benzo[f]quinoxaline (NBQX) fully blocked the current, ruling out a contribution of metabotropic glutamate receptors to this tonic current component (Fig. 1E) (reduced by 96 ± 2%; n = 3). Photolysis-evoked currents were also blocked by GYKI 53655 (see Materials and Methods) (supplemental Fig. 1, available at www.jneurosci.org as supplemental material), as for EPSCs (DiGregorio et al., 2002), confirming their AMPAR origin. We tested the possibility that the nondesensitizing component was attributable to activation of distant AMPARs (either along the dendritic shaft or at other glomeruli) by examining the spatial dependence of the large-spot response. Figure 1F shows the peak amplitudes of the pooled pEPSC responses when the center of the large spot was stepped across dendritic hands in a direction along (red) and orthogonal to the dendrite (black symbols). The similarity of these spatial profiles to the intensity profile of the large spot (Fig. 1F, blue dashed line) indicates that the AMPAR response is localized to a single glomerulus and that photolysis-evoked responses from the distal half of the dendritic shaft are negligible. This is consistent with immunohistochemical experiments that show AMPARs are located exclusively at the synapse in GCs (DiGregorio et al., 2002). These results indicate that the current decay after large-spot illumination is attributable to AMPAR desensitization and that there is a significant nondesensitizing steady-state component to the current.
Estimation of AMPAR occupancy during synaptic transmission
The time course and the extent of AMPAR desensitization depends on the [Glut] (Trussell and Fischbach, 1989; Colquhoun et al., 1992; Raman and Trussell, 1992; Hausser and Roth, 1997). To understand how synaptic AMPARs respond to the different [Glut]cleft produced by quantal release and spillover, we used glutamate uncaging to determine the EPSC receptor occupancy. Figure 2A shows AMPAR current responses evoked with different light intensities. As the total amount of light increased, the amplitude of the pEPSC increased until it saturated (100 μs to 1 ms duration) (Fig. 2B). Application of pairwise NSFA (Heinemann and Conti, 1992) to maximal responses revealed a high channel open probability (Popen = 0.83 ± 0.08; n = 5). Because channel open probability is directly related to receptor occupancy (Silver et al., 1996b), these data confirm that the AMPARs are very close to saturation. The peak amplitudes of these saturated large-spot pEPSCs had a broad distribution across cells, with a coefficient of variation of 0.53 and mean of 200 ± 24 pA at −86.3 mV (corrected for junction potential and electrode resistance) (Fig. 2C). This corresponded to a conductance of 2.32 nS and represents the maximal output of all AMPARs at an individual MF–GC synapse, because the UV illumination spot covered the whole GC dendritic hand. We have shown previously that there are an average of 4.7 functional release sites associated with an individual MF–GC synapse and that the quantal conductance is 0.24 nS (Sargent et al., 2005), giving a maximal synaptic output of 1.11 nS when the release probability is 1. The ratio of the average maximal synaptic conductance and the average maximal photolysis evoked conductance indicates an AMPAR occupancy at the peak of the EPSC of 49%. This value, which assumes that the activation time course is much faster than desensitization and the mean single-channel currents are similar, is within the upper and lower occupancy limits estimated for EPSCs in immature GCs using less direct methods (Silver et al., 1996b).
Figure 2.

Response of synaptic AMPARs to large-spot illumination at various light intensities. A, Averaged (4 traces) large-spot pEPSCs in response to increasing UV illumination. The intensity of a 0.1 ms pulse was increased to its maximum, after which the duration was increased to 0.2, 0.5, and 1.0 ms. B, Relationship between the relative peak amplitude of pEPSCs and normalized integral of light (n = 20). Dashed line denotes 90% criteria for achieving a saturating response. C, Histogram of maximum peak currents of saturated responses for 20 cells. Thick black line denotes the mean maximal amplitude of the pEPSC of all cells, and the dashed black line indicates the population average maximal synaptic output [mean number of release sites multiplied by average quantal current, N × Q (taken from Sargent et al., 2005)]. Data have been corrected for series resistance voltage errors.
Occupancy dependence of synaptic AMPAR desensitization
We next examined the activation and desensitization properties of synaptic AMPARs at various levels of receptor activation. As can be seen from the peak normalized pEPSC in Figure 3A, the pEPSC waveform accelerated markedly with the increasing levels of activation. We quantified the kinetics of receptor activation by restricting our analysis to illumination durations of ≤200 μs and by fitting the mean pEPSC at each light level with an empirical function to minimize the effects of noise for small-amplitude currents (Fig. 3A, black lines). The 10–90% rise time of the large-spot pEPSC decreased approximately exponentially with increasing fractional activation from 1.65 ± 0.16 ms (n = 37) at low occupancies to 280 ± 30 μs (n = 6) when the current amplitude was saturated (Fig. 3B). It is possible that this limiting rise time is still an overestimate because of the finite uncaging duration. The decay of the pEPSC, which is caused by desensitization, was fit with a single-exponential function (Fig. 3C, inset) (see Materials and Methods). The decay time constant decreased from 11 ± 1 ms (n = 13) at low levels of activation to 1.82 ± 0.13 ms (n = 6) when the current amplitude was saturated (Fig. 3C). The sixfold activation-dependent acceleration in the time course of desensitization is greater than observed previously for all native and recombinant AMPARs that have been examined over at least a 100-fold change in [Glut] values. Moreover, the range of occupancies over which the time course changed was larger than for other AMPARs. Indeed, some AMPARs exhibit no apparent concentration dependence in their time course of desensitization over a wide range of concentrations (Robert and Howe, 2003; Zhang et al., 2006), whereas others have a mild dependence at low concentrations, giving a twofold to fourfold acceleration (Raman and Trussell, 1995; Hausser and Roth, 1997; Koike et al., 2000; Krampfl et al., 2002).
We next determined how the steady-state level of desensitization depended on the fraction of channels activated. This was quantified by measuring the ratio of the steady-state current at 18 ms after the peak (10 times the time constant of desensitization for saturating pEPSCs) and the peak current (Iss/Ipeak). The fractional steady-state current decreased from 0.50 ± 0.03 (n = 16) at low levels of channel activation to 0.17 ± 0.02 (n = 14) at maximal activation when the AMPARs are saturated by glutamate (Fig. 3D). However, the amount of desensitization estimated with these ratios is likely to represent an upper estimate because of the prediction of a slight sag in the [Glut]cleft waveform (Fig. 1C, right).
To compare the occupancy dependence of GC AMPAR desensitization with other native AMPARs, we simulated the step application of a range of glutamate concentrations for three well constrained AMPAR models that were based on experimental dose–response curves and that exhibited a wide range of deactivating and desensitizing behaviors (Jonas et al., 1993; Raman and Trussell, 1995; Wadiche and Jahr, 2001). The Wadiche and Jahr (WJ) (2001) model is a close relative to the Hausser and Roth model (1997), but with rate constants adjusted to match patch-clamp data acquired at 32–35°C, similar to the temperature at which our MF–GC EPSCs were recorded (36°C). The shapes of the Iss/Ipeak relationships varied across models, indicating that some AMPARs are more sensitive to tonic levels of glutamate than others (Fig. 3D). However, the level of desensitization observed for GC AMPARs was consistently lower than the models over a wide range of occupancies. These data show that synaptic AMPARs in GCs exhibit a resistance to desensitization at low occupancies, a behavior that is likely to contribute to the generation of large tonic currents (>20% of the peak EPSC) observed during high-frequency trains (Saviane and Silver, 2006).
Mimicking synaptic activation of receptors using a small photolysis spot
Experiments using step changes in glutamate have so far shown that the level of AMPAR desensitization is a function of both the concentration and duration of glutamate exposure. To gain insight into AMPAR desensitization under more physiological glutamate activation, we changed the optical configuration of the uncaging system to produce brief pulses of [Glut]cleft to mimic synaptic release. This was achieved by focusing the UV laser beam to a small spot at the focal plane (Fig. 4A), because the diffusion-mediated decay of [Glut] from a small volume is expected to be rapid. Indeed, previous work using both one-photon and two-photon photolysis methods have shown that pEPSC waveforms can approach the miniature quantal EPSC waveform (Matsuzaki et al., 2001; Smith et al., 2003; Carter and Sabatini, 2004; Bagal et al., 2005). However, because single-photon methods can suffer from out-of-focus photolysis, we minimized the energy density outside the focal plane by forming a diffraction-limited spot with a high numerical aperture objective. The measured iPSF had lateral and axial dimensions of 234 ± 7 nm (FWHM; n = 5) and 1160 ± 50 nm (n = 5), respectively, for the central lobe (Fig. 4B–D). The small size of this excitation volume compares favorably with that achieved previously with single-photon [0.6–1 μm lateral dimension (Eder et al., 2003; Bagal et al., 2005)] and two-photon methods [0.29–0.39 μm (Matsuzaki et al., 2001; Smith et al., 2003; Tanaka et al., 2005)]. The z-dimension was only slightly larger than the two-photon excitation volume, with little excitation beyond the principle lobe.
Figure 4.
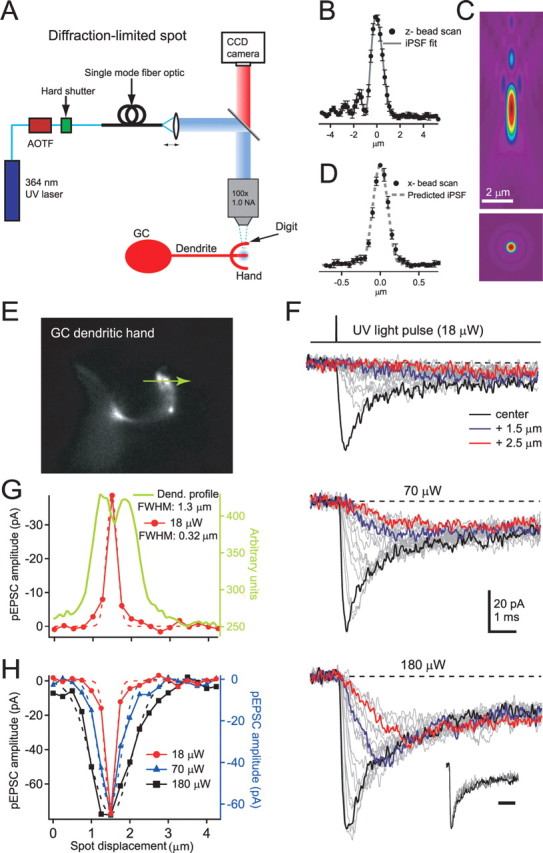
Spatial dependence of small-spot pEPSCs on granule cell dendritic hands. A, Optical configuration used to form a small diffraction-limited UV illumination spot. The small spot was generated by collimating the light emitted from the optical fiber so that it formed a parallel beam with a Gaussian profile that filled the back aperture of the microscope objective. B, Averaged fluorescence emitted by 110 nm fluorescent beads as a function of axial distance (200 nm steps) when illuminated with a small UV spot (n = 5; filled circles). Gray line shows the fit of the theoretical iPSF including spherical aberrations. C, x–z (top) and x–y (bottom) intensity profile of the theoretical 3D iPSF determined from fit of the data in B. D, Averaged fluorescence intensity distribution of a laterally scanned 110 nm bead (50 nm steps; n = 5; filled circles). Dashed line shows the predicted x-line profile of the fitted iPSF from B. E, Image of a GC dendritic hand visualized with Alexa 594. The green arrow indicates the length (4 μm) and location over which uncaging responses were elicited. F, pEPSCs evoked with a brief (20 μs) diffraction-limited UV illumination spot during local perfusion of 10 mm MNI-glutamate at three different light intensities elicited at different locations (250 nm apart) across the dendritic hand shown in E (photolysis scan). Thick black traces show fastest-rising responses. Inset shows normalized pEPSCs, for each of the three laser intensities, recorded from the location in which the fast-rising current was measured. Inset calibration bar is 2 ms. G, Current amplitudes for the lowest intensity (18 μW) measured at the time the largest current peaked (filled red circles) plotted as a function of distance. Dashed line indicates a Gaussian fit. Green line shows the intensity line profile from the CCD image indicating the location of the dendritic structure (E) from which the pEPSCs were recorded. H, Plot of amplitude at the time that the largest current peaked as a function of distance with Gaussian fits for the two highest intensities together with scaled data from G (red).
Uncaging with brief (20 μs) small-spot diffraction-limited illumination at 250 nm intervals across a dendritic “digit” (Fig. 4E, green arrow) produced a family of pEPSCs with rise times that became faster at locations in which the peak amplitude was largest (Fig. 4F), suggesting that our uncaging volume was centered on a cluster of receptors. At low laser intensities, the spatial dependence of the current amplitude at the time of the peak of the largest and most rapidly rising current (10–90% rise time of 0.22 ms), was sharp and, when fit with a Gaussian function, gave a FWHM of 320 nm (Fig. 4G). The dendritic structure in the scanned axis was significantly larger than the spatial dependence of pEPSCs (Fig. 4G) (on average, 2.6-fold larger; p = 0.02; n = 8,) consistent with channels being clustered in PSDs on the dendritic hand (DiGregorio et al., 2002). On average, the profile of spatially isolated responses was larger than the average diameter of PSDs at this age (FWHM of 0.77 ± 0.22 μm; n = 8 vs a PSD diameter of 180 nm) (Cathala et al., 2005). This large size could be attributable to either diffusion spread of glutamate during the rise time of the current (see Fig. 6F) or multiple juxtaposed PSDs.
As the illumination intensity of the small UV spot was increased, the amplitude of pEPSCs increased but with no significant change in time course of pEPSCs recorded at the central location (Fig. 4F, inset) [normalized integral at low light, 2.9 ± 0.3 ms (n = 8) vs high light level 2.2 ± 0.2 ms (n = 10); paired t test, p = 0.08]. However, the spatial dependence broadened even for well isolated cases (Fig. 4H). On average, the FWHM of the spatial profile of the current increased by a factor of 2.9 ± 0.4 (n = 8) for a sevenfold increase in light. This could result from the increased [Glut]cleft activating AMPAR over a larger region attributable to their nonlinear activation properties (Fig. 2B), diffusion of transmitter, and saturation of the uncaging reaction (see Fig. 6F), all of which are likely to contribute to the effective volume over which glutamate is uncaged. By selecting cells in which the spatial dependence of the pEPSC had a single peak over a range of light intensities (Matsuzaki et al., 2001; Smith et al., 2003; Bagal et al., 2005), we were able to identify discrete populations of synaptic AMPARs (for a counter example, see supplemental Fig. 2, available at www.jneurosci.org as supplemental material).
Small-spot uncaging of glutamate onto isolated clusters of AMPAR produced rapid pEPSCs. Figure 5A shows individual and mean pEPSCs superimposed for a high-intensity 20 μs illumination pulse. Unlike nerve-evoked EPSCs, the pEPSC response was reproducible and stable from trial to trial, permitting the application of NSFA. Analysis of current fluctuations in the decay of the pEPSCs gave a mean single-channel current that corresponded to a conductance of 6.9 ± 0.7 pS (n = 24). This value is comparable with that estimated from miniature EPSCs in GCs (Silver et al., 1996b; Cathala et al., 2005). The AMPA channel Popen, which was calculated from the mean peak current and the predicted maximal response, was high (0.81 ± 0.04; n = 12), similar to that obtained from our saturated large-spot responses (Popen = 0.83). Such a high channel Popen has only been attained previously with focal uncaging in the presence of CTZ (Matsuzaki et al., 2001; Smith et al., 2003; Tanaka et al., 2005), which can increase the apparent affinity of AMPARs. The high AMPAR Popen of pEPSCs suggests that the [Glut]cleft generated by a brief, high-intensity small diffraction-limited UV spot (20 μs, 140–660 μW; mean of 314 ± 45 μW) is sufficient to saturate synaptic AMPARs, whereas lower light levels can approximate the peak occupancy of synaptic currents.
Figure 5.

Peak open probability and time course of AMPAR-mediated pEPSCs evoked with small-spot illumination. A, Twenty-five consecutive pEPSCs (gray traces) and their mean (black trace) evoked with a brief high-intensity diffraction-limited spot at the location that gave the largest amplitude and fastest rise time. Inset, The peak amplitude of the pEPSCs plotted in order of acquisition from left to right. B, Relationship between variance and mean current for pEPSC decay calculated from traces in A using pairwise nonstationary fluctuation analysis (see Materials and Methods). Gray trace is a binomial fit, and dashed line indicates background variance. The mean number of channels across cells was 215 ± 36 (n = 24). C, Maximal pEPSCs evoked with brief, high-intensity small-spot illumination from 10 cells, which had fast rise times and unimodal spatial dependence. The light intensities ranged from 160 to 480 μW. D, Normalized traces from C (gray traces) with their population mean (black trace), the population mean of action potential-evoked EPSCs [eEPSC, green trace (taken from DiGregorio et al., 2002)], and the population mean quantal current [mEPSC, blue trace (taken from Nielsen et al., 2004)].
Figure 5C shows mean pEPSCs activated with a high illumination intensity at the locations that gave the fastest rise and largest amplitude for the 10 cells in which responses were fast (10–90% rise time, ≤300 μs) and spatially isolated from neighboring clusters (>1.5 μm). The mean amplitude varied widely from cell to cell (21–103 pA) and had an overall mean of 69 ± 11 pA (n = 11). This variability is likely to reflect variability in the number of AMPARs per PSD and the activation of more than one PSD in some recordings. Figure 5D shows the peak normalized pEPSC. The rise time of the mean pEPSC was substantially faster than our selection criterion and intermediate between the rise time of the evoked EPSC (eEPSC) and uniquantal or mEPSC (Fig. 5D) [10–90% rise time, 160 ± 10 μs, n = 11; eEPSC, 180 μs (DiGregorio et al., 2002); mEPSC: 120 μs (Nielsen et al., 2004)]. In a number of cells, the decay of the pEPSC was intermediate in time course between that of the eEPSC and the mEPSC but, on average, was close to the evoked synaptic waveforms (Fig. 5D). The fast decaying component of the pEPSC, eEPSC, and mEPSC was 0.82 ± 0.10 ms (n = 10), 0.54 ms (DiGregorio et al., 2002), and 0.36 ms (Nielsen et al., 2004), respectively. However, the slow component of the pEPSC was more pronounced than for the mEPSC, giving a slower overall decay that was comparable with the eEPSC (normalized integrals of 2.2, 0.8, and 1.7 ms, respectively). These results show that, although the pEPSCs measured here are substantially faster than reported previously using either single-photon (Bagal et al., 2005) or two-photon (Matsuzaki et al., 2001; Smith et al., 2003; Carter and Sabatini, 2004) uncaging methods, the pEPSC decay is significantly slower than the rapid decay of the quantal current in GCs at near physiological temperature. Nevertheless, the initial decay of mEPSCs was still much faster than the saturating value for the time course of desensitization even when it was fit with a double-exponential function (τfast of 0.9 ms; n = 18; see Materials and Methods), indicating that channel deactivation and the decay of [Glut]cleft determines the mEPSC decay. The fact that the time course of the pEPSC is similar to the evoked EPSC, which includes slower spillover-mediated components, suggests that diffraction-limited small-spot UV uncaging can be used to mimic action potential-evoked synaptic transmission at the MF–GC synapse.
To investigate the determinants of the [Glut]cleft time course generated by small-spot UV uncaging and to examine whether pairs of illumination pulses could be used to probe receptor desensitization, we simulated photolysis at the MF–GC synapse with a 3D diffusion-reaction model (Fig. 6A,B) (Nielsen et al., 2004) (see Materials and Methods). Numerical simulations using the measured diffusion coefficient of glutamate, the measured iPSF, and calculated uncaging efficiency (see Materials and Methods) suggest that the fast decay of the photolysis-evoked glutamate (e-fold decay, 46 μs for low intensities) was at least twofold slower than that predicted for quantal release (Fig. 6C). This decay did not accelerate when using a 3D Gaussian function to mimic a two-photon excitation volume (Fig. 6C), indicating that the minimal uncaging volume that can be achieved with conventional optics is too large to mimic quantal release at the MF–GC synapse, regardless of whether single- or two-photon excitation is used. The similarity of the pEPSC and mEPSC time courses reported for other preparations using one-photon (Bagal et al., 2005) and two-photon (Matsuzaki et al., 2001; Carter and Sabatini, 2004; Losonczy and Magee, 2006) (but see Tanaka et al., 2005) methods may be attributable to slower AMPAR kinetics, different synaptic geometries, or dendritic filtering of the mEPSC. When the uncaging rate (i.e., light intensity) was increased to large values (k = 1000 ms−1), the decay of the [Glut]cleft waveform slowed (Fig. 6D,E) as a result of saturation of the photolysis of MNI-glutamate in the center of the illumination spot, which caused a larger effective uncaging volume (Fig. 6F). By 0.2 ms, the spatial spread of the glutamate is larger but still restricted to ∼1 μm, albeit at much smaller [Glut]cleft (Fig. 6F). At these high intensities and unfavorable synaptic orientations (Fig. 6B) the e-fold decay could be as slow as ∼0.6 ms. Because the light intensities in our experiments are likely to result in rates between 100 and 1000 ms−1 (see Materials and Methods), the decay of the glutamate will be slower than predicted for release of a single quantum but still brief enough to approximate the slower [Glut]cleft waveform that is produced by evoked quantal release and spillover together. Our simulations also show that the rate of recovery of MNI-glutamate is fast after uncaging with a brief small-spot illumination pulse (Fig. 6D). The similarity in the recovery of MNI-glutamate and the decay of glutamate after photolysis is attributable to their similar diffusion coefficients (see Materials and Methods). These simulations indicate that pairs of small-spot illumination uncaging pulses can be used to activate synaptic AMPARs in a manner similar to the evoked EPSC and to probe the level of desensitization a few milliseconds later.
Probing AMPAR desensitization after transient synaptic-like photolysis activation
To examine the desensitization properties of synaptic AMPARs in GCs using synaptic-like glutamate exposures, we used two brief (20 μs) small-spot illumination pulses. The AMPA receptor occupancy was varied by changing the light intensity on the first pulse, and the level of desensitization was assayed with a second “test” pulse that fully activated the receptors 10 ms later (Fig. 7A). We selected recordings that had spatially isolated responses to ensure that the same receptor population was activated regardless of intensity (Fig. 7B). At the lowest light level, when 23% of the receptors were activated on the first pulse, the second pulse gave a near maximal response (95%), indicating that the majority of receptors were available and that they were not in a desensitized state. This result contrasts with previous paired-pulse data from patches from chick nucleus magnocellularis neurons in which a 10% fractional activation produced 50% desensitization (Raman and Trussell, 1995). However, because the fraction of AMPARs activated on the first pulse was increased, the response to the second pulse decreased, indicating that the fraction of desensitized AMPARs had increased (Fig. 7C). We further quantified the relationship between the level of activation and desensitization by estimating the fraction of AMPAR channels open at the peak of the first pulse using NSFA of pEPSCs evoked from intermediate light intensities (mean of 140 ± 30 μW). Figure 7D shows that there is an inverse correlation between the peak Popen on the first pulse and the paired-pulse ratio (P2/P1). These data indicate that, for brief glutamate waveforms, there is a tight coupling between activation and desensitization.
Figure 7.
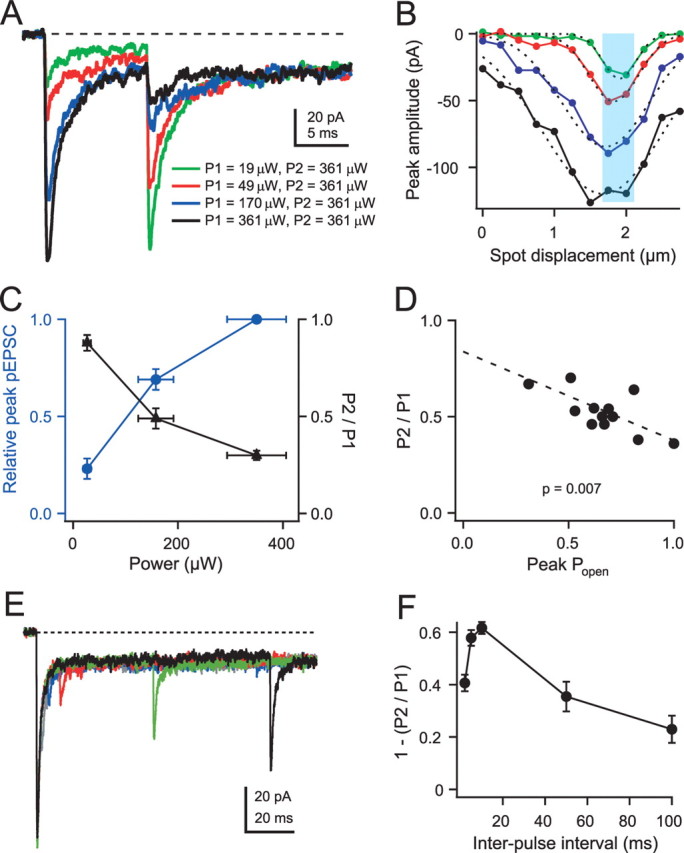
Desensitization properties after transient AMPAR activation using paired-pulse small-spot UV photolysis. A, pEPSCs in response to pairs of 20 μs small-spot illumination pulses using a 10 ms interval. Light intensity of the first pulse (P1) was varied, whereas the intensity of the second pulse (P2) was maintained at the highest (saturating) intensity of the first pulse. B, Amplitudes of small-spot pEPSC responses at different distances for P1 across a dendritic digit in same region as A. Color coding indicates different light intensities as for P1 in A. Dotted lines show Gaussian fits with FWHMs of 0.55, 0.82, 1.44, and 2.00 μm (for green to black P1 intensity). Cyan region shows region over which traces in A were collected and averaged. C, Relationships between fractional activation of the first pulse (blue circles) or P2/P1 pEPSC amplitude ratio (black triangles) and light intensity. Mean P2/P1 amplitude ratios were 0.88 ± 0.04 (n = 6), 0.49 ± 0.05 (n = 6), and 0.30 ± 0.02 (n = 7) for low, medium, high light levels, respectively. D, Relationship between P2/P1 pEPSC amplitude ratio and channel open probability (Popen) for 13 cells. Dashed line shows linear regression fit with right-hand intercept of 0.38 for a Popen = 1. E, High-intensity paired-pulse pEPSC responses for various interpulse intervals (2 ms, gray; 5 ms, blue; 10 ms, red; 50 ms, green; 100 ms, black). F, Relationship between 1 − (P2/P1), which indicates the fraction of desensitization, and interpulse interval for 10 cells.
To examine whether the 10 ms paired-pulse ratio was a result of modest desensitization or attributable to a fast recovery, we examined how AMPARs enter the desensitization state after transient activation at high laser intensities (Fig. 7E). For near saturating responses, desensitization reached a maximum at 10 ms and then recovered over a slower time course (Fig. 7F), similar to that observed for extrasynaptic receptors in Purkinje cells after 1 ms applications of 1 mm glutamate (Hausser and Roth, 1997). These results indicate that synaptic AMPARs in GCs are surprisingly resistant to desensitization during transient synaptic-like activations at physiologically relevant occupancies.
Desensitization by spillover-like photolysis-evoked AMPAR currents
The amount of AMPAR desensitization that occurs in the presence and absence of the direct quantal component has been difficult to address experimentally because the receptor population activated by stochastic release varies from trial to trial, whereas all PSDs are activated by spillover on each trial. We therefore used diffraction-limited small-spot photolysis protocols of different amplitudes and durations to examine the desensitization produced by the various [Glut]cleft components. Figure 8A compares pEPSCs generated with 20 μs and 1 ms illumination protocols with the quantal-plus-spillover and spillover-only eEPSC components from DiGregorio et al. (2002). The light intensities were adjusted so that the mean rise times and the relative occupancies of the pEPSCs were reasonably close to those calculated for the spillover and quantal components of the eEPSC. This resulted in a slight overestimation of the fractional activation for the spillover-only pEPSC (9 vs 6% for the eEPSC) and an underestimate for the quantal-plus-spillover pEPSC (34 vs 49% for the eEPSC) (Fig. 8B). We then tested the level of desensitization arising from these different activations with a second brief illumination pulse that produced maximal activation. The P2/P1 indicates that, after a spillover-like pEPSC, only 10 ± 2% (n = 5) of the receptors enter desensitization, whereas a quantal-plus-spillover pEPSC induced 41 ± 3%. These results suggest that the high levels of [Glut]cleft that produce an intermediate occupancy after quantal release, in the presence of spillover, are more effective at inducing desensitization than the slower low [Glut]Cleft during transmitter spillover alone.
Figure 8.

Weak desensitization of pEPSCs at low receptor occupancies. A, pEPSCs in response to a 10 ms paired-pulse protocol (top traces), in which P1 intensity was set to a low and long duration to mimic activation by glutamate spillover alone (<1 μW, 1 ms; red traces) or a brief intermediate intensity to mimic the quantal and spillover current components together (20 μs, 15–30 μW; blue traces). P2 was set to a brief high intensity. A maximal pEPSC response to P2 was obtained when P1 was omitted (dashed line). For comparison, the inset shows the overall mean AMPAR-mediated synaptic eEPSC and the spillover-mediated eEPSC taken from DiGregorio et al. (2002). Calibration: 10 pA, 3 ms. B, Summary plot for five cells, showing fractional pEPSC activation (Rel. active.), 10–90% rise time, and fractional activation of P2 (P2/P2max) for quantal-plus-spillover and spillover-only pEPSC responses. In these experiments, when P1 and P2 were both maximal, P2/P1 was 0.31 ± 0.02, indicating a near saturated response, similar to that obtained for the dataset in Figure 7. C, Simulated AMPAR responses of the kinetic scheme (Wadiche and Jahr, 2001) with modified rate constants indicated in blue (inset): rate constants between C1–C3 was decreased by fourfold, whereas C1–C0, C4–C2, C5–O, and C6–C7 were all increased fourfold. The desensitization states are C3–C7, and the asterisks denote [Glut]-dependent transitions. The [Glut] was stepped from 0 to 0.1, 0.2, 0.5, 1, and 10 mm for 100 ms. Gray dashed lines are single-exponential fits. Red lines are the step responses of the WJ model for 0.06 and 10 mm. D, Response of modified AMPAR model (black; from C) to a simulated [Glut]cleft waveform train (data not shown). Mean EPSC trains were constructed for each kinetic scheme by feeding 500 stochastic [Glut]cleft trains through the model and averaging the currents. The peak [Glut]cleft of the quantal component was ∼8 mm, and the steady-state level was 0.06 mm at the end of 10 stimuli. All traces are normalized to their first peak amplitude. The gray trace is a recorded EPSC train from the MF–GC synapse, and the filled circles are mean values averaged across five cells (both taken from Saviane and Silver, 2006). The simulated EPSC trains with the modified kinetic scheme produce much less depression than the original WJ model (red) and are comparable with the experimental data (SS) (Saviane and Silver, 2006). The peak open probabilities were 0.22 and 0.27 for the modified AMPAR model and the WJ model, respectively.
Modification of an existing channel model to match GC AMPAR behavior
Our measurement of AMPAR desensitization is a macroscopic property of the current, which arises from at least two distinct microscopic processes: activation (glutamate binding and channel opening) and desensitization. The concentration dependence of the time course of activation suggests that glutamate binding is limiting at low occupancies and may influence the time course of desensitization. To understand how the unique macroscopic desensitization properties of GC AMPARs might arise from microscopic transitions, we examined whether an existing AMPAR model (WJ) (Wadiche and Jahr, 2001) could be modified to reproduce the GC AMPAR responses to [Glut]cleft steps (Fig. 3) and to predict the EPSC depression during a train stimulus (Fig. 8D). A striking feature of the GC AMPAR response to step changes in glutamate is the strong concentration dependence of the time course of desensitization and the large steady-state current at low levels of activation (<10%). Changing the rate constants that governed glutamate binding could mimic the concentration dependence of the time course of desensitization but failed to reproduce the large steady-state current. We therefore adjusted the transitions into the desensitized states. We first reduced the rate of entry into only the singly bound desensitization state in the AMPAR model (C1 to C3) (Fig. 8C) to reproduce the observed large acceleration in desensitization time course as a function of activation. To maintain microscopic reversibility, we increased the rates out of the doubly liganded desensitization states, which also increased the nondesensitizing component. Finally, we adjusted the off-rate of the first single bound state to compensate for changes in the apparent affinity to reproduce the occupancy of the quantal response (Fig. 2C). A fourfold change in these rates produced time constants of desensitization (τdes of 2.4–12.3 ms) and steady-state levels of activation (16–89%) that closely matched those for the GC AMPAR at high and low occupancies, respectively (Fig. 8C). A uniform change of similar magnitude in either the entry or exit from the desensitized states (C3–C6) did not reproduce the observed change in desensitization time constant but matched the steady-state desensitization as a function of receptor activation.
We then examined how well the modified AMPAR model could predict the experimentally measured eEPSC amplitudes generated by 100 Hz MF stimulation by simulating the [Glut]cleft with a 3D model of the MF–GC synapse (Nielsen et al., 2004), which included stochastic release, presynaptic short-term plasticity, glutamate diffusion, and uptake (see Materials and Methods). Figure 8D shows that the simulated 100 Hz train closely matched the measured GC EPSC train, unlike the original WJ scheme, which exhibited a more pronounced depression during the train. Moreover, the behavior of the modified scheme could not be reproduced by the affinity change alone or by only speeding the exit from desensitization states with multiple glutamate molecules bound (C4–C6; simulations not shown). These simulations show that low probabilities of occupying desensitization states, especially those with few glutamate molecules bound, could account for the kinetic and steady-state macroscopic properties of currents during steps of glutamate and during high-frequency synaptic transmission.
Discussion
We examined the properties of AMPAR desensitization at the cerebellar MF–GC synapse using glutamate uncaging. The time course of desensitization, after step increases in [Glut]cleft, accelerated sixfold as the fraction of activated AMPARs increased. However, the final level of desensitization was only weakly dependent on occupancy, with a desensitization-resistant current component remaining in saturating glutamate. Synaptic-like activation of GC AMPARs exhibited a marked resistance to desensitization at low occupancies, explaining how GCs can maintain phasic and tonic signaling during high-frequency transmission.
A photolysis method for probing the kinetics of synaptic receptors
We have taken advantage of the efficiency and versatility of single-photon excitation to produce both transient and step-like [Glut]cleft waveforms with illumination spots of different sizes. Although large UV illumination spots have been used previously to create step changes in [Glut]cleft (Otis et al., 1996b; Canepari et al., 2001; Lowe, 2003), by modulating the light intensity, and thus the uncaged [Glut]cleft, we determined the activation-dependent kinetic properties of desensitization of synaptic AMPARs for the first time. In preparations in which synaptic receptors are not located at the end of the dendrite, it may be necessary to use larger spots that cover a dendritic branch or the whole arbor to achieve uniform [Glut]cleft. In these cases, the potentially larger contribution of extrasynaptic receptors should be considered. However, we also show that pairs of small-spot illumination pulses can also be used to assay the level of desensitization of synaptic receptors.
Desensitization properties of GC AMPARs
Our results show that synaptic AMPARs in GCs are more resistant to desensitization than reported previously for native channels from a range of different neurons (Jonas et al., 1993; Geiger et al., 1995; Raman and Trussell, 1995; Hausser and Roth, 1997). Weak desensitization could arise from a slower rate of entry into or a faster recovery from desensitization states. Our simulations, using a modified version of an existing native AMPAR kinetic scheme (Wadiche and Jahr, 2001), suggest that a slowed rate of entry into a singly bound desensitization state (C3) (Fig. 8C) is important for producing the pronounced slowing of the desensitization time course at low occupancies. Moreover, they also indicate that a faster exit from multi-liganded desensitization states (C3–C6) (Fig. 8C) could contribute to the weak steady-state desensitization observed during glutamate steps. However, direct measurement of the time course of recovery from desensitization using paired pEPSCs showed that the recovery in the current is not as fast as the ultrafast recovery observed at parallel fiber to stellate cell synapses (Crowley et al., 2007) but is similar to that observed at multipolar interneurons in cortex (>60% at 100ms) (Rozov et al., 2001). These results suggest that slowed entry into desensitization states at low levels of activation together with a faster exit from desensitization states at higher levels of activation could underlie the concentration dependence of desensitization of GC AMPARs and thus, their ability to maintain high-frequency transmission in the presence of glutamate accumulation.
The time course of desensitization of AMPARs at the MF–GC synapse is similar to non-NMDA receptors from cultured immature GCs at saturating concentrations (Silver et al., 1996a), but the synaptic AMPARs exhibit much stronger occupancy-dependent kinetics and a larger desensitization-resistant current component. These unique desensitization properties could arise from a number of potential mechanisms, including subunit composition, posttranslational modification, modulation by ancillary proteins, or channel phosphorylation state. Because previous studies of native AMPARs were performed using the outside-out patch method, it is also possible that these distinct properties could arise from differences between extrasynaptic and synaptic receptors (Liu and Cull-Candy, 2000) (but see Spruston et al., 1995; Hausser and Roth, 1997; Lawrence and Trussell, 2000) or from altered receptor properties in patches (Clark et al., 1997).
Cerebellar GCs express both flip and flop splice variants of GluR2 and GluR4 subunits (Mosbacher et al., 1994), and their heteromers are likely to mediate the AMPAR synaptic current (Cathala et al., 2005). Here we show that the steady-state component of the GC AMPAR current is larger than for recombinant GluR2 and GluR4 (flip and flop splice variants) subunits (Mosbacher et al., 1994). However, it is intriguing that the steady-state currents we observed are similar to the incomplete desensitization behavior of GluR2 and GluR4 when coexpressed with Stargazin (Priel et al., 2005; Tomita et al., 2005), a transmembrane AMPA receptor regulatory protein that is essential for trafficking AMPARs to the membrane in GCs (Hashimoto et al., 1999). Interaction of AMPARs with an extracellular domain of Stargazin has also been shown to slow deactivation, slow the time course and the extent of desensitization, and increase apparent affinity for glutamate (Priel et al., 2005; Tomita et al., 2005; Turetsky et al., 2005). Our results, showing that synaptic AMPARs in GCs have a slower time course of desensitization and a much larger steady-state current than GluR2/4 AMPAR subunits expressed without Stargazin, are therefore consistent with the idea that Stargazin modifies synaptic AMPAR channels in GCs, making them more resistant to desensitization.
Deactivation and desensitization of AMPARs during synaptic transmission
It has been proposed that the decay of the quantal AMPAR EPSC is mediated by desensitization in cerebellar GCs on the basis of the expression and fast desensitization time course of the flop isoforms of GluR2 and GluR4 (Mosbacher et al., 1994). However, immature cultured GCs have desensitization time constants much slower than the mEPSC decay (Silver et al., 1996a), arguing that deactivation plays a predominant role. More recent studies have argued that desensitization plays a role in the decay of EPSCs on the basis of a slowing of mEPSCs by CTZ in slices and a fast component desensitization in patches from cell cultures (Wall et al., 2002). By directly measuring the kinetics of AMPAR desensitization and the occupancy during the MF–GC EPSC with large-spot uncaging in slices (see Materials and Methods and Results), we have shown that desensitization is too slow to account for the major component of the mEPSC decay.
We estimate that, after quantal release, 49% of AMPARs are activated, producing 30–40% desensitization after 10 ms. This matches the 20% desensitization obtained with quantal analysis for paired-pulse and tetanic synaptic stimulation protocols (Saviane and Silver, 2006), given that release occurs at only ∼50% of the synaptic contacts on each trial (Sargent et al., 2005). Previous studies at this synapse (Xu-Friedman and Regehr, 2003) and elsewhere (Otis et al., 1996b; Taschenberger et al., 2005) have proposed that the [Glut]cleft generated by spillover could cause significant receptor desensitization and thus give rise to STD. Although the spillover component provides half the charge transfer during a single AMPAR-mediated EPSC (DiGregorio et al., 2002), the peak of the spillover conductance, which represents the summed activation of receptors at all PSDs on a particular GC hand (180 pS) (DiGregorio et al., 2002), represents only 6% of the maximal current (2.3 nS) (Fig. 2C). Our results from paired-pulse uncaging show that, at these levels of activation, synaptic AMPARs in GCs are resistant to desensitization, and the majority of the desensitization observed at the MF–GC synapse during paired-pulse stimulation arises when quantal release and spillover occur together.
The brief nature of the [Glut]cleft waveform after quantal release may shield AMPA receptors from entering desensitized states at many central synapses, thereby preventing postsynaptic STD (Dobrunz et al., 1997; Dittman and Regehr, 1998; Silver et al., 1998; Hjelmstad et al., 1999; Renden et al., 2005). Our results suggest that the presence of AMPARs with a lower-affinity desensitization state is another possible way synapses could minimize the effects of desensitization, during repetitive activation and delayed clearance of glutamate during high-frequency trains. This behavior might contribute to the lack of desensitization-dependent STD in medial nucleus of the trapezoid body neurons when residual glutamate is modulated by blocking uptake (Takayasu et al., 2004, 2005; Renden et al., 2005) and could possibly account for some of the developmental changes in STD (Brenowitz and Trussell, 2001; Renden et al., 2005). A related mechanism involving AMPARs with fast recovery from desensitization is thought to minimize desensitization at some synapses onto interneurons (Rozov et al., 2001; Crowley et al., 2007). These results suggest that AMPAR desensitization properties may be tuned to produce differing patterns of short-term plasticity at synapses that experience either repetitive activation or delayed glutamate clearance.
Implications for signal processing in the cerebellar GC layer
The rapid kinetics of activation and deactivation of synaptic AMPARs are likely to be important for conveying temporal signals, because the EPSC time course determines the temporal precision of spike generation (Galarreta and Hestrin, 2001; Cathala et al., 2003; Sargent et al., 2005). In vivo recordings from awake behaving monkeys show that some MFs convey sustained high-frequency rate-coded signals that encode features such as joint position (van Kan et al., 1993). Synaptic AMPARs in GCs appear tuned to transmit both phasic and tonic current components simultaneously during such high-frequency trains. Preservation of the fast quantal component will ensure that noise is present in the excitatory input over a wide range of frequencies, a property that is essential for inhibition-mediated multiplicative gain modulation (Mitchell and Silver, 2003). Moreover, the modest desensitization of the quantal component of the EPSC, which underlies the majority of STD at the MF–GC synapse (Saviane and Silver, 2006), may enhance the sensitivity of GCs to changes in firing rate over absolute rates (Abbott et al., 1997). Here, we show that a weak level of desensitization at low occupancies is the mechanism by which synaptic AMPARs convert the residual glutamate and spillover that builds up during sustained high-frequency transmission into a tonic current that conveys the majority of the charge at high MF firing rates (Saviane and Silver, 2006). These AMPAR properties enable the GC to detect changes in MF firing rate and transmit rate-coded information over an unusually broad bandwidth.
Footnotes
This work was supported by the Wellcome Trust, Medical Research Council Grant G0400598, and European Union Grant EUSynapse LSHM-CT-2005-019055. D.A.D. was partially supported by Centre National de la Recherche Scientifique. R.A.S. is in receipt of a Wellcome Senior Research Fellowship. We thank David Ogden, John Corrie, Colin Sheppard, and Peter Török for helpful discussions during the project and Philippe Ascher, David Attwell, Jonathan Bradley, Stuart Cull-Candy, Laurence Cathala, Jeremy Dittman, Paul Kirkby, Zoltan Nusser, Tom Otis, Arnd Roth, Chiara Saviane, and Tomoyuki Takahashi for their comments on this manuscript.
References
- Abbott LF, Varela JA, Sen K, Nelson SB. Synaptic depression and cortical gain control. Science. 1997;275:220–224. doi: 10.1126/science.275.5297.221. [DOI] [PubMed] [Google Scholar]
- Akopian G, Walsh JP. Reliable long-lasting depression interacts with variable short-term facilitation to determine corticostriatal paired-pulse plasticity in young rats. J Physiol (Lond) 2007;580:225–240. doi: 10.1113/jphysiol.2006.115790. [DOI] [PMC free article] [PubMed] [Google Scholar]
- Bagal AA, Kao JP, Tang CM, Thompson SM. Long-term potentiation of exogenous glutamate responses at single dendritic spines. Proc Natl Acad Sci USA. 2005;102:14434–14439. doi: 10.1073/pnas.0501956102. [DOI] [PMC free article] [PubMed] [Google Scholar]
- Brenowitz S, Trussell LO. Maturation of synaptic transmission at end-bulb synapses of the cochlear nucleus. J Neurosci. 2001;21:9487–9498. doi: 10.1523/JNEUROSCI.21-23-09487.2001. [DOI] [PMC free article] [PubMed] [Google Scholar]
- Canepari M, Nelson L, Papageorgiou G, Corrie JE, Ogden D. Photochemical and pharmacological evaluation of 7-nitroindolinyl-and 4-methoxy-7-nitroindolinyl-amino acids as novel, fast caged neurotransmitters. J Neurosci Methods. 2001;112:29–42. doi: 10.1016/s0165-0270(01)00451-4. [DOI] [PubMed] [Google Scholar]
- Carter AG, Regehr WG. Prolonged synaptic currents and glutamate spillover at the parallel fiber to stellate cell synapse. J Neurosci. 2000;20:4423–4434. doi: 10.1523/JNEUROSCI.20-12-04423.2000. [DOI] [PMC free article] [PubMed] [Google Scholar]
- Carter AG, Sabatini BL. State-dependent calcium signaling in dendritic spines of striatal medium spiny neurons. Neuron. 2004;44:483–493. doi: 10.1016/j.neuron.2004.10.013. [DOI] [PubMed] [Google Scholar]
- Cathala L, Brickley S, Cull-Candy S, Farrant M. Maturation of EPSCs and intrinsic membrane properties enhances precision at a cerebellar synapse. J Neurosci. 2003;23:6074–6085. doi: 10.1523/JNEUROSCI.23-14-06074.2003. [DOI] [PMC free article] [PubMed] [Google Scholar]
- Cathala L, Holderith NB, Nusser Z, DiGregorio DA, Cull-Candy SG. Changes in synaptic structure underlie the developmental speeding of AMPA receptor-mediated EPSCs. Nat Neurosci. 2005;8:1310–1318. doi: 10.1038/nn1534. [DOI] [PubMed] [Google Scholar]
- Chen C, Blitz DM, Regehr WG. Contributions of receptor desensitization and saturation to plasticity at the retinogeniculate synapse. Neuron. 2002;33:779–788. doi: 10.1016/s0896-6273(02)00611-6. [DOI] [PubMed] [Google Scholar]
- Clark BA, Farrant M, Cull-Candy SG. A direct comparison of the single-channel properties of synaptic and extrasynaptic NMDA receptors. J Neurosci. 1997;17:107–116. doi: 10.1523/JNEUROSCI.17-01-00107.1997. [DOI] [PMC free article] [PubMed] [Google Scholar]
- Colquhoun D, Jonas P, Sakmann B. Action of brief pulses of glutamate on AMPA/kainate receptors in patches from different neurones of rat hippocampal slices. J Physiol (Lond) 1992;458:261–287. doi: 10.1113/jphysiol.1992.sp019417. [DOI] [PMC free article] [PubMed] [Google Scholar]
- Crowley JJ, Carter AG, Regehr WG. Fast vesicle replenishment and rapid recovery from desensitization at a single synaptic release site. J Neurosci. 2007;27:5448–5460. doi: 10.1523/JNEUROSCI.1186-07.2007. [DOI] [PMC free article] [PubMed] [Google Scholar]
- Cull-Candy S, Kelly L, Farrant M. Regulation of Ca2+-permeable AMPA receptors: synaptic plasticity and beyond. Curr Opin Neurobiol. 2006;16:288–297. doi: 10.1016/j.conb.2006.05.012. [DOI] [PubMed] [Google Scholar]
- DiGregorio DA, Nusser Z, Silver RA. Spillover of glutamate onto synaptic AMPA receptors enhances fast transmission at a cerebellar synapse. Neuron. 2002;35:521–533. doi: 10.1016/s0896-6273(02)00787-0. [DOI] [PubMed] [Google Scholar]
- Dittman JS, Regehr WG. Mechanism and kinetics of heterosynaptic depression at a cerebellar synapse. J Neurosci. 1997;17:9048–9059. doi: 10.1523/JNEUROSCI.17-23-09048.1997. [DOI] [PMC free article] [PubMed] [Google Scholar]
- Dittman JS, Regehr WG. Calcium dependence and recovery kinetics of presynaptic depression at the climbing fiber to Purkinje cell synapse. J Neurosci. 1998;18:6147–6162. doi: 10.1523/JNEUROSCI.18-16-06147.1998. [DOI] [PMC free article] [PubMed] [Google Scholar]
- Dobrunz LE, Huang EP, Stevens CF. Very short-term plasticity in hippocampal synapses. Proc Natl Acad Sci USA. 1997;94:14843–14847. doi: 10.1073/pnas.94.26.14843. [DOI] [PMC free article] [PubMed] [Google Scholar]
- Eder M, Becker K, Rammes G, Schierloh A, Azad SC, Zieglgansberger W, Dodt HU. Distribution and properties of functional postsynaptic kainate receptors on neocortical layer V pyramidal neurons. J Neurosci. 2003;23:6660–6670. doi: 10.1523/JNEUROSCI.23-16-06660.2003. [DOI] [PMC free article] [PubMed] [Google Scholar]
- Galarreta M, Hestrin S. Spike transmission and synchrony detection in networks of GABAergic interneurons. Science. 2001;292:2295–2299. doi: 10.1126/science.1061395. [DOI] [PubMed] [Google Scholar]
- Geiger JR, Melcher T, Koh DS, Sakmann B, Seeburg PH, Jonas P, Monyer H. Relative abundance of subunit mRNAs determines gating and Ca2+ permeability of AMPA receptors in principal neurons and interneurons in rat CNS. Neuron. 1995;15:193–204. doi: 10.1016/0896-6273(95)90076-4. [DOI] [PubMed] [Google Scholar]
- Greengard P, Jen J, Nairn AC, Stevens CF. Enhancement of the glutamate response by cAMP-dependent protein kinase in hippocampal neurons. Science. 1991;253:1135–1138. doi: 10.1126/science.1716001. [DOI] [PubMed] [Google Scholar]
- Hashimoto K, Fukaya M, Qiao X, Sakimura K, Watanabe M, Kano M. Impairment of AMPA receptor function in cerebellar granule cells of ataxic mutant mouse stargazer. J Neurosci. 1999;19:6027–6036. doi: 10.1523/JNEUROSCI.19-14-06027.1999. [DOI] [PMC free article] [PubMed] [Google Scholar]
- Hausser M, Roth A. Dendritic and somatic glutamate receptor channels in rat cerebellar Purkinje cells. J Physiol (Lond) 1997;501:77–95. doi: 10.1111/j.1469-7793.1997.077bo.x. [DOI] [PMC free article] [PubMed] [Google Scholar]
- Heinemann SH, Conti F. Nonstationary noise analysis and application to patch clamp recordings. Methods Enzymol. 1992;207:131–148. doi: 10.1016/0076-6879(92)07009-d. [DOI] [PubMed] [Google Scholar]
- Hestrin S. Different glutamate receptor channels mediate fast excitatory synaptic currents in inhibitory and excitatory cortical neurons. Neuron. 1993;11:1083–1091. doi: 10.1016/0896-6273(93)90221-c. [DOI] [PubMed] [Google Scholar]
- Hjelmstad GO, Isaac JT, Nicoll RA, Malenka RC. Lack of AMPA receptor desensitization during basal synaptic transmission in the hippocampal slice. J Neurophysiol. 1999;81:3096–3099. doi: 10.1152/jn.1999.81.6.3096. [DOI] [PubMed] [Google Scholar]
- Isaacson JS, Walmsley B. Amplitude and time course of spontaneous and evoked excitatory postsynaptic currents in bushy cells of the anteroventral cochlear nucleus. J Neurophysiol. 1996;76:1566–1571. doi: 10.1152/jn.1996.76.3.1566. [DOI] [PubMed] [Google Scholar]
- Jahn K, Bufler J, Franke C. Kinetics of AMPA-type glutamate receptor channels in rat caudate-putamen neurones show a wide range of desensitization but distinct recovery characteristics. Eur J Neurosci. 1998;10:664–672. doi: 10.1046/j.1460-9568.1998.00080.x. [DOI] [PubMed] [Google Scholar]
- Jonas P. The time course of signaling at central glutamatergic synapses. News Physiol Sci. 2000;15:83–89. doi: 10.1152/physiologyonline.2000.15.2.83. [DOI] [PubMed] [Google Scholar]
- Jonas P, Major G, Sakmann B. Quantal components of unitary EPSCs at the mossy fibre synapse on CA3 pyramidal cells of rat hippocampus. J Physiol (Lond) 1993;472:615–663. doi: 10.1113/jphysiol.1993.sp019965. [DOI] [PMC free article] [PubMed] [Google Scholar]
- Jones MV, Westbrook GL. The impact of receptor desensitization on fast synaptic transmission. Trends Neurosci. 1996;19:96–101. doi: 10.1016/s0166-2236(96)80037-3. [DOI] [PubMed] [Google Scholar]
- Koike M, Tsukada S, Tsuzuki K, Kijima H, Ozawa S. Regulation of kinetic properties of GluR2 AMPA receptor channels by alternative splicing. J Neurosci. 2000;20:2166–2174. doi: 10.1523/JNEUROSCI.20-06-02166.2000. [DOI] [PMC free article] [PubMed] [Google Scholar]
- Krampfl K, Schlesinger F, Zorner A, Kappler M, Dengler R, Bufler J. Control of kinetic properties of GluR2 flop AMPA-type channels: impact of R/G nuclear editing. Eur J Neurosci. 2002;15:51–62. doi: 10.1046/j.0953-816x.2001.01841.x. [DOI] [PubMed] [Google Scholar]
- Lawrence JJ, Trussell LO. Long-term specification of AMPA receptor properties after synapse formation. J Neurosci. 2000;20:4864–4870. doi: 10.1523/JNEUROSCI.20-13-04864.2000. [DOI] [PMC free article] [PubMed] [Google Scholar]
- Liu SQ, Cull-Candy SG. Synaptic activity at calcium-permeable AMPA receptors induces a switch in receptor subtype. Nature. 2000;405:454–458. doi: 10.1038/35013064. [DOI] [PubMed] [Google Scholar]
- Losonczy A, Magee JC. Integrative properties of radial oblique dendrites in hippocampal CA1 pyramidal neurons. Neuron. 2006;50:291–307. doi: 10.1016/j.neuron.2006.03.016. [DOI] [PubMed] [Google Scholar]
- Lowe G. Flash photolysis reveals a diversity of ionotropic glutamate receptors on the mitral cell somatodendritic membrane. J Neurophysiol. 2003;90:1737–1746. doi: 10.1152/jn.00180.2003. [DOI] [PubMed] [Google Scholar]
- Matsuzaki M, Ellis-Davies GC, Nemoto T, Miyashita Y, Iino M, Kasai H. Dendritic spine geometry is critical for AMPA receptor expression in hippocampal CA1 pyramidal neurons. Nat Neurosci. 2001;4:1086–1092. doi: 10.1038/nn736. [DOI] [PMC free article] [PubMed] [Google Scholar]
- Mitchell SJ, Silver RA. Shunting inhibition modulates neuronal gain during synaptic excitation. Neuron. 2003;38:433–445. doi: 10.1016/s0896-6273(03)00200-9. [DOI] [PubMed] [Google Scholar]
- Morrison J, Wan P, Corrie JE, Papageorgiou G. Mechanisms of photorelease of carboxylic acids from 1-acyl-7-nitroindolines in solutions of varying water content. Photochem Photobiol Sci. 2002;1:960–969. [PubMed] [Google Scholar]
- Mosbacher J, Schoepfer R, Monyer H, Burnashev N, Seeburg PH, Ruppersberg JP. A molecular determinant for submillisecond desensitization in glutamate receptors. Science. 1994;266:1059–1062. doi: 10.1126/science.7973663. [DOI] [PubMed] [Google Scholar]
- Nielsen TA, DiGregorio DA, Silver RA. Modulation of glutamate mobility reveals the mechanism underlying slow-rising AMPAR EPSCs and the diffusion coefficient in the synaptic cleft. Neuron. 2004;42:757–771. doi: 10.1016/j.neuron.2004.04.003. [DOI] [PubMed] [Google Scholar]
- Otis TS, Wu YC, Trussell LO. Delayed clearance of transmitter and the role of glutamate transporters at synapses with multiple release sites. J Neurosci. 1996a;16:1634–1644. doi: 10.1523/JNEUROSCI.16-05-01634.1996. [DOI] [PMC free article] [PubMed] [Google Scholar]
- Otis T, Zhang S, Trussell LO. Direct measurement of AMPA receptor desensitization induced by glutamatergic synaptic transmission. J Neurosci. 1996b;16:7496–7504. doi: 10.1523/JNEUROSCI.16-23-07496.1996. [DOI] [PMC free article] [PubMed] [Google Scholar]
- Papageorgiou GCJ. Effects of aromatic substituents on the photocleavage of 1-acyl-7nitroindolines. Tetrahedron. 2000;56:8197–8205. [Google Scholar]
- Priel A, Kolleker A, Ayalon G, Gillor M, Osten P, Stern-Bach Y. Stargazin reduces desensitization and slows deactivation of the AMPA-type glutamate receptors. J Neurosci. 2005;25:2682–2686. doi: 10.1523/JNEUROSCI.4834-04.2005. [DOI] [PMC free article] [PubMed] [Google Scholar]
- Raman IM, Trussell LO. The kinetics of the response to glutamate and kainate in neurons of the avian cochlear nucleus. Neuron. 1992;9:173–186. doi: 10.1016/0896-6273(92)90232-3. [DOI] [PubMed] [Google Scholar]
- Raman IM, Trussell LO. The mechanism of alpha-amino-3-hydroxy-5-methyl-4-isoxazolepropionate receptor desensitization after removal of glutamate. Biophys J. 1995;68:137–146. doi: 10.1016/S0006-3495(95)80168-2. [DOI] [PMC free article] [PubMed] [Google Scholar]
- Raman IM, Zhang S, Trussell LO. Pathway-specific variants of AMPA receptors and their contribution to neuronal signaling. J Neurosci. 1994;14:4998–5010. doi: 10.1523/JNEUROSCI.14-08-04998.1994. [DOI] [PMC free article] [PubMed] [Google Scholar]
- Renden R, Taschenberger H, Puente N, Rusakov DA, Duvoisin R, Wang LY, Lehre KP, von Gersdorff H. Glutamate transporter studies reveal the pruning of metabotropic glutamate receptors and absence of AMPA receptor desensitization at mature calyx of held synapses. J Neurosci. 2005;25:8482–8497. doi: 10.1523/JNEUROSCI.1848-05.2005. [DOI] [PMC free article] [PubMed] [Google Scholar]
- Robert A, Howe JR. How AMPA receptor desensitization depends on receptor occupancy. J Neurosci. 2003;23:847–858. doi: 10.1523/JNEUROSCI.23-03-00847.2003. [DOI] [PMC free article] [PubMed] [Google Scholar]
- Rozov A, Jerecic J, Sakmann B, Burnashev N. AMPA receptor channels with long-lasting desensitization in bipolar interneurons contribute to synaptic depression in a novel feedback circuit in layer 2/3 of rat neocortex. J Neurosci. 2001;21:8062–8071. doi: 10.1523/JNEUROSCI.21-20-08062.2001. [DOI] [PMC free article] [PubMed] [Google Scholar]
- Sargent PB, Saviane C, Nielsen TA, DiGregorio DA, Silver RA. Rapid vesicular release, quantal variability and spillover contribute to the precision and reliability of transmission at a glomerular synapse. J Neurosci. 2005;25:8173–8187. doi: 10.1523/JNEUROSCI.2051-05.2005. [DOI] [PMC free article] [PubMed] [Google Scholar]
- Saviane C, Silver RA. Fast vesicle reloading and a large pool sustain high bandwidth transmission at a central synapse. Nature. 2006;439:983–987. doi: 10.1038/nature04509. [DOI] [PubMed] [Google Scholar]
- Sheppard CJR, Török P. Effects of specimen refractive index on confocal imaging. J Microsc. 1997;185:366–374. [Google Scholar]
- Silver RA, Cull-Candy SG, Takahashi T. Non-NMDA glutamate receptor occupancy and open probability at a rat cerebellar synapse with single and multiple release sites. J Physiol (Lond) 1996a;494:231–250. doi: 10.1113/jphysiol.1996.sp021487. [DOI] [PMC free article] [PubMed] [Google Scholar]
- Silver RA, Colquhoun D, Cull-Candy SG, Edmonds B. Deactivation and desensitization of non-NMDA receptors in patches and the time course of EPSCs in rat cerebellar granule cells. J Physiol (Lond) 1996b;493:167–173. doi: 10.1113/jphysiol.1996.sp021372. [DOI] [PMC free article] [PubMed] [Google Scholar]
- Silver RA, Momiyama A, Cull-Candy SG. Locus of frequency-dependent depression identified with multiple-probability fluctuation analysis at rat climbing fibre-Purkinje cell synapses. J Physiol (Lond) 1998;510:881–902. doi: 10.1111/j.1469-7793.1998.881bj.x. [DOI] [PMC free article] [PubMed] [Google Scholar]
- Smith MA, Ellis-Davies GC, Magee JC. Mechanism of the distance-dependent scaling of Schaffer collateral synapses in rat CA1 pyramidal neurons. J Physiol (Lond) 2003;548:245–258. doi: 10.1113/jphysiol.2002.036376. [DOI] [PMC free article] [PubMed] [Google Scholar]
- Smith TC, Wang LY, Howe JR. Heterogeneous conductance levels of native AMPA receptors. J Neurosci. 2000;20:2073–2085. doi: 10.1523/JNEUROSCI.20-06-02073.2000. [DOI] [PMC free article] [PubMed] [Google Scholar]
- Spruston N, Jonas P, Sakmann B. Dendritic glutamate receptor channels in rat hippocampal CA3 and CA1 pyramidal neurons. J Physiol (Lond) 1995;482:325–352. doi: 10.1113/jphysiol.1995.sp020521. [DOI] [PMC free article] [PubMed] [Google Scholar]
- Takayasu Y, Iino M, Ozawa S. Roles of glutamate transporters in shaping excitatory synaptic currents in cerebellar Purkinje cells. Eur J Neurosci. 2004;19:1285–1295. doi: 10.1111/j.1460-9568.2004.03224.x. [DOI] [PubMed] [Google Scholar]
- Takayasu Y, Iino M, Kakegawa W, Maeno H, Watase K, Wada K, Yanagihara D, Miyazaki T, Komine O, Watanabe M, Tanaka K, Ozawa S. Differential roles of glial and neuronal glutamate transporters in Purkinje cell synapses. J Neurosci. 2005;25:8788–8793. doi: 10.1523/JNEUROSCI.1020-05.2005. [DOI] [PMC free article] [PubMed] [Google Scholar]
- Tanaka J, Matsuzaki M, Tarusawa E, Momiyama A, Molnar E, Kasai H, Shigemoto R. Number and density of AMPA receptors in single synapses in immature cerebellum. J Neurosci. 2005;25:799–807. doi: 10.1523/JNEUROSCI.4256-04.2005. [DOI] [PMC free article] [PubMed] [Google Scholar]
- Taschenberger H, Scheuss V, Neher E. Release kinetics, quantal parameters and their modulation during short-term depression at a developing synapse in the rat CNS. J Physiol (Lond) 2005;568:513–537. doi: 10.1113/jphysiol.2005.093468. [DOI] [PMC free article] [PubMed] [Google Scholar]
- Tomita S, Adesnik H, Sekiguchi M, Zhang W, Wada K, Howe JR, Nicoll RA, Bredt DS. Stargazin modulates AMPA receptor gating and trafficking by distinct domains. Nature. 2005;435:1052–1058. doi: 10.1038/nature03624. [DOI] [PubMed] [Google Scholar]
- Trussell LO, Fischbach GD. Glutamate receptor desensitization and its role in synaptic transmission. Neuron. 1989;3:209–218. doi: 10.1016/0896-6273(89)90034-2. [DOI] [PubMed] [Google Scholar]
- Trussell LO, Zhang S, Raman IM. Desensitization of AMPA receptors upon multiquantal neurotransmitter release. Neuron. 1993;10:1185–1196. doi: 10.1016/0896-6273(93)90066-z. [DOI] [PubMed] [Google Scholar]
- Turetsky D, Garringer E, Patneau DK. Stargazin modulates native AMPA receptor functional properties by two distinct mechanisms. J Neurosci. 2005;25:7438–7448. doi: 10.1523/JNEUROSCI.1108-05.2005. [DOI] [PMC free article] [PubMed] [Google Scholar]
- van Kan PL, Gibson AR, Houk JC. Movement-related inputs to intermediate cerebellum of the monkey. J Neurophysiol. 1993;69:74–94. doi: 10.1152/jn.1993.69.1.74. [DOI] [PubMed] [Google Scholar]
- Wadiche JI, Jahr CE. Multivesicular release at climbing fiber-Purkinje cell synapses. Neuron. 2001;32:301–313. doi: 10.1016/s0896-6273(01)00488-3. [DOI] [PubMed] [Google Scholar]
- Wall MJ. Short-term synaptic plasticity during development of rat mossy fibre to granule cell synapses. Eur J Neurosci. 2005;21:2149–2158. doi: 10.1111/j.1460-9568.2005.04048.x. [DOI] [PubMed] [Google Scholar]
- Wall MJ, Robert A, Howe JR, Usowicz MM. The speeding of EPSC kinetics during maturation of a central synapse. Eur J Neurosci. 2002;15:785–797. doi: 10.1046/j.1460-9568.2002.01910.x. [DOI] [PubMed] [Google Scholar]
- Wong AY, Graham BP, Billups B, Forsythe ID. Distinguishing between presynaptic and postsynaptic mechanisms of short-term depression during action potential trains. J Neurosci. 2003;23:4868–4877. doi: 10.1523/JNEUROSCI.23-12-04868.2003. [DOI] [PMC free article] [PubMed] [Google Scholar]
- Xu-Friedman MA, Regehr WG. Ultrastructural contributions to desensitization at cerebellar mossy fiber to granule cell synapses. J Neurosci. 2003;23:2182–2192. doi: 10.1523/JNEUROSCI.23-06-02182.2003. [DOI] [PMC free article] [PubMed] [Google Scholar]
- Xu-Friedman MA, Regehr WG. Structural contributions to short-term synaptic plasticity. Physiol Rev. 2004;84:69–85. doi: 10.1152/physrev.00016.2003. [DOI] [PubMed] [Google Scholar]
- Zhang W, Robert A, Vogensen SB, Howe JR. The relationship between agonist potency and AMPA receptor kinetics. Biophys J. 2006;91:1336–1346. doi: 10.1529/biophysj.106.084426. [DOI] [PMC free article] [PubMed] [Google Scholar]
- Zipfel WR, Williams RM, Webb WW. Nonlinear magic: multiphoton microscopy in the biosciences. Nat Biotechnol. 2003;21:1369–1377. doi: 10.1038/nbt899. [DOI] [PubMed] [Google Scholar]