

Summary
The autosomal dominant form of retinitis pigmentosa (adRP) is a blindness-causing conformational disease largely linked to mutations of rhodopsin. Molecular simulations coupled to the graph-based protein structure network (PSN) analysis and in vitro experiments were conducted to determine the effects of 33 adRP rhodopsin mutations on the structure and routing of the opsin protein. The integration of atomic and subcellular levels of analysis was accomplished by the linear correlation between indices of mutational impairment in structure network and in routing. The graph-based index of structural perturbation served also to divide the mutants in four clusters, consistent with their differences in subcellular localization and responses to 9-cis retinal. The stability core of opsin inferred from PSN analysis was targeted by virtual screening of over 300,000 anionic compounds leading to the discovery of a reversible orthosteric inhibitor of retinal binding more effective than retinal in improving routing of three adRP mutants.
Subject Areas: Structural Biology, Protein Structure Aspects, Biophysics, Protein Folding
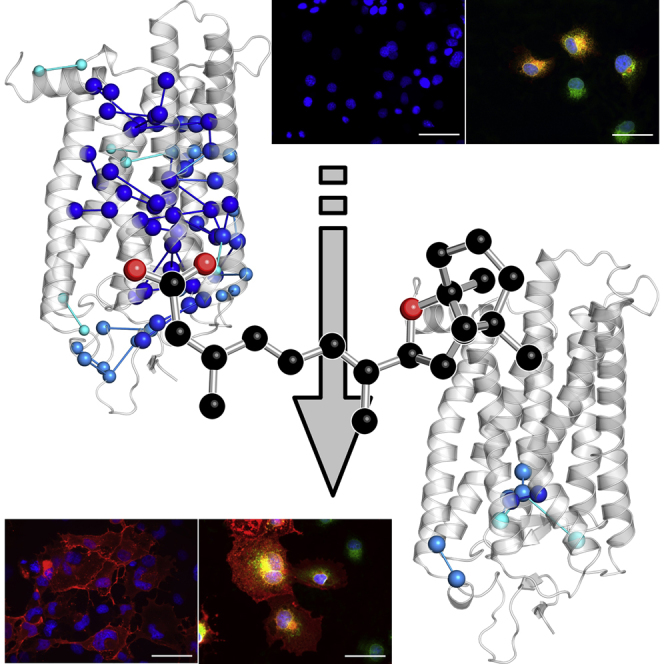
Graphical Abstract
Highlights
-
•
In silico and in vitro analyses of adRP rhodopsin mutants bridged folding and routing
-
•
Structure network analysis grouped mutants amenable to treatment with small chaperones
-
•
Virtual compound screening against the stability core of opsin found a small chaperone
-
•
The pharmacoperone is a reversible orthosteric inhibitor of retinal binding
Structural Biology; Protein Structure Aspects; Biophysics; Protein Folding
Introduction
Conformational and misassembly diseases are disorders of protein folding, often due to missense mutations, which compromise protein function (Sanders and Myers, 2004, Lin and Liu, 2006, Conn and Ulloa-Aguirre, 2010). Potential pharmacological therapies for these diseases are based on promoting correct folding, inhibiting aggregation, increasing degradation, or protection from cell death (Mendes and Cheetham, 2008, Mendes et al., 2005). Many diseases associated with misfolding and ER retention involve membrane proteins, including G protein-coupled receptors (GPCRs) like rhodopsin (RHO) (Conn and Ulloa-Aguirre, 2010, Sanders and Myers, 2004, Castro-Fernandez et al., 2005, Gregersen et al., 2006, Gregersen, 2006, Mendes et al., 2005).
Most of the over 140 missense mutations found in RHO are linked to the autosomal dominant form of retinitis pigmentosa (adRP) (Briscoe et al., 2004). Retinitis pigmentosa comprises a group of hereditary human diseases that are the most common cause of inherited blindness in developed countries (Kennan et al., 2005, Mendes et al., 2005). The majority of adRP RHO mutants have been the subject of extensive biochemical and cellular characterizations in heterologous expression systems and transgenic animals, leading to a classification into three major groups (I, IIa/II, and IIb/III) (reviewed in Briscoe et al., 2004, Krebs et al., 2010). Class I mutants resemble wild-type (WT) in yield, electrophoretic pattern, ability to regenerate with 11-cis retinal, and subcellular localization. In contrast, class IIa (or II in Krebs et al., 2010) and class IIb (or III in Krebs et al., 2010) mutants show altered membrane localization when expressed in cell culture in the absence of retinal and compromised or uncompromised abilities, respectively, to regenerate with retinal in vitro (Table S1). Another classification of RHO mutants linked to adRP and autosomal dominant congenital stationary night blindness (adCSNB) accounted not only for ER retention and impairment in retinal binding (class 2) but also for effects on other aspects of RHO function, such as post Golgi trafficking and outer segment targeting (class 1), vesicular trafficking and endocytosis (class 3), post-translational modifications (class 4), transducin activation (class 5), constitutive activity (class 6), and dimerization efficiency (class 7) (Mendes et al., 2005, Athanasiou et al., 2018) (Table S1).
Almost 90% of the biochemically characterized adRP RHO mutants are likely to be misfolded (reviewed in Briscoe et al., 2004, Krebs et al., 2010, Rakoczy et al., 2011, Athanasiou et al., 2018), supporting a protein-misfolding disease model suitable for treatment with pharmacological chaperones, i.e., small molecules that bind specific sites within a protein's native or quasi-native structure, thereby shifting the folding equilibrium toward the native state.
RHO is the visual pigment of rod photoreceptor cells that activates the phototransduction cascade following light capture (Palczewski, 2006). It is composed of a protein opsin (OPS) and a chromophore, 11-cis retinal, forming a protonated Schiff base (PSB) with the amino acid residue K296 (Figure 1A) (Palczewski, 2006). Opsins are densely packed into specific regions of the cell, the membranous discs of the rod outer segment (ROS), which prevents their random diffusion and allows efficient absorption of light (Palczewski, 2006, Kiser et al., 2014, Sakami et al., 2014, Fotiadis et al., 2003, Gunkel et al., 2015). Upon photon absorption that causes the cis-trans isomerization of 11-cis retinal, RHO ultimately reaches the metarhodopsin II (MII) state able to activate the heterotrimeric G protein transducin (Gt), thus triggering the visual phototransduction cascade (Hofmann et al., 2009).
Figure 1.

AdRP Mutation Sites and Thermally Stable Structure Networks of RHO and OPS
(A–C) (A) The illustration of the crystal structure of dark RHO is shown. Like all GPCRs, OPS comprises an up-down bundle of seven transmembrane helices (H) linked to three intracellular (IL) and three extracellular (EL) loops as well as to extracellular and intracellular termini. The intracellular side is on top. Herein, H1, H2, H3, H4, H5, H6, and H7 are blue, orange, green, pink, yellow, cyan, and violet, respectively. H8, the N- and C-termini are red, EL1 and IL1 are light green, EL2 and IL2 are gray, and EL3 and IL3 are magenta. Mutated sites are represented as spheres centered on the Cα-atoms. Black sticks represent 11-cis retinal. The stable structure networks of native RHO (B) and OPS (C) are shown on the crystal structures (PDB: 1GZM and 3CAP, respectively). Labeled and black (retinal) spheres are the stable native hubs (i.e., those amino acids involved in ≥4 links). Major structural differences between dark RHO and OPS essentially concern the cytosolic half of the H5-H6 portion, in particular H6 that in OPS is tilted outward from the helix bundle by 6–7 Å. See also Tables S1, S2, and S3.
RHO is the GPCR best characterized at atomic resolution in its inactive and active states. To date, high-resolution structures have been obtained for the dark state (Li et al., 2004, Palczewski et al., 2000), a number of photo-intermediates (reviewed in Palczewski, 2006, Fanelli and De Benedetti, 2011), an active form of the OPS apoprotein (Park et al., 2008), and the MII state (Choe et al., 2011).
The quantity of high-resolution information about the different RHO states makes this protein especially suitable for deciphering the structural determinants of conformational diseases linked to GPCR mutations. Indeed, understanding the molecular bases of such diseases requires the characterization of the interacting forces that found the native state and that, if impaired, lead to misfolding. Advances in that respect was made by our previous computational experiments that highlighted a number of adRP mutations as likely impairing the structural stability of the second extracellular loop (EL2) (Felline et al., 2009) and a number of highly connected amino acids in proximity to the retinal-binding site and the G protein-binding regions (Fanelli and Seeber, 2010). The latter study relied on the combination of mechanical unfolding simulations and protein structure network (PSN) analysis, a cutting-edge approach to unravel different aspects of protein function, including folding and stability (Vishveshwara et al., 2009, Fanelli et al., 2013).
In the present study, by integrating PSN analysis of novel molecular simulations with in vitro experiments, we determined the effects of 33 different adRP mutations on the native structure network and on the subcellular localization of both the RHO and OPS states. The putative stability core of the protein inferred from the PSN analysis was targeted by virtual screening of compounds leading to the discovery of a potential therapeutic agent as a pharmacological chaperone able to mitigate ER retention and restore plasma membrane localization of three adRP mutants.
Results
Local Perturbation at Mutation Sites
Molecular dynamics (MD) simulations of 33 adRP mutants in their apo and 11-cis retinal-bound states (Figure 1A, Table S2) were compared with those of the native RHO and OPS states. References on the discovery and biochemical characterization of the mutants under study are provided in Briscoe et al., 2004, Krebs et al., 2010, Rakoczy et al., 2011, Athanasiou et al., 2018.
Local perturbations induced by mutations displayed a variety of profiles (Table S2). Briefly, the N-terminus mutation sites are located in structured portions (i.e., a β-hairpin for T4 and two different types of turns for T17, P23, and Q28) and the mutations affect backbone conformation in addition to local side chain packing interactions, which may contribute to variations in N-linked glycosylation as observed for the mutants at T4, T17, and P23 (Tam and Moritz, 2009, Chen et al., 2014, Sakami et al., 2011). Effects on backbone conformation also arise from mutations of glycine, proline, and threonine in the helices (H) or in EL2.
Mutations in arginine often generate non-native salt bridges involving E25 or, more frequently, E122 or E181 (shadowed in Table S2). The only case of arginine replacement, the R135W mutant, is characterized by loss of the native salt bridges between R135 and both E134 and E247 and establishment of van der Waals interactions between W135 and hydrophobic amino acids in H6 (shadowed in Table S2). It is worth noting that R135 is the highly conserved arginine of the E/DRY motif, an amino acid residue playing a central role in G protein recognition as shown by X-ray crystallographic determinations (Scheerer et al., 2008, Rasmussen et al., 2011). The R135W mutant was found to be hyperphosphorylated and bound with high affinity to the visual protein arrestin (Chuang et al., 2004).
As for the three mutants characterized by an aspartate substitution (i.e. V87D, G89D, and G114D), the establishment of a non-native salt bridge concerns only D114 that, in the RHO form, acts as a counterion of the PSB (shadowed in Table S2). Other perturbations may result in either breakage of native disulfide bridges (C187Y), or formation of non-native disulfide bridges (Y178C), or both (C110Y) (shadowed in Table S2).
Structure Network-Based Characterization and Clustering of adRP Mutants
To determine similarities and differences between adRP mutants likely related to function despite the high heterogeneity of the local perturbations at the mutation site, our study focused on the long-range propagation of mutational effects. These were investigated by PSN analysis, which is based on the application of graph theory to protein structures (Brinda and Vishveshwara, 2005, Fanelli et al., 2013). In a protein structure graph (PSG), each amino acid is represented as a node and nodes are linked together based upon the strength of their non-covalent interaction. Hyperlinked nodes are defined as hubs, and they are likely to play a central role in protein stability. MD simulations of native OPS and RHO both at 300 K and at melting conditions (i.e., 329 K for OPS and 345 K for RHO [Khan et al., 1991]) served to identify the most stable (i.e., most persistent) structure network elements characterizing the native states.
To compute the native stable structure network, the frequencies of all hubs and links in the 300 K network were averaged with the frequencies of the same hubs and links in the corresponding melting temperature network (see Methods). Hubs and links holding an average frequency ≥50% were defined as stable and included in the native network. Native stable hubs in RHO tend to occur in EL2 as well as in all helices except for H1 and H4 (Figure 1B). EL2, H3, and H6 are particularly enriched in hubs, which include highly conserved amino acids (R135, F261, W265, Y268, and Y306 [Mirzadegan et al., 2003]) as well as amino acids involved in inter-helical interactions or in retinal binding (N78, E113, E122, W126, F203, H211, W265, Y268, and K296) (Table S3). A significant part of these hubs (M44, T94, R135, P180, Q184, D190, H211, and K296) are sites of pathogenic mutations (Briscoe et al., 2004). The chromophore is one of the most recurrent hubs (average frequency, 91%). The absence of this hub in OPS results in a significant rearrangement of the structure network (Figure 1C). Changes concern the loss of six stable hubs (from 23 to 17, Table S3) and 12 stable links (from 194 to 182, Table S3) in OPS compared with RHO, which correlates with the lower melting temperature of the former (Khan et al., 1991). While 76% of the native OPS stable hubs are retained in the RHO state, native stable links undergo a more significant rearrangement following the addition of 11-cis retinal. In fact, OPS and RHO share 106 stable links, whereas the number of links specific to one of the two forms is 76 for OPS and 88 for RHO (Table S3).
On this basis we used such network elements to describe and quantify likely structural differences between each mutant and the two native states generated by the absence or presence of retinal. The differences in structure networks between WT and mutants were effectively quantified using the following computational index, network perturbation (NP):
where is the number of missing native stable links in the mutant network and is the total number of native stable links. is the total number of native stable hubs and and are the frequencies of native stable hubs i in the mutant and WT networks, respectively. The higher the score, the greater the loss in native stable hubs and native stable links associated with a given mutant. The NP score accounts for mutation-induced perturbations in the structure network describing the native states of OPS and RHO.
The NP indices computed for OPS and RHO for each mutant (Figures 2A and 2B, respectively), and the differences between them (ΔNP, Figure 2C) were used to cluster the mutants (see Methods for details on clustering), leading to four groups (Figure 2 and Table S4). Cluster 1 (white in Figures 2A–2C) groups the mutants characterized by low NP in both OPS and RHO, as well as low ΔNP; cluster 2 (blue in Figures 2A–2C) groups the mutants characterized by high and low NP in OPS and RHO, respectively, as well as high ΔNP; cluster 4 (black in Figures 2A–2C) groups the mutants characterized by high NP in both OPS and RHO as well as low ΔNP. Finally, for the members of cluster 3, the NP values are high in OPS, whereas they tend to hold values between those of clusters 2 and 4 in RHO, resulting as well in intermediate ΔNP scores (gray in Figures 2A–2C). On average, clusters 1 and 4 show, respectively, the lowest and highest destabilization of the native structure network independent of the presence of 11-cis retinal, whereas cluster 2 resembles cluster 4 in the absence of 11-cis retinal and cluster 1 in the presence of 11-cis retinal (Figure 2D). In other words, for cluster 2 the presence of 11-cis retinal hinders structural impairments by the mutations.
Figure 2.

Network Perturbation (NP) Score and Outer van der Waals Volume (Vout) of Retinal as Markers of Structural Mutational Effects
(A–C) Plots of the NP score for OPS (A) and RHO (B) and the difference between them (C) are shown. Colors indicate the four clusters obtained by using the NP scores and the ΔNP between them. White, blue, gray, and black indicate clusters 1, 2, 3, and 4, respectively.
(D and E) (D) The average values of NP OPS, NP RHO, and ΔNP for each cluster of mutants are shown in a 3-axis plot that highlights the subdivision of the four clusters. The outer van der Waals volume (Vout, Å3) of 11-cis retinal in the average minimized structure of a given mutant relative to the 11-cis retinal van der Waals volume in the average minimized structure of WT RHO is shown (E).
See also Tables S1, S4, and S5 and Figures S1 and S2.
In addition, a linear trend was observed between the NP index and a spectroscopic index from the literature that accounts for the degree of misfolding of RHO mutants as compared with WT (Figure S1) (Kaushal and Khorana, 1994, Hwa et al., 1997, Hwa et al., 1999, Iannaccone et al., 2006, Andres et al., 2003, Stojanovic et al., 2003, Bhattacharya et al., 1992). This trend is consistent for eleven of the sixteen mutants for which the spectroscopic index could be determined. The spectroscopic index, which is the ratio between the absorbances at 280 nm (due to tryptophan and aromatic residues in the protein) and at 500 nm (reflecting 11-cis retinal binding), reflects the ratio between misfolded and folded (retinal-bound) protein. Since spectroscopic determinations of the different mutants were not made by the same laboratory, we divided the absorbance ratio (A280/A500) of a given mutant by that of the WT to normalize the indices. The WT index from the different laboratories ranged from 1.6 to 2 (Table S5). For the mutants C110Y, G114D, C167R, P171Q, Y178C, E181K, S186P, C187Y, D190Y, H211P, C222R, and P267L, some laboratories reported no detectable absorbance at 500 nm, indicating the absence of retinal binding (Andres et al., 2003, Hwa et al., 1997, Hwa et al., 1999, Kaushal and Khorana, 1994). This agrees with the observation that most of those mutants fall in clusters 3 and 4 assigned in this study. Consistently, most mutants, for which the A280/A500 index could be determined, fall in cluster 1. Together these data suggest that the NP score is somehow related to a commonly used index of RHO misfolding.
The selected NP is almost always the center of the three closest values obtained from different MD trajectories. The use of the NP index relative to a single MD trajectory (at the two different temperatures) instead of an average value served to favor structural interpretability, while keeping the main inferences from the analysis. Indeed, the results of cluster analysis do not change if they are based on the average NP values (Figure S2).
In summary, we defined a structure graph-based index describing the perturbations induced by adRP mutations on the native structure network of the OPS and RHO states. This index also served to divide the mutants into four clusters accounting for the different structural responses to retinal, which is maximal for the members of cluster 2.
Structural Signatures of the Four Clusters of adRP Mutants
The members of each cluster tend to share a common behavior in terms of 11-cis retinal deformation. The latter is described by the retinal outer van der Waals volume (i.e., the size/shape descriptor Vout, see Methods [De Benedetti and Fanelli, 2010, Fanelli and De Benedetti, 2011]) in a given mutant relative to the retinal volume in WT RHO (Figure 2E). The higher the value of Vout, the greater the degree of retinal deformation. As shown in Figure 2E and Table S4, cluster 1 and 2 mutants on average tend to show the lowest Vout values, whereas cluster 4 mutants show the highest value.
Signatures of each cluster, as inferred from the structure networks, are the native stable links that undergo an average frequency reduction ≥25% in the mutant trajectories participating in the cluster (Figure 3 and Table S6). As for the extracellular half of the receptor where the retinal-binding site is located, in the OPS state cluster 1 displays the lowest perturbation of native stable links compared with the other three clusters in terms of reduction in number and frequency (Figure 3A). Remarkably, the presence of 11-cis retinal prevents major perturbations shared in OPS by the members of cluster 1 and, more prominently, of cluster 2 (Figures 3A–3D), whereas the chromophore is less effective for clusters 3 and 4 (Figures 3E–3H).
Figure 3.

Native Stable Links Weakened by Mutation
(A–H) Native stable links undergoing an average reduction in frequency ≥25% within each cluster are shown on the crystal structures of OPS (A, C, E, and G) and RHO (B, D, F, and H). Nodes and links are colored according to their average frequency reduction. Cyan, dark cyan, blue, and dark blue represent average reductions up to 30%, 40%, 50%, and greater than 50%, respectively. See also Table S6.
In the RHO state the members of cluster 4 share link weakening that spans the retinal-binding site to the extreme N-terminus (Figures 3G and 3H) and involves (1) the links between E113 and both retinal and K296; (2) the links between M288 and Y268, V271, and I275; (3) the links in the amino acid pairs F9-F24, Q36-A32, T94-F293, S98-C185, C264-T297, and W265-A295; (4) the links between F283 and both I275 and F287; and (5) the network involving P12, N200, V204, and the amino acid stretch 189–194 (Table S6).
As for the intracellular half of OPS, all clusters share reduction in frequency for several native links that involve highly conserved amino acids and/or adRP mutation sites. These residues include N55 in H1, L125 and the glutamate and arginine pair of the ERY motif in H3, Y223 in H5, F261 in H6, the NPxxY motif in H7, and F313 in H8 (Figure 3 and Table S6). In contrast, in RHO all clusters share limited perturbation of the native stable links in the intracellular half, likely related to a long-range effect of retinal, which is greatest for the mutants in clusters 1 and 2 (Figure 3).
Collectively, all clusters show marked link destabilization in OPS as an effect of mutation on backbone and side-chain structure and dynamics. Major structural differences among the four clusters reside in the extent of the destabilization of native links in the extracellular half of the receptor and in the ability of 11-cis retinal to hinder such perturbations. The structural chaperone effect of 11-cis retinal reaches a maximum for cluster 2 and a minimum for cluster 4. The significant perturbation in the retinal-binding site, as highlighted by retinal deformation, suggests that cluster 4 mutants share defects in retinal binding.
Retinal Effects on the Subcellular Localization of WT and Mutated OPS
In vitro experiments in parallel to computational experiments served to determine the subcellular localization of WT and mutant OPS and RHO (Figure 4). The cDNAs were transiently transfected in COS-7 cells that expressed proteins with expected molecular weights (Figure S3A and Table S4). The use of COS-7 cells was dictated by the fact that no rod photoreceptor cell line is available that expresses rod photoreceptor genes, acquires photoreceptor morphology, and forms an outer segment in vitro. Use of a cell line that does not express OPS also allowed us to detect OPS in the WT and mutant forms using anti-OPS antibodies without the need to add tags that may affect the subcellular localization of the protein.
Figure 4.

Subcellular Localization of All Analyzed OPS Mutants in the Absence and Presence of Retinal
Representative images of the WT and all analyzed OPS mutants in the absence and presence of 10 μM 9-cis retinal are shown. 1D4/CLNX: merged image of the 1D4 (anti OPS/RHO intracellular C-terminus antibody, red) and the CLNX (anti-ER antibody, green) staining; RetP1 (anti extracellular N-terminus antibody, red) staining. Scale bars, 50 μm. See also Videos S1 and S2, Table S4, and Figures S3–S7.
The ability of 9-cis and 11-cis retinal to promote proper folding and trafficking has been previously demonstrated for the adRP mutants P23H, T17M, and Q28H (Li et al., 1998, Noorwez et al., 2004, Noorwez et al., 2009, Mendes and Cheetham, 2008, Krebs et al., 2010, Kiser et al., 2014). Thus, in the present study, protein expression was carried out both in the absence and presence of 9-cis retinal. In cell culture, 9-cis retinal is more stable than the 11-cis isomer and shows similar photoactivation properties making it a good substitute (Palczewski, 2010, Kiser et al., 2014). The ER localization of OPS and RHO was quantified by the Pearson correlation coefficients (PCC) for their co-localization with the ER-resident calnexin (CLNX), a chaperon for WT and misfolded OPS (Figure S3B) (see Methods) (Kosmaoglou and Cheetham, 2008, Noorwez et al., 2009). For the WT and the G114D mutant additional confocal analyses were performed to confirm the observed differences in the PCCs (Videos S1 and S2 and Supplemental Information). Plasma membrane localization was assessed in the absence of cell permeabilization by a monoclonal antibody, RetP1, recognizing the extracellular N-terminus of the protein. Membrane integration of the expressed proteins was quantified by the RetP1/1D4 ratios, where 1D4 is a monoclonal antibody against the OPS C-terminus. The choice of cell lines does not change the outcome, as demonstrated for the P23H mutant expressed in HeLa cells where similar values of PCC and RetP1/1D4 ratio were found (Latella et al., 2016).
Most of the mutations cause increased OPS ER retention, as defined by co-localization with CLNX (1D4/CLNX in Figure 4) and confirmed by a second ER marker (Figure S4), and drastically reduced plasma membrane localization compared with the WT (RetP1 in Figure 4). Only five mutants (T4K, G51A, L125R, V137M, and A164V) falling in cluster 1 exhibit WT-like localization. These mutants show little CLNX co-localization (PCCs, 0.47–0.53) and are detected at the cell surface in nearly every OPS-expressing cell (RetP1/1D4: 0.79–0.96), indicating that they are transported to the plasma membrane (Figure S5 and Table S4). Cluster 1 mutants M44T, F45L, T58R, G89D, G106R, and C167R also show WT-like membrane localization but with significantly higher PCCs (0.58–0.65) compared with the WT, indicating that these mutations may cause partial ER retention, whereas most of the protein is properly located at the cell surface. Consistent with the high PCCs, no plasma membrane localization is observed for the mutants T17M, P23H, L46R, P53R, C110Y, G114D, P171Q, Y178C, E181K, S186P, C187Y, G188R, D190G, D190Y, H211P, H211R, and C222R, falling into clusters 2–4, which was not due to failure of the antibody to recognize misfolded mutant protein (Figure S6). Despite their high PCC values, Q28H, V87D, R135W, P180A, and P267L show some cells labeled by the RetP1 antibody in the absence of membrane permeabilization, indicating that they are partially integrated at the plasma membrane (Figures 4 and S5). Compared with the WT, these mutants have drastically reduced RetP1/1D4 values (0.05–0.29), indicating that only a small fraction of the protein is transported to the plasma membrane (Figure 5).
Figure 5.

Linear Correlation between NP and PCC
(A and B) The scatterplots show the linear correlation between the NP accounting for mutational effects on the native structure network and the PCC index accounting for ER retention in the OPS (A) and RHO (B) states. The linear regression equations are PCC = 0.014NP + 0.071, r = 0.932 for OPS and PCC = 0.012NP + 0.273, r = 0.938 for RHO. The error-weighted correlation coefficients are 0.910 for OPS and 0.960 for RHO. The colors of circles reflect the structural cluster assignment for each mutant (see the legend to Figure 2). See also Figure S2.
When expressed in the presence of 9-cis retinal, most of the mutants that exhibit strong ER retention in OPS show significantly less CLNX co-localization and increased plasma membrane localization (Figures 4 and S5). Exposing transfected cells to all-trans retinal, on the other hand, has no effect on WT RHO, the WT-like mutant G51A, and a subset of mutants that respond to 9-cis retinal, thus confirming that the observed responses are specific for a conformation of the isomer capable of binding OPS (Figure S7).
Subcellular localization of WT and mutants that show WT-like or only slight ER retention in the absence of retinal do not significantly change when 9-cis retinal is present (Figures 4 and S5). The strongest effect of retinal is observed for the mutants P171Q, T17M, E181K, V87D, R135W, D190Y, Q28H, P180A, and P267L, falling into clusters 2 and 3 (Figure 2), which are characterized by a strong reduction in their PCCs and an increase of their RetP1/1D4 values (Figures 4 and S5).
Among these mutants, the best phenotypic rescues in terms of plasma membrane localization are detected for T17M and V87D that, exposed to 9-cis retinal, exhibit PCCs and RetP1/1D4 values similar to WT (Figures S5C and S5D and Table S4). The mutant Q28H also shows WT-like CLNX co-localization, although this mutant still has a slightly but significantly lower RetP1/1D4 value in the presence of 9-cis retinal (Figures S5C and S5D and Table S4). The mutants P171Q, E181K, R135W, D190Y, P267L, and P180A show drastically improved membrane localization with WT-like RetP1/1D4 values; however, all of them still have slightly but significantly higher PCCs, indicating that the presence of 9-cis retinal does not completely mitigate ER retention (Figures 4 and S5). Mutants S186P, D190G, Y178C, and P23H also respond to 9-cis retinal with a significant increase in RetP1/1D4 values and a decrease in PCCs, although they still exhibit significantly reduced membrane localization and strong CLNX co-localization, suggesting less effective pharmacological rescue (Figures 4, S5C, and S5D). As for the remaining mutants, which all fall in cluster 4, the three mutants G188R, C222R, and H221P show minimal responses to 9-cis retinal in terms of membrane localization (C222R and H221P) or ER retention (G188R). ER retention of mutants L46R, P53R, C110Y, G114D, C187Y, and H211R could not be mitigated by 9-cis retinal (Figures 4 and S5).
Comparison of the PCC-RetP1/1D4 correlation plots in the absence (Figure S5E) and presence (Figure S5F) of 9-cis retinal shows that the chromophore drastically improves plasma membrane localization and reduces ER retention in a large subset of mutants. However, most of these mutants still exhibit higher ER localization than the WT, indicating that 9-cis retinal can improve proper transport but it does not fully restore the WT phenotype for many of the mutants.
Importantly, for both the OPS and RHO states, the PCC index correlates linearly with either selected or average NP scores accounting for mutation-induced impairment in the native structure network (Figures 5 and S1). The correlation is such that the NP-based clustering produces the same results if based on PCC, implying a connection between defects in structure and sub-cellular localization.
Structure-Based Discovery of a Pharmacological Chaperone Targeting the Stability Core of the OPS Protein
Structure network analysis indicated that the retinal-binding site is part of the stability core of the protein since most of the native links and hubs undergoing weakening as an effect of misfolding adRP mutations locate in that region. This inference, together with the linear correlation found between mutational impairment in the native structure network and ER retention, highlights the retinal-binding site as a suitable target for virtual screening to discover small chaperones, i.e., pharmacological chaperones able to improve the folding and routing of adRP mutants. A library of negatively charged compounds from the ZINC database (http://zinc.docking.org/[Irwin and Shoichet, 2005, Irwin et al., 2012] see Methods) was computationally screened against the retinal-binding site using the Glide software (Friesner et al., 2004, Friesner et al., 2006). Compounds were primarily filtered according to the docking score leading to one hit list (made of 1,000 compounds) per docking run (i.e., onto different structures). Vdif served as an additional index to select compounds that in addition to a relatively good docking score had a relatively high Vdif relative to 11-cis retinal (see Methods). It is worth noting that volume comparisons were performed for compounds taken in their docking/interaction mode with the protein. The index therefore accounts both for shape similarity between each ligand and 11-cis retinal and for their degree of overlap in the binding site (see Methods). In this respect, Vdif cannot be considered a canonical ligand-based index.
Twenty compounds (Table S7) of a list of 254 hits checked for commercial availability were probed in vitro for their ability to favor plasma membrane localization of T17M, the mutant from cluster 2 most responsive to retinal. Like retinal, all the selected compounds except one had predicted octanol/water partition coefficients, i.e., xlogP, ≥ 5 (the xlogP of 11-cis retinal is 5.80 [http://zinc.docking.org/]).
The same experimental conditions as those used in this study to test the effects of 9-cis retinal were applied for in vitro compound screening. One compound, 5,8-epoxy-13-cis retinoic acid (hereafter named 13-cis-5,8-ERA [Table 1], compound 1 in Table S7) was able to mitigate ER retention and promote plasma membrane localization of T17M (Figure 6A). The PCC and RetP1/1D4 indices in the presence of 10 μM 13-cis-5,8-ERA are, respectively, 0.50 and 0.60, similar to 9-cis retinal, 0.46 and 0.59 (Tables S8 and S9).
Table 1.
EC50 Values with Respect to PCC and RetP1/1D4 Immunostaining Comparing 9-cis Retinal and 13-cis-5,8-ERA
 | ||||||
|---|---|---|---|---|---|---|
| In Vitro Effect | T17M |
P23H |
E181K |
|||
| EC50Ret | EC50ERA | EC50Ret | EC50ERA | EC50Ret | EC50ERA | |
| PCC | 8.0 | 9.8 | 17.3 | 9.3 | 9.4 | 4.5 |
| RetP1/1D4 | 5.4 | 4.6 | 8.0 | 4.8 | 1.1 | 0.5 |
EC50Ret and EC50ERA are, respectively, the μM EC50 values of 9-cis retinal and 13-cis-5,8-ERA relative to ER retention (accounted for by PCC) and plasma membrane localization (accounted for by RetP1/1D4 immunostaining) of T17M, P23H, and E181K mutants. A mixture of four optical isomers of 13-cis-5,8-ERA was employed in EC50 determinations. See also Table S7.
Figure 6.

Effects of 13-cis-5,8-ERA on Three Mutants
(A–C) Representative immunofluorescence images depicting the subcellular localization of T17M (A), P23H (B), and E181K (C) mutants in the OPS state (i.e. - 9-cis retinal), in the presence of 10 μM 9-cis retinal, and in the presence of 10 μM 13-cis-5,8-ERA. CLNX/1D4: merged image of the anti-CLNX antibody staining (green) and the anti-OPS/RHO 1D4 antibody staining against the intracellular C-terminus (red); RetP1: staining of membrane localized OPS/RHO with the RetP1 antibody against the extracellular N-terminus. Scale bars, 50 μm.
(D–I) COS-7 transfected cells were exposed to different concentrations of 9-cis retinal (black circles) or 13-cis-5,8-ERA (black squares). Values are the means (±SD) from the analysis of at least ten transfected cells from three independent experiments. PCC values were derived from the analysis of co-localization of calnexin and OPS/RHO (CLNX/1D4) for the T17M (D), P23H (E), and E181K (F) mutants. Ratios of RetP1-positive cells and 1D4-positive cells were computed for the T17M (G), P23H (H), and E181K (I) mutants.
See also Table S8.
The 13-cis-5,8-ERA, which comprises a mixture of commercially available optical isomers (i.e., 5S8R, 5R8S, 5R8R, and 5S8S), proved effective as a pharmacological chaperone also for the P23H mutant from cluster 3 (Figure 6B) and another mutant from cluster 2, E181K (Figure 6C). P23H was tested because it is the adRP mutant most studied in vivo (Comitato et al., 2016, Sakami et al., 2011, Sakami et al., 2014, Chiang et al., 2015), whereas E181K was selected for testing based on the hypothesis that the substituting lysine would stabilize the protein-chaperone complex through an additional intermolecular salt bridge.
The Tanimoto coefficient (based on RDKit circular Morgan fingerprints [1,024 bits]) accounting for the similarity between 13-cis-5,8-ERA and 11-cis retinal is 0.588 (Table S7), which is lower than the cutoff suitable to cluster compounds according to chemical similarity. Thus, according to the Tanimoto coefficient, among the 20 selected compounds, 13-cis-5,8-ERA is the most similar to 11-cis retinal; however, the similarity is not so striking as also indicated by the Vdif index.
To quantitatively compare the pharmacological chaperone activity of 13-cis-5,8-ERA with that of 9-cis retinal, for the three adRP mutants the EC50 values were computed relative to the PCC and RetP1/1D4 indices (Figures 6D–6I and Table S8). The 13-cis-5,8-ERA compound is slightly less effective than 9-cis retinal toward the T17M mutant, especially with regard to the effect on ER retention (Table 1 and Figures 6D and 6G), whereas its effectiveness toward P23H and E181K is 2-fold higher than that of 9-cis retinal both in mitigating ER retention (Table 1 and Figures 6E and 6F) and promoting plasma membrane localization (Table 1 and Figures 6H and 6I).
The 13-cis-5,8-ERA from the screened library corresponds to the 5S8R isomer. To better characterize the effect of the compound on the native structure network of the protein, the other three isomers were docked into the retinal-binding site as well. The complexes between WT and mutated forms and the four distinct isomers were subjected to MD simulation and PSN analysis, following the protocol set in this study. In all complexes, the carboxylate of 13-cis-5,8-ERA establishes charge-reinforced H-bonds with S186 (in EL2), Y268 (in H6), and K296 (in H7) (Figures 7, S8, and S9). A peculiarity of the E181K mutant is the formation of an additional salt bridge between the substituting amino acid and the carboxylate of the ligand (Figures S8 and S9). The olefinic chain of the ligand makes van der Waals interactions with I189 (in EL2) and Y268 (in H6). Finally, the bicyclic moiety of the ligand occupies the same site as the β-ionone ring of retinal, making van der Waals interactions with M207, F208, F210 (all in H5), and W265 (in H6). There is consistency in the interaction mode regarding the carboxylate end of the ligand, whereas major divergences among the four isomers occur at the bicyclic end. Collectively, while occupying the same binding site, 13-cis-5,8-ERA and 11-cis retinal display divergent interactions (Figure S9).
Figure 7.

Effects of 13-cis-5,8-ERA on the Native Structure Network
(A–I) Native stable links undergoing reduction in frequency ≥25% are shown in the T17M (A, B, and C), P23H (D, E, and F), and E181K (G, H, and I) adRP mutants. Panels A, D, and G portray the OPS state; panels B, E, and H illustrate the RHO state; and panels C, F, and I show the 13-cis-5,8-ERA-bound forms. For each mutant, the native stable links in the complexes with the four isomers of 13-cis-5,8-ERA that undergo an average reduction in frequency ≥25% are shown. Cyan, dark cyan, blue, and dark blue represent average reductions up to 30%, 40%, 50%, and greater than 50%, respectively. Perturbed links are mapped onto the average minimized structures from 300 K simulations. As for the 13-cis-5,8-ERA-bound forms, perturbed links are mapped onto the average minimized structure of the complexes with the 5S8R isomer. All four isomers are represented by sticks and extracted from the respective average minimized structures (5S8R is green, 5R8S is yellow, 5R8R is violet, and 5S8S is pink). See also Figures S8 and S9.
To mimic in vitro determinations, which were carried out on a mixture of isomers, the structural chaperone effect of 13-cis-5,8-ERA on T17M, P23H, and E181K mutants was described by an NP score averaged over the scores of the single isomers, i.e., 25 ± 4.54 for T17M, 32.91 ± 4.66 for P23H, and 26.35 ± 4.12 for E181K. The average NP scores of the new compound relative to the three mutants are consistent with the effect of the compound on ER retention as accounted for by PCC. In line with the demonstrated ability of 13-cis-5,8-ERA to relieve ER retention and improve plasma membrane localization for all three mutants, the number of native links undergoing a reduction in frequency ≥25% is significantly lower in the presence of the compound compared with the OPS state (Figure 7). For P23H and E181K, the average structural chaperone effect of the four isomers is greater than that of retinal, in line with in vitro EC50 determinations (Figures 6 and 7).
To validate the predictions from computational experiments that 13-cis-5,8-ERA docks at the retinal-binding site, the binding of the compound to OPS was evaluated by monitoring the changes in OPS tryptophan (Trp) fluorescence with varied concentrations of the ligand. The changes in the Trp fluorescence reflect the conformational changes in the chromophore-binding pocket induced upon ligand binding (Farrens and Khorana, 1995). A typical quenching of fluorescence associated with W265 was noted upon treatment with increasing concentrations of 9-cis retinal (Figure 8A). 13-cis-5,8-ERA displayed a similar quenching pattern (Figure 8B). This finding suggests that 13-cis-5,8-ERA either binds to the chromophore-binding pocket or exerts an allosteric binding affect that can lead to conformational changes in the chromophore-binding pocket. The EC50 of 13-cis-5,8-ERA to OPS (8.6 ± 0.2 nM) was 14-fold lower compared with 9-cis retinal (123.9 ± 7.0 nM) (Figures 8A and 8B). Additionally, we tested the effect of 13-cis-5,8-ERA on the regeneration rate of iso-rhodopsin pigment by using time-dependent UV-Vis spectroscopy. As expected, addition of 9-cis-retinal to OPS membranes resulted in the Schiff base formation (λmax = 487 nm) between 9-cis retinal and K296 (Figure 8C, red trace). However, pre-treatment of OPS membranes with 10 molar excess of 13-cis-5,8-ERA resulted in a significant decrease in both the iso-rhodopsin regeneration rates (τ1/2 = 3.4233 ± 0.716 min compared with 1.3694 ± 0.848 min for 9-cis retinal) and the total iso-rhodopsin formation (88.04 ± 2.39% relative to 9-cis retinal alone) (Figures 8C and 8D). The ability of 9-cis retinal to bind 13-cis-5,8-ERA pre-treated OPS and to form iso-rhodopsin pigment suggests a reversible binding of 13-cis-5,8-ERA to the protein. Overall, these findings suggest that 13-cis-5,8-ERA induces a conformational change in the OPS chromophore-binding pocket and might compete with 9-cis-retinal for OPS binding.
Figure 8.

13-cis-5,8-ERA Binding to Bovine Opsin
(A and B) Changes in tryptophan fluorescence at 332 nm (ΔF/F0) with increasing concentrations of 9-cis retinal (A) or 13-cis-5,8-ERA (B). Results are expressed as the mean ± SD, n = 2, each with three biological replicates.
(C and D) UV-visible absorption spectra measured at 4 min after 9-cis retinal addition (C) and time-dependent absorption at 487 nm (D) showing the effect of 13-cis-5,8-ERA pre-treatment on the formation of iso-rhodopsin pigment. Results are expressed as the mean ± SD, n = 2, each with three biological replicates. OPS membranes treated with 7.5 μM 9-cis retinal for 4 min showed a new absorption peak at 487 nm owing to the formation of iso-rhodopsin pigment (red). A decrease in iso-rhodopsin formation and regeneration rate was observed when OPS membranes were pre-treated with 37.5 μM of 13-cis-5,8-ERA for 15 min (purple) followed by the addition of 7.5 μM 9-cis retinal.
In summary, virtual screening of compound libraries led to the discovery of a pharmacological chaperone more effective than retinal toward three adRP mutants selected from the most responsive clusters. The compound was not revealed by previous virtual screening of the same proteins, owing to different computational conditions and the selected libraries (Noorwez et al., 2008). The ability of the novel chaperone to relieve perturbations in the native structure network is consistent with its ability to correct routing of the mutated protein. The combination of molecular simulations, sub-cellular localization by immunohistochemistry, and binding detection by biophysical assays indicates that the chaperone activity of 13-cis-5,8-ERA is due to the establishment of distinct intermolecular interactions with amino acids in the retinal-binding site.
Discussion
Retinitis pigmentosa is a composite of varied retinal dystrophies most frequently leading to inherited blindness. Although progress has been made in understanding the genetic basis of the disease, the development of effective therapeutic interventions is still lacking. adRP linked to mutations in the GPCR RHO are part of the family of conformational diseases, whose structural determinants are still unknown (reviewed in Conn and Ulloa-Aguirre, 2010).
Pharmacological chaperones are promising therapeutic agents for the treatment of misfolding diseases linked to missense mutations. They consist of small molecules that enter cells, specifically bind to misfolded mutant proteins, and stabilize them in a conformational state that allows passing ER quality control systems (Conn and Ulloa-Aguirre, 2010, Ulloa-Aguirre et al., 2004, Bernier et al., 2004). The discovery and development of such therapeutic agents cannot be accomplished without significant knowledge of the structural defects engendered by the various mutations.
In the present study, WT and 33 adRP mutants were subjected to parallel in silico and in vitro experiments aimed at characterizing and quantifying mutational effects on structural stability and ER retention of the protein, ultimately establishing a connection between the two distinct levels of analysis. The working hypothesis motivating our computational experiments is that adRP mutants classified as misfolded indeed represent “quasi-native” states of OPS.
The analysis of molecular simulations relied on structure network parameters (i.e., hubs and links) as a strategy to study issues of protein structure instability likely pertaining to conformational diseases (Fanelli and Seeber, 2010). In this context, equilibrium MD simulations at 300 K and melting temperatures were instrumental in investigating mutational effects on the native structure networks of the RHO and OPS states. Employing the native structure network as a frame of reference helped to describe mutational effects in terms of quantifiable impairments in the intramolecular interactions characterizing the native state. We observed that in the absence of 11-cis retinal the majority of the 33 adRP mutants show marked impairment in stable native hubs and links as an effect of mutation on the backbone and side-chain structures and dynamics. In the presence of 11-cis retinal, such perturbations decrease significantly for a subset of mutants. This agrees with other evidence that OPS is less stable than RHO even in the native state (Khan et al., 1991). A computational index, NP, quantifying mutation-induced impairment in the native structure networks of both OPS and RHO served to structurally classify the 33 different mutants. Such clustering permitted the identification of common structural traits despite different mutations. Those traits were embodied in those native links that become less stable as an effect of mutation. These signatures are crude in that they depict an average behavior, with the understanding that each mutant has its own structural distinctions. Yet, we preferred to focus on common structural effects of mutations from the same cluster to achieve a structure-based classification of adRP mutants with therapeutic implications.
In vitro experiments served to determine the subcellular localization of WT and mutant forms of OPS in the absence and presence of 9-cis retinal, which led to the development of an index of ER retention (PCC) based on co-localization of OPS/RHO and calnexin. The finding of a linear correlation between NP and PCC indices led us to associate the structural signatures of each cluster of mutants with the tendency toward ER retention, an important step toward connecting defects in structure and sub-cellular localization. Indeed, in the OPS state, cluster 1 mutants tend to share the lowest hub and link weakening compared with the other clusters, especially in the extracellular regions, which may relate to their lowest ER retention and highest plasma membrane localization compared with the other mutants. Marked ER retention and low plasma membrane localization for clusters 2, 3, and 4 are instead associated with hub and link weakening in both the extracellular and intracellular portions. The distinction between these three clusters, with emphasis on clusters 2 and 4, essentially relies on the effect of retinal. The in vitro chaperone effect of retinal on cluster 2 mutants is likely related to the ability of the chromophore to prevent major mutational effects on the native structure network. In comparison, the inability of retinal to exert a chaperone effect for cluster 4 mutants is likely due to the inability of the chromophore to properly bind and establish native connections with the protein. Indeed, for these mutants link weakening involves the retinal itself, core-facing nodes in the extracellular regions of H2 (T94 and S98), H3 (E113 and T118), H5 (F203 and V204), H6 (C264, W265, Y268, V271, and I275), and H7 (P287, M288, F293, A295, K296, and T297), as well as nodes on both the N-terminus (T4, F9, P12, N15, V20, F24, Y30, A32) and EL2 (W175, P180, K181, C185, P186, I189, D190, Y191, Y192, T193, P194, and N200). Previously, some of these residues had been predicted to participate in the stability core of the protein (Rader et al., 2004). Link weakening in the retinal-binding site for cluster 4 mutants nicely relates to retinal deformation as indicated by the Vout size/shape descriptor, thus strengthening the hypothesis that retinal cannot bind such mutants properly in line with early in vitro evidence from retinal reconstitution experiments (reviewed in Briscoe et al., 2004, Krebs et al., 2010, Rakoczy et al., 2011, Athanasiou et al., 2018). The structural and cellular behaviors of cluster 3 mutants lie between those of clusters 2 and 4.
Thus the integration of atomic and sub-cellular levels of analysis led to the finding that the structural stability of the protein, impaired as an effect of mutations, correlated with ER retention. The quantitative relation between structural deviation from the native state and ER retention is of remarkable value since ER retention has been correlated with the pathological phenotype in published studies, although limited to a subset of the mutants analyzed here (Kosmaoglou et al., 2009, Krebs et al., 2010, Griciuc et al., 2011, Comitato et al., 2016).
The correlation between NP and PCC scores implies that the classification of mutants based on their structural impairment is consistent with the classification based on their ER retention. Mutational effects on ER retention and the ability of OPS to bind retinal underlie earlier classifications of adRP RHO mutants (reviewed in Briscoe et al., 2004, Krebs et al., 2010). Our in vitro data on the OPS states are substantially in agreement with previous characterizations of subcellular localization in the absence of retinal (reviewed in Briscoe et al., 2004, Krebs et al., 2010). Apparent discrepancies regard two mutants (L125R and C167R) assigned to Krebs class II but localized at the membrane in this study and one mutant (L46R) assigned to class I but retained in the ER in this study. In contrast, few discrepancies concern the response to retinal that relies on a completely different approach in the present study. Previous studies evaluated the ability of the protein to regenerate with retinal, as detected by spectroscopic analyses, whereas the present study evaluated the ability of retinal to influence the subcellular localization of the mutants. In this study, five (P171Q, Y178C, E181K, S186P, and D190Y) of eleven (C110Y, G114D, P171Q, Y178C, E181K, S186P, C187Y, D190Y, H211P, H211R, and C222R) mutants previously found incapable of binding retinal (Krebs et al., 2010) were localized in the ER in the OPS form but could improve their plasma membrane distribution and relieve ER retention as an effect of retinal.
Another classification, which has been recently updated, divides RHO mutants into seven classes (classes 1–7). Class 2 encompasses those mutants considered as misfolded because of their ER retention and inability to reconstitute with retinal, whereas the other classes contain mutants thought to be properly folded but impaired in different aspects of function (Athanasiou et al., 2018). Consistently, cluster 2, 3, and 4 mutants from this study, which are retained in the ER at least in their OPS form, fell into class 2. Consistency was also found for a number of mutants in our clusters 1 and 2, which fall in classes 3 (R135W), 4 (T4K and T17M), 5 (M44T and V137M), and 7 (F45L) by Athanasiou and co-workers and include also a mutant considered as a benign single mutant polymorphism (G51A) (Athanasiou et al., 2018). Indeed, for such mutants that show plasma membrane localization at least in their RHO form, defects other than ER retention may cause the pathologic phenotype. In contrast, six of the eleven mutants in our cluster 1 (T58R, G89D, G106R, L125R, A164V, C167R), which are moderately retained in the ER in the OPS form, are considered misfolded by Athanasiou and co-workers and ascribed to class 2 (Athanasiou et al., 2018).
Early mass spectrometry determinations on four adRP mutants postulated partial (for G89D and A164V) or complete (for L125R and P211H) misfolding of OPS owing to the formation of a non-native disulfide bridge between C185 and C187 in EL2 (Hwa et al., 2001). Three of those mutants fall on our cluster 1, suggesting that, if present, such an intra-loop disulfide bridge would remain compatible with a protein quasi-native state properly targeted to the plasma membrane.
Collectively, this investigation revealed some retinal responsiveness in the majority of the 33 adRP mutants, including a number of mutants previously classified as misfolded. This supports our working hypothesis that such mutants indeed represent quasi-native states of the OPS protein still capable of binding retinal.
The results of the integrated in silico and in vitro analyses suggest that ER retention and compromised plasma membrane localization of OPS are related to the loss or weakening of native connections involving the retinal-binding site as well as highly conserved nodes in the cytosolic regions. These findings support a structural communication whereby mutations exert long-range destabilizing effects on common nodes and links in the structure network necessary for the stability of the protein. Therefore, the putative stability core of the protein inferred from PSN analysis was targeted by virtual screening of over 300,000 anionic compounds. Mutant clusters based on structure network impairment were exploited to select three retinal-responsive mutants, i.e., T17M, P23H, and E181K from clusters 2 and 3, for in vitro analyses. One compound, an oxidation product of the 13-cis retinoic acid (Liang et al., 2003), 13-cis-5,8-ERA, of 20 tested compounds proved able to relieve ER retention and favor the plasma membrane localization of all three mutants. For E181K and, to a lesser extent, P23H, the pharmacological chaperone action of 13-cis-5,8-ERA was 2-fold greater than that of 9-cis retinal. For the E181K mutant, the enhanced effect may be due, at least in part, to the formation of an additional intermolecular salt bridge between the substituting lysine and the carboxylate of the ligand. The chaperone action of 13-cis-5,8-ERA is likely due to its ability to stabilize OPS by occupying in a reversible manner the retinal-binding site. The compound was tested as a mixture of four optical isomers reflecting the presence of two chiral centers on the condensed bicyclic group. MD simulations of the four distinct isomers toward the three mutants revealed divergences solely in the binding mode of the bicyclic moiety, the carboxylic site showing overlapping binding modes in the different isomers. This suggests that isomer separation may lead to some improvement in the chaperone activity of the compound. The average effect of the four isomers on relieving native link weakening caused by the mutation is in line with in vitro observations, thus highlighting the ability of the graph-based approach to infer the structural bases of conformational diseases linked to missense mutations.
In summary, ER retention and compromised plasma membrane localization shared by most of the mutants considered in this study are related to the loss or weakening of native intramolecular interactions involving the retinal-binding site as well as highly conserved amino acids in the cytosolic regions. These structural effects can be variably attenuated by retinal unless perturbations cause significant deformations in the retinal-binding site thus compromising proper binding of the chromophore. Several adRP mutants, especially those in clusters 2 and 3, are amenable to treatment with pharmacological chaperones that limit ER retention and subsequent ER stress by improving structural stability and routing of OPS. Together these data suggest that the majority of the ER-retained adRP RHO mutants considered in this study hold “quasi-native” structures that can be stabilized by small compounds able to establish specific interactions with the retinal-binding site. On this basis, by targeting the putative stability core of the protein, we discovered a reversible orthosteric inhibitor of retinal binding able to correct the misrouting of three adRP mutants from clusters 2 and 3, T17M, P23H, and E181K. For P23H and E181K the compound is more effective than 9-cis retinal as a chaperone. Virtual screening allowed reduction by more than four orders of magnitude the number of compounds necessary for in vitro testing, ultimately leading to the discovery of a promising pharmacological chaperone from more than 300,000 compounds screened in silico and 20 compounds screened in vitro.
The present study generated the tools for discovering and designing small compounds able to mitigate the structural destabilization caused by misfolding mutations. A promising pharmacological chaperone has been discovered, which holds the potential to be translated into a therapeutic agent for adRP linked to RHO mutations. The comprehensive analysis of adRP mutations derived from this study also may be valuable for researchers developing new therapeutic approaches based on small chaperones. The strategy described here to discover a small chaperone can be applied to various conformational diseases linked to missense mutations of proteins with known structure.
Methods
All methods can be found in the accompanying Transparent Methods supplemental file.
Acknowledgments
We acknowledge the CIGS of the University of Modena for providing confocal microscopy assistance. This study was supported by Telethon-Italy grant [GGP11210] and by Fondazione Roma grant (call for proposals 2013 on Retinitis Pigmentosa) to both F.F. and V.M. This research was supported in part by grants from the National Institutes of Health (EY009339, EY027283, and EY024864 to K.P.). K.P. is the John H. Hord Professor of Pharmacology.
Author Contributions
P.B. performed the site-directed mutagenesis of RHO cDNA and the in vitro characterization of the 33 adRP mutants. A.F. implemented and performed the PSN analyses. A.C. and M.T.D.S. performed the in vitro screening of compounds. F.R. conducted the virtual screening and performed docking simulations. V.M. designed the strategy for in vitro analyses. F.F. conceived the study, ran molecular simulations, conducted virtual screenings, and performed structural analyses and compound selection. S.G. and S.K. performed the opsin binding assays. P.B., A.F., V.M., F.F., S.G., S.K., and K.P. contributed to writing and editing the manuscript.
Declaration of Interests
The authors declare no competing interests.
Published: June 29, 2018
Footnotes
Supplemental Information includes Transparent Methods, nine figures, nine tables, and two videos and can be found with this article online at https://doi.org/10.1016/j.isci.2018.05.001.
Contributor Information
Valeria Marigo, Email: valeria.marigo@unimore.it.
Francesca Fanelli, Email: fanelli@unimo.it.
Supplemental Information
Shown are stacks of optical sections through a single WT OPS-expressing cell. Optical sections were gathered in 0.4 μm steps on the z-axis (perpendicular to the x-y axis). Shown in red is the expressed OPS immunostained with a 1D4 antibody against the C-terminus of the protein. Staining of calnexin (CLNX) in the ER is shown in green. Nuclei were stained with DAPI (blue). Although some co-localization of OPS and CLNX (yellow) could be detected inside the cell, most of the OPS staining was detected at the periphery and did not co-localize with CLNX. Scale bar, 25 μm.
Shown are stacks of optical sections through a single G114D OPS-expressing cell as described for WT OPS (Video S1). Shown in red is the expressed G114D mutant immunostained with a 1D4 antibody against the C-terminus of OPS. Staining of calnexin (CLNX) in the ER is shown in green. Nuclei were stained with DAPI (blue). In contrast to WT, the G114D mutant was detected entirely inside the cell and co-localized with CLNX (yellow). Scale bar, 25 μm.
References
- Andres A., Garriga P., Manyosa J. Altered functionality in rhodopsin point mutants associated with retinitis pigmentosa. Biochem. Biophys. Res. Commun. 2003;303:294–301. doi: 10.1016/s0006-291x(03)00328-0. [DOI] [PubMed] [Google Scholar]
- Athanasiou D., Aguila M., Bellingham J., Li W.W., Mcculley C., Reeves P.J., Cheetham M.E. The molecular and cellular basis of rhodopsin retinitis pigmentosa reveals potential strategies for therapy. Prog. Retin. Eye Res. 2018;62:1–23. doi: 10.1016/j.preteyeres.2017.10.002. [DOI] [PMC free article] [PubMed] [Google Scholar]
- Bernier V., Lagace M., Lonergan M., Arthus M.F., Bichet D.G., Bouvier M. Functional rescue of the constitutively internalized V2 vasopressin receptor mutant R137H by the pharmacological chaperone action of SR49059. Mol. Endocrinol. 2004;18:2074–2084. doi: 10.1210/me.2004-0080. [DOI] [PubMed] [Google Scholar]
- Bhattacharya S., Ridge K.D., Knox B.E., Khorana H.G. Light-stable rhodopsin. I. A rhodopsin analog reconstituted with a nonisomerizable 11-cis retinal derivative. J. Biol. Chem. 1992;267:6763–6769. [PubMed] [Google Scholar]
- Brinda K.V., Vishveshwara S. A network representation of protein structures: implications for protein stability. Biophys. J. 2005;89:4159–4170. doi: 10.1529/biophysj.105.064485. [DOI] [PMC free article] [PubMed] [Google Scholar]
- Briscoe A.D., Gaur C., Kumar S. The spectrum of human rhodopsin disease mutations through the lens of interspecific variation. Gene. 2004;332:107–118. doi: 10.1016/j.gene.2004.02.037. [DOI] [PubMed] [Google Scholar]
- Castro-Fernandez C., Maya-Nunez G., Conn P.M. Beyond the signal sequence: protein routing in health and disease. Endocr. Rev. 2005;26:479–503. doi: 10.1210/er.2004-0010. [DOI] [PubMed] [Google Scholar]
- Chen Y., Jastrzebska B., Cao P., Zhang J., Wang B., Sun W., Yuan Y., Feng Z., Palczewski K. Inherent instability of the retinitis pigmentosa P23H mutant opsin. J. Biol. Chem. 2014;289:9288–9303. doi: 10.1074/jbc.M114.551713. [DOI] [PMC free article] [PubMed] [Google Scholar]
- Chiang W.C., Kroeger H., Sakami S., Messah C., Yasumura D., Matthes M.T., Coppinger J.A., Palczewski K., Lavail M.M., Lin J.H. Robust endoplasmic reticulum-associated degradation of rhodopsin precedes retinal degeneration. Mol. Neurobiol. 2015;52:679–695. doi: 10.1007/s12035-014-8881-8. [DOI] [PMC free article] [PubMed] [Google Scholar]
- Choe H.W., Kim Y.J., Park J.H., Morizumi T., Pai E.F., Krauss N., Hofmann K.P., Scheerer P., Ernst O.P. Crystal structure of metarhodopsin II. Nature. 2011;471:651–655. doi: 10.1038/nature09789. [DOI] [PubMed] [Google Scholar]
- Chuang J.Z., Vega C., Jun W., Sung C.H. Structural and functional impairment of endocytic pathways by retinitis pigmentosa mutant rhodopsin-arrestin complexes. J. Clin. Invest. 2004;114:131–140. doi: 10.1172/JCI21136. [DOI] [PMC free article] [PubMed] [Google Scholar]
- Comitato A., Di Salvo M.T., Turchiano G., Montanari M., Sakami S., Palczewski K., Marigo V. Dominant and recessive mutations in rhodopsin activate different cell death pathways. Hum. Mol. Genet. 2016;25:2801–2812. doi: 10.1093/hmg/ddw137. [DOI] [PubMed] [Google Scholar]
- Conn P.M., Ulloa-Aguirre A. Trafficking of G-protein-coupled receptors to the plasma membrane: insights for pharmacoperone drugs. Trends Endocrinol. Metab. 2010;21:190–197. doi: 10.1016/j.tem.2009.11.003. [DOI] [PMC free article] [PubMed] [Google Scholar]
- De Benedetti P.G., Fanelli F. Computational quantum chemistry and adaptive ligand modeling in mechanistic QSAR. Drug Discov. Today. 2010;15:859–866. doi: 10.1016/j.drudis.2010.08.003. [DOI] [PubMed] [Google Scholar]
- Fanelli F., De Benedetti P.G. Update 1 of: computational modeling approaches to structure-function analysis of G protein-coupled receptors. Chem. Rev. 2011;111:PR438–PR535. doi: 10.1021/cr100437t. [DOI] [PubMed] [Google Scholar]
- Fanelli F., Felline A., Raimondi F. Network analysis to uncover the structural communication in GPCRs. Methods Cell Biol. 2013;117:43–61. doi: 10.1016/B978-0-12-408143-7.00003-7. [DOI] [PubMed] [Google Scholar]
- Fanelli F., Seeber M. Structural insights into retinitis pigmentosa from unfolding simulations of rhodopsin mutants. FASEB J. 2010;24:3196–3209. doi: 10.1096/fj.09-151084. [DOI] [PubMed] [Google Scholar]
- Farrens D.L., Khorana H.G. Structure and function in rhodopsin .11. Measurement of the rate of Metarhodopsin-Ii decay by fluorescence spectroscopy. J. Biol. Chem. 1995;270:5073–5076. doi: 10.1074/jbc.270.10.5073. [DOI] [PubMed] [Google Scholar]
- Felline A., Seeber M., Rao F., Fanelli F. Computational screening of rhodopsin mutations associated with retinitis pigmentosa. J. Chem. Theory Comput. 2009;5:2472–2485. doi: 10.1021/ct900145u. [DOI] [PubMed] [Google Scholar]
- Fotiadis D., Liang Y., Filipek S., Saperstein D.A., Engel A., Palczewski K. Atomic-force microscopy: rhodopsin dimers in native disc membranes. Nature. 2003;421:127–128. doi: 10.1038/421127a. [DOI] [PubMed] [Google Scholar]
- Friesner R.A., Banks J.L., Murphy R.B., Halgren T.A., Klicic J.J., Mainz D.T., Repasky M.P., Knoll E.H., Shelley M., Perry J.K. Glide: a new approach for rapid, accurate docking and scoring. 1. Method and assessment of docking accuracy. J. Med. Chem. 2004;47:1739–1749. doi: 10.1021/jm0306430. [DOI] [PubMed] [Google Scholar]
- Friesner R.A., Murphy R.B., Repasky M.P., Frye L.L., Greenwood J.R., Halgren T.A., Sanschagrin P.C., Mainz D.T. Extra precision glide: docking and scoring incorporating a model of hydrophobic enclosure for protein-ligand complexes. J. Med. Chem. 2006;49:6177–6196. doi: 10.1021/jm051256o. [DOI] [PubMed] [Google Scholar]
- Gregersen N. Protein misfolding disorders: pathogenesis and intervention. J. Inherit. Metab. Dis. 2006;29:456–470. doi: 10.1007/s10545-006-0301-4. [DOI] [PubMed] [Google Scholar]
- Gregersen N., Bross P., Vang S., Christensen J.H. Protein misfolding and human disease. Annu. Rev. Genomics Hum. Genet. 2006;7:103–124. doi: 10.1146/annurev.genom.7.080505.115737. [DOI] [PubMed] [Google Scholar]
- Griciuc A., Aron L., Ueffing M. ER stress in retinal degeneration: a target for rational therapy? Trends Mol. Med. 2011;17:442–451. doi: 10.1016/j.molmed.2011.04.002. [DOI] [PubMed] [Google Scholar]
- Gunkel M., Schoneberg J., Alkhaldi W., Irsen S., Noe F., Kaupp U.B., Al-Amoudi A. Higher-order architecture of rhodopsin in intact photoreceptors and its implication for phototransduction kinetics. Structure. 2015;23:628–638. doi: 10.1016/j.str.2015.01.015. [DOI] [PubMed] [Google Scholar]
- Hofmann K.P., Scheerer P., Hildebrand P.W., Choe H.W., Park J.H., Heck M., Ernst O.P. A G protein-coupled receptor at work: the rhodopsin model. Trends Biochem. Sci. 2009;34:540–552. doi: 10.1016/j.tibs.2009.07.005. [DOI] [PubMed] [Google Scholar]
- Hwa J., Garriga P., Liu X., Khorana H.G. Structure and function in rhodopsin: packing of the helices in the transmembrane domain and folding to a tertiary structure in the intradiscal domain are coupled. Proc. Natl. Acad. Sci. USA. 1997;94:10571–10576. doi: 10.1073/pnas.94.20.10571. [DOI] [PMC free article] [PubMed] [Google Scholar]
- Hwa J., Klein-Seetharaman J., Khorana H.G. Structure and function in rhodopsin: mass spectrometric identification of the abnormal intradiscal disulfide bond in misfolded retinitis pigmentosa mutants. Proc. Natl. Acad. Sci. USA. 2001;98:4872–4876. doi: 10.1073/pnas.061632798. [DOI] [PMC free article] [PubMed] [Google Scholar]
- Hwa J., Reeves P.J., Klein-Seetharaman J., Davidson F., Khorana H.G. Structure and function in rhodopsin: further elucidation of the role of the intradiscal cysteines, Cys-110, -185, and -187, in rhodopsin folding and function. Proc. Natl. Acad. Sci. USA. 1999;96:1932–1935. doi: 10.1073/pnas.96.5.1932. [DOI] [PMC free article] [PubMed] [Google Scholar]
- Iannaccone A., Man D., Waseem N., Jennings B.J., Ganapathiraju M., Gallaher K., Reese E., Bhattacharya S.S., Klein-Seetharaman J. Retinitis pigmentosa associated with rhodopsin mutations: correlation between phenotypic variability and molecular effects. Vision Res. 2006;46:4556–4567. doi: 10.1016/j.visres.2006.08.018. [DOI] [PubMed] [Google Scholar]
- Irwin J.J., Shoichet B.K. ZINC–a free database of commercially available compounds for virtual screening. J. Chem. Inf. Model. 2005;45:177–182. doi: 10.1021/ci049714. [DOI] [PMC free article] [PubMed] [Google Scholar]
- Irwin J.J., Sterling T., Mysinger M.M., Bolstad E.S., Coleman R.G. ZINC: a free tool to discover chemistry for biology. J. Chem. Inf. Model. 2012;52:1757–1768. doi: 10.1021/ci3001277. [DOI] [PMC free article] [PubMed] [Google Scholar]
- Kaushal S., Khorana H.G. Structure and function in rhodopsin. 7. Point mutations associated with autosomal dominant retinitis pigmentosa. Biochemistry. 1994;33:6121–6128. doi: 10.1021/bi00186a011. [DOI] [PubMed] [Google Scholar]
- Kennan A., Aherne A., Humphries P. Light in retinitis pigmentosa. Trends Genet. 2005;21:103–110. doi: 10.1016/j.tig.2004.12.001. [DOI] [PubMed] [Google Scholar]
- Khan S.M.A., Bole W., Hargrave P.A., Santoro M.M., Mcdowell J.H. Differential scanning calorimetry of bovine rhodopsin in rod-outer-segment disk membranes. Eur. J. Biochem. 1991;200:53–59. doi: 10.1111/j.1432-1033.1991.tb21047.x. [DOI] [PubMed] [Google Scholar]
- Kiser P.D., Golczak M., Palczewski K. Chemistry of the retinoid (visual) cycle. Chem. Rev. 2014;114:194–232. doi: 10.1021/cr400107q. [DOI] [PMC free article] [PubMed] [Google Scholar]
- Kosmaoglou M., Cheetham M.E. Calnexin is not essential for mammalian rod opsin biogenesis. Mol. Vis. 2008;14:2466–2474. [PMC free article] [PubMed] [Google Scholar]
- Kosmaoglou M., Kanuga N., Aguila M., Garriga P., Cheetham M.E. A dual role for EDEM1 in the processing of rod opsin. J. Cell Sci. 2009;122:4465–4472. doi: 10.1242/jcs.055228. [DOI] [PMC free article] [PubMed] [Google Scholar]
- Krebs M.P., Holden D.C., Joshi P., Clark C.L., 3rd, Lee A.H., Kaushal S. Molecular mechanisms of rhodopsin retinitis pigmentosa and the efficacy of pharmacological rescue. J. Mol. Biol. 2010;395:1063–1078. doi: 10.1016/j.jmb.2009.11.015. [DOI] [PubMed] [Google Scholar]
- Latella M.C., Di Salvo M.T., Cocchiarella F., Benati D., Grisendi G., Comitato A., Marigo V., Recchia A. In vivo editing of the human mutant Rhodopsin gene by electroporation of plasmid-based CRISPR/Cas9 in the mouse retina. Mol. Ther. Nucleic Acids. 2016;5:e389. doi: 10.1038/mtna.2016.92. [DOI] [PMC free article] [PubMed] [Google Scholar]
- Li J., Edwards P.C., Burghammer M., Villa C., Schertler G.F. Structure of bovine rhodopsin in a trigonal crystal form. J. Mol. Biol. 2004;343:1409–1438. doi: 10.1016/j.jmb.2004.08.090. [DOI] [PubMed] [Google Scholar]
- Li T., Sandberg M.A., Pawlyk B.S., Rosner B., Hayes K.C., Dryja T.P., Berson E.L. Effect of vitamin A supplementation on rhodopsin mutants threonine-17--> methionine and proline-347--> serine in transgenic mice and in cell cultures. Proc. Natl. Acad. Sci. USA. 1998;95:11933–11938. doi: 10.1073/pnas.95.20.11933. [DOI] [PMC free article] [PubMed] [Google Scholar]
- Liang Y., Fotiadis D., Filipek S., Saperstein D.A., Palczewski K., Engel A. Organization of the G protein-coupled receptors rhodopsin and opsin in native membranes. J. Biol. Chem. 2003;278:21655–21662. doi: 10.1074/jbc.M302536200. [DOI] [PMC free article] [PubMed] [Google Scholar]
- Lin J.C., Liu H.L. Protein conformational diseases: from mechanisms to drug designs. Curr. Drug Discov. Technol. 2006;3:145–153. doi: 10.2174/157016306778108866. [DOI] [PubMed] [Google Scholar]
- Mendes H.F., Cheetham M.E. Pharmacological manipulation of gain-of-function and dominant-negative mechanisms in rhodopsin retinitis pigmentosa. Hum. Mol. Genet. 2008;17:3043–3054. doi: 10.1093/hmg/ddn202. [DOI] [PubMed] [Google Scholar]
- Mendes H.F., Van Der Spuy J., Chapple J.P., Cheetham M.E. Mechanisms of cell death in rhodopsin retinitis pigmentosa: implications for therapy. Trends Mol. Med. 2005;11:177–185. doi: 10.1016/j.molmed.2005.02.007. [DOI] [PubMed] [Google Scholar]
- Mirzadegan T., Benko G., Filipek S., Palczewski K. Sequence analyses of G-protein-coupled receptors: similarities to rhodopsin. Biochemistry. 2003;42:2759–2767. doi: 10.1021/bi027224+. [DOI] [PMC free article] [PubMed] [Google Scholar]
- Noorwez S.M., Malhotra R., Mcdowell J.H., Smith K.A., Krebs M.P., Kaushal S. Retinoids assist the cellular folding of the autosomal dominant retinitis pigmentosa opsin mutant P23H. J. Biol. Chem. 2004;279:16278–16284. doi: 10.1074/jbc.M312101200. [DOI] [PubMed] [Google Scholar]
- Noorwez S.M., Ostrov D.A., Mcdowell J.H., Krebs M.P., Kaushal S. A high-throughput screening method for small-molecule pharmacologic chaperones of misfolded rhodopsin. Invest. Ophthalmol. Vis. Sci. 2008;49:3224–3230. doi: 10.1167/iovs.07-1539. [DOI] [PubMed] [Google Scholar]
- Noorwez S.M., Sama R.R., Kaushal S. Calnexin improves the folding efficiency of mutant rhodopsin in the presence of pharmacological chaperone 11-cis-retinal. J. Biol. Chem. 2009;284:33333–33342. doi: 10.1074/jbc.M109.043364. [DOI] [PMC free article] [PubMed] [Google Scholar]
- Palczewski K. G protein-coupled receptor rhodopsin. Annu. Rev. Biochem. 2006;75:743–767. doi: 10.1146/annurev.biochem.75.103004.142743. [DOI] [PMC free article] [PubMed] [Google Scholar]
- Palczewski K. Retinoids for treatment of retinal diseases. Trends Pharmacol. Sci. 2010;31:284–295. doi: 10.1016/j.tips.2010.03.001. [DOI] [PMC free article] [PubMed] [Google Scholar]
- Palczewski K., Kumasaka T., Hori T., Behnke C.A., Motoshima H., Fox B.A., Le Trong I., Teller D.C., Okada T., Stenkamp R.E. Crystal structure of rhodopsin: a G protein-coupled receptor. Science. 2000;289:739–745. doi: 10.1126/science.289.5480.739. [DOI] [PubMed] [Google Scholar]
- Park J.H., Scheerer P., Hofmann K.P., Choe H.W., Ernst O.P. Crystal structure of the ligand-free G-protein-coupled receptor opsin. Nature. 2008;454:183–187. doi: 10.1038/nature07063. [DOI] [PubMed] [Google Scholar]
- Rader A.J., Anderson G., Isin B., Khorana H.G., Bahar I., Klein-Seetharaman J. Identification of core amino acids stabilizing rhodopsin. Proc. Natl. Acad. Sci. USA. 2004;101:7246–7251. doi: 10.1073/pnas.0401429101. [DOI] [PMC free article] [PubMed] [Google Scholar]
- Rakoczy E.P., Kiel C., Mckeone R., Stricher F., Serrano L. Analysis of disease-linked rhodopsin mutations based on structure, function, and protein stability calculations. J. Mol. Biol. 2011;405:584–606. doi: 10.1016/j.jmb.2010.11.003. [DOI] [PubMed] [Google Scholar]
- Rasmussen S.G., DeVree B.T., Zou Y., Kruse A.C., Chung K.Y., Kobilka T.S., Thian F.S., Chae P.S., Pardon E., Calinski D. Crystal structure of the beta(2) adrenergic receptor-Gs protein complex. Nature. 2011;469:175–181. doi: 10.1038/nature10361. [DOI] [PMC free article] [PubMed] [Google Scholar]
- Sakami S., Kolesnikov A.V., Kefalov V.J., Palczewski K. P23H opsin knock-in mice reveal a novel step in retinal rod disc morphogenesis. Hum. Mol. Genet. 2014;23:1723–1741. doi: 10.1093/hmg/ddt561. [DOI] [PMC free article] [PubMed] [Google Scholar]
- Sakami S., Maeda T., Bereta G., Okano K., Golczak M., Sumaroka A., Roman A.J., Cideciyan A.V., Jacobson S.G., Palczewski K. Probing mechanisms of photoreceptor degeneration in a new mouse model of the common form of autosomal dominant retinitis pigmentosa due to P23H opsin mutations. J. Biol. Chem. 2011;286:10551–10567. doi: 10.1074/jbc.M110.209759. [DOI] [PMC free article] [PubMed] [Google Scholar]
- Sanders C.R., Myers J.K. Disease-related misassembly of membrane proteins. Annu. Rev. Biophys. Biomol. Struct. 2004;33:25–51. doi: 10.1146/annurev.biophys.33.110502.140348. [DOI] [PubMed] [Google Scholar]
- Scheerer P., Park J.H., Hildebrand P.W., Kim Y.J., Krauss N., Choe H.W., Hofmann K.P., Ernst O.P. Crystal structure of opsin in its G-protein-interacting conformation. Nature. 2008;455:497–502. doi: 10.1038/nature07330. [DOI] [PubMed] [Google Scholar]
- Stojanovic A., Hwang I., Khorana H.G., Hwa J. Retinitis pigmentosa rhodopsin mutations L125R and A164V perturb critical interhelical interactions: new insights through compensatory mutations and crystal structure analysis. J. Biol. Chem. 2003;278:39020–39028. doi: 10.1074/jbc.M303625200. [DOI] [PubMed] [Google Scholar]
- Tam B.M., Moritz O.L. The role of rhodopsin glycosylation in protein folding, trafficking, and light-sensitive retinal degeneration. J. Neurosci. 2009;29:15145–15154. doi: 10.1523/JNEUROSCI.4259-09.2009. [DOI] [PMC free article] [PubMed] [Google Scholar]
- Ulloa-Aguirre A., Janovick J.A., Brothers S.P., Conn P.M. Pharmacologic rescue of conformationally-defective proteins: implications for the treatment of human disease. Traffic. 2004;5:821–837. doi: 10.1111/j.1600-0854.2004.00232.x. [DOI] [PubMed] [Google Scholar]
- Vishveshwara S., Ghosh A., Hansia P. Intra and inter-molecular communications through protein structure network. Curr. Protein Pept. Sci. 2009;10:146–160. doi: 10.2174/138920309787847590. [DOI] [PubMed] [Google Scholar]
Associated Data
This section collects any data citations, data availability statements, or supplementary materials included in this article.
Supplementary Materials
Shown are stacks of optical sections through a single WT OPS-expressing cell. Optical sections were gathered in 0.4 μm steps on the z-axis (perpendicular to the x-y axis). Shown in red is the expressed OPS immunostained with a 1D4 antibody against the C-terminus of the protein. Staining of calnexin (CLNX) in the ER is shown in green. Nuclei were stained with DAPI (blue). Although some co-localization of OPS and CLNX (yellow) could be detected inside the cell, most of the OPS staining was detected at the periphery and did not co-localize with CLNX. Scale bar, 25 μm.
Shown are stacks of optical sections through a single G114D OPS-expressing cell as described for WT OPS (Video S1). Shown in red is the expressed G114D mutant immunostained with a 1D4 antibody against the C-terminus of OPS. Staining of calnexin (CLNX) in the ER is shown in green. Nuclei were stained with DAPI (blue). In contrast to WT, the G114D mutant was detected entirely inside the cell and co-localized with CLNX (yellow). Scale bar, 25 μm.