Abstract
In this paper, the design of a smart headband for epileptic seizure detection is presented. The proposed headband consists of four key components: 1) an analog front-end circuitry; 2) an epileptic seizure detection tag (ESDT); 3) a Bluetooth low-power chip; and 4) customized electrodes. All the above components are integrated into a fabric headband with only 50.3 g. The smart headband system dissipates 55.89 mW. The epileptic seizure detection algorithm inside ESDT is validated by using Boston Children’s Hospital’s CHB-MIT scalp EEG clinical database with the detection rate of 92.68% and the false alarm of 0.527/h. We develop a service APP connected to the cloud so that the patients’ health condition can be recorded and then referenced by doctors for further diagnosis or research.
Keywords: Epileptic seizure detection, wearable, wireless transmission, system-on-chip (SoC), Internet of Things (IoT)
We present the design and validation of a smart headband and connected app for epileptic seizure detection. The headband detected 92.68% of seizures with a false alarm rate of 0.527/hour.
I. Introduction
Epilepsy is one of the most common neurological disorder. About 65 million people in the world are affected [1]. One of the treatments is to use antiepileptic drugs to control epileptic seizure, but nearly 30% of the patients are resistant to epileptic medicine [2], [3]. The other therapy is to remove the epileptogenic zone by the resection surgery. Nevertheless, the patients above will still suffer seizures occasionally, which will affect the patients’ quality of lives, and further trigger dangers to patients themselves and the people around them.
In recent years, alternative treatments and devices are proposed to investigate and treat epilepsy in addition to pharmacological and surgical treatments. Several prosthesis devices with deep brain stimulation [4], [5] become popular clinical solutions. These devices use the open-loop continuous neural stimulations to control medical refractory epilepsies complementarily with the limited effective rate around 45%. Besides, by using battery with continuous stimulations, the lifetime of such a device is quite limited. The periodical operations for clients are necessary to replace the battery and devices. To overcome the above limitations, researchers [5]–[8] proposed a close-loop epilepsy prosthesis device with temporospatial seizure detection and therapeutic stimulation responsively.
However, implementing the implantable devices requires a complicated, high cost and time consuming surgical procedure. The implanted devices will only benefit the 30% patients with drug resistant epilepsy. The other 70% patients who are taking antiepileptic drugs still suffer from accidental epileptic seizures and its consequences.
Several wearable devices have been developed for seizure detection [9]–[14]. These devices use ECG [11], EMG [12] or body motion [10]–[14] to detect seizure. However, for seizure detection, the EEG signals are the most direct bio-potential signal. Thus, all the above works can only focus on post-ictal seizure detection or alarming.
Therefore, a wearable seizure detection headband system is desirable to avoid the aforementioned emergent medical situations and complicate surgical procedure. Thus, the development of a smart headband for the epilepsy patients is paramount importance.
The wearable device for epilepsy patient has three main purposes: 1) Seizure detection, 2) seizure alarming and 3) recording of 30–60 seconds pre-ictal and ictal EEG signals for precise diagnosis.
Once a seizure is detected, the following actions will be triggered: 1) The headband will notify a smartphone to identify the location of the incidence; 2) According to the location (home, office, or transportation vehicles), suitable emergency procedures, such as informing doctors, calling the families, and dispatching an ambulance will be triggered. These actions can be prioritized by smartphone APPs; 3) The headband will keep the last 30s-60s of EEG signals before the seizure occurs.
This work has four key advantages. First, the entire system can be fitted in the compact fabric headband. Second, its weight is only 50.3 g. Third, through the energy-efficient hardware accelerators and the low computational complexity classifier, the processing time and energy is reduced by 32.8 times and 8.5 times compared to the 32-bit processor-based design [15]. Last but not least, an APP for this smart headband is integrated with cloud to record patients’ health states.
The rest of this paper is organized as follows. Section II describes the proposed circuit design and system architecture. Section III investigates how the epileptic seizure detection algorithm can be implemented in the proposed real-time system. In Section IV experimental results are presented and we conclude this paper in Section V.
II. Proposed Circuits and Systems
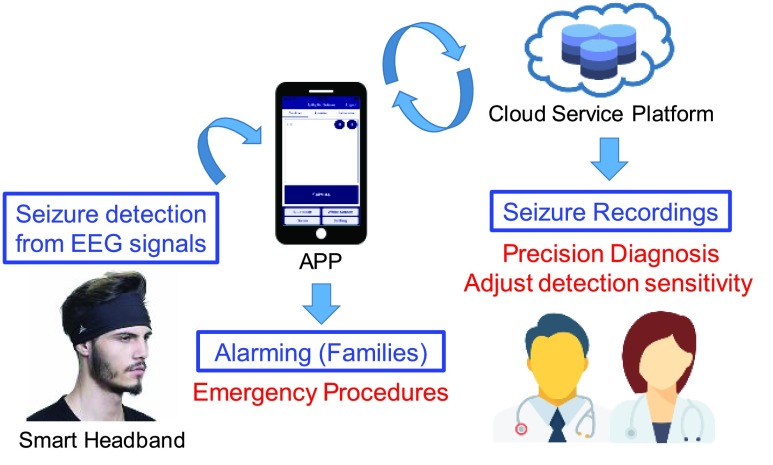
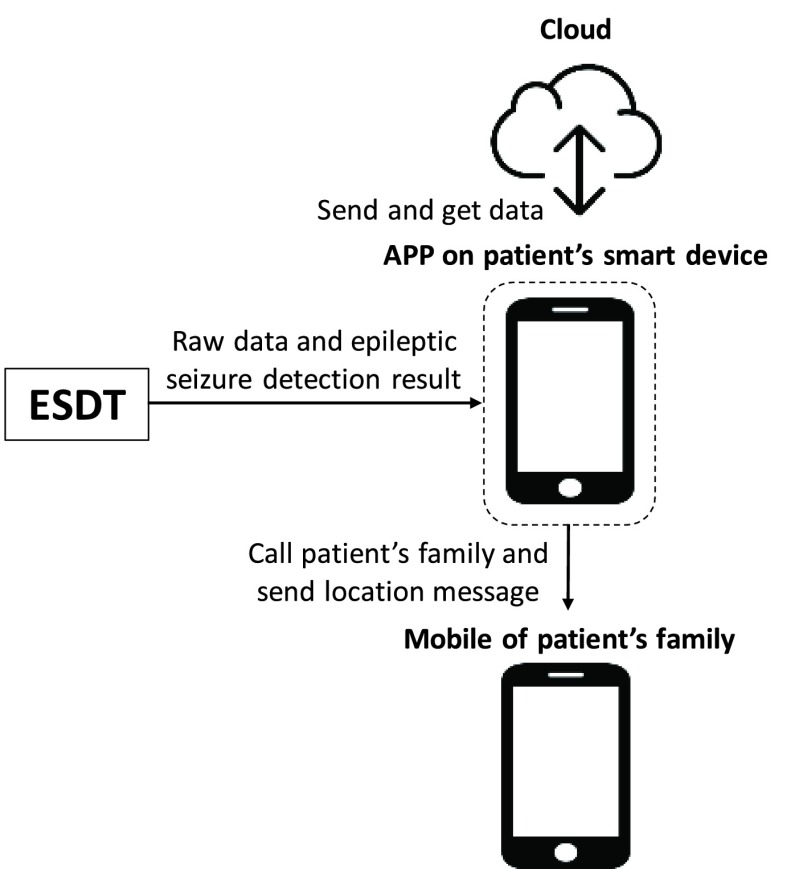
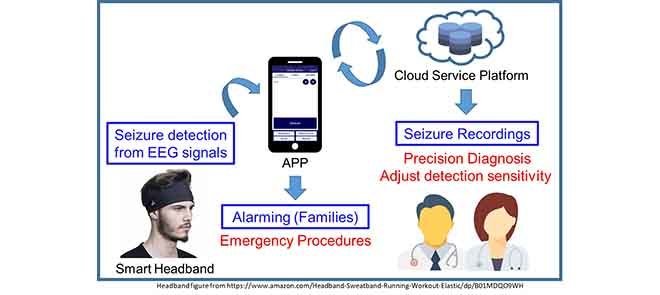
The proposed system includes the design of a smart headband and the corresponding APP integrated with cloud service computing for seizure detection, alarming and EEG recording. The application scenario of proposed system is shown in Fig. 1. The smart headband is design for seizure detection. When a seizure is detected, corresponding APP will give notification to the patient’s family for emergency procedure and will also upload 30–60 seconds pre-ictal and ictal EEG signals to the cloud for doctor to diagnosis the patient in clinical visits.
FIGURE 1.
Application scenario of the proposed system.
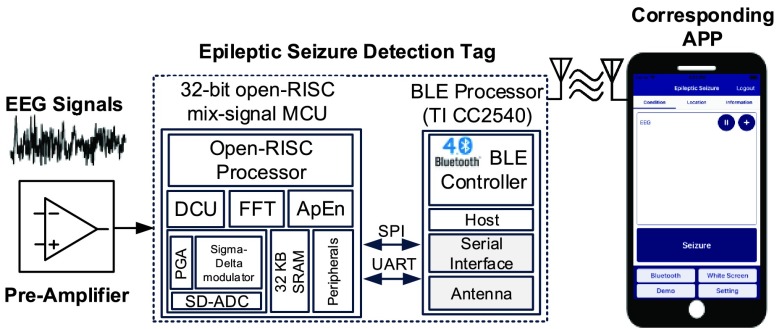
Fig. 2 shows the system architecture of the smart headband. The analog front-end circuitry with a pre-amplifier and three fabric electrodes is designed for different measurement positions. The ESDT comprises a mixed-signal MCU and a BLE chip. The mixed-signal MCU has four key elements: 1) a programmable gain amplifier (PGA), 2) a Sigma-Delta Analog to Digital converter (SD-ADC), 3) a revised OpenRISC1200 architecture processor core, and 4) hardware accelerated engines with Fast Fourier Transform (FFT) and Approximate Entropy (ApEn) [16]. The serial peripheral interface (SPI) bus will connect the mixed-signal MCU and the BLE chip. The captured EEG raw data and the epileptic seizure detection result of the mixed-signal MCU will be sent to the APP via Bluetooth. Afterward, the information of health conditions will be displayed in the APP and sent to the cloud server. This information can be accessed by patients themselves and their doctors.
FIGURE 2.
System architecture of the smart headband.
The design of the proposed system is based on normal daily living conditions. We use a compact fabric headband in order to keep the wearable device on subject’s head tightly. And all circuit components are assembled on a Flexible Print Circuit (FPC), which can be integrated into a compact fabric headband. Besides, the connection interface of electrode, pre-amplifier and epileptic seizure detection tag (ESDT) are shielded, and the circuits and mechanical designs are optimized for resisting to moving artifact and environmental coupling noise.
A. Measurement Position
EEG electrode position FP2-F8 defined by the International 10–20 System is used for wearable usage. The electrode is positioned to forehead where there is no hair interference, which can be measured without conductive adhesive. As a result, a generalized onset seizure is the target type of epileptic seizure, since this type of seizure affects the subject’s entire brain. The measurement position is shown in Fig. 3. The EEG point will be placed at the electrode position FP2. The GND point will be attached to subject’s skin. The reference point will be placed at the mastoid bone.
FIGURE 3.

Measurement position of the proposed smart headband.
B. Pre-Amplifier Circuit Design
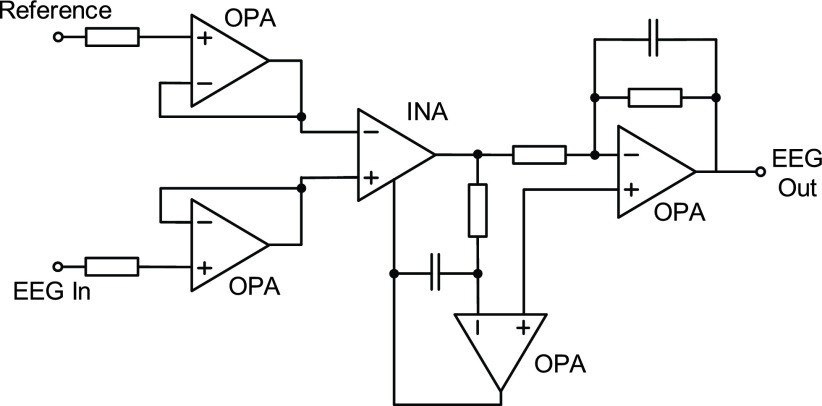
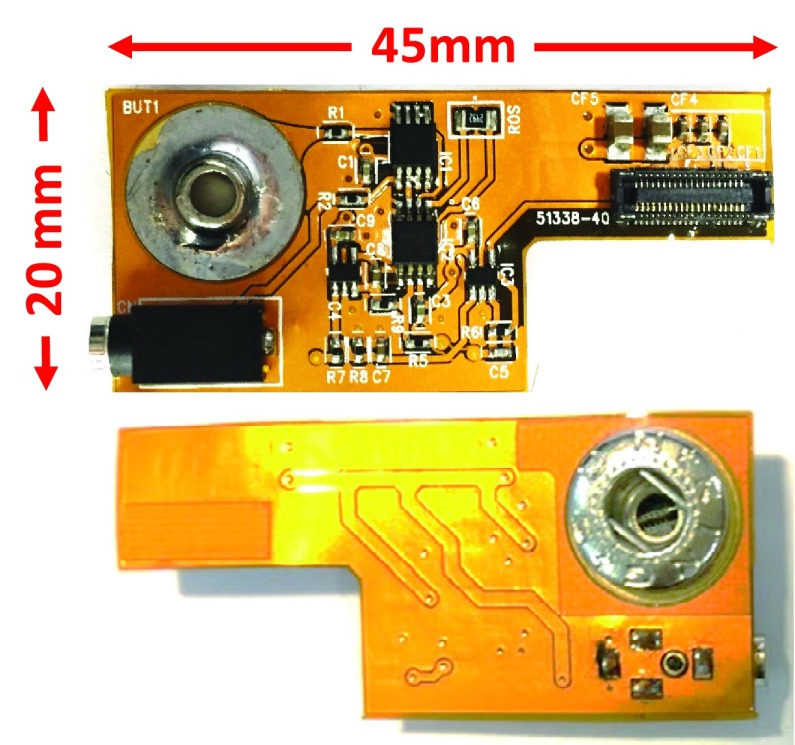
The pre-amplifier board is consisting of four parts: 1) a unit-gain buffer, 2) an instrumentation amplifier, 3) an active high pass filter, and 4) an active low pass gain filter. The circuit architecture of the pre-amplifier is shown in Fig. 4. It is necessary to use instrument amplifier to obtain the signals with better quality. In addition, a high pass filter and an active low pass gain filter are used to achieve suitable gain and bandwidth for EEG signal. Fig. 5 shows the detailed circuits of pre-amplifier board. The discrete components are combined on flexible print circuit (FPC) in order to fit the fabric headband as shown in Fig. 6. The pre-amplifier provides a gain up to 1,000 and contains a high pass filter at 0.5 Hz and a low pass filter at 1k Hz. TABLE 1 summarizes the pre-amplifier specification. After the signal is captured by analog front-end circuitry, the EEG Out signal is amplified by the programmable gain amplifier (PGA) of the mixed-signal MCU as shown in Fig. 4. The maximum gain of the PGA is 32. The specification of the PGA is shown in Fig. 9 and TABLE 2.
FIGURE 4.
Circuit architecture of pre-amplifier.
FIGURE 5.
Circuit of pre-amplifier board.
FIGURE 6.
Top side and bottom side of pre-amplifier board.
TABLE 1. Summary of Pre-Amplifier.
| Value | |
|---|---|
| Weight | 2.0 gram |
| Size (length*width*height) | 45*20*7 mm |
| Input voltage range | 0~3.3 V |
| Output voltage range | 0~3.3 V |
| Gain | 1000V/V |
| Bandwidth | 0.5–1000 Hz |
| SNDR | 60.23 dB |
| Measured Current | 0.14 mA |
FIGURE 9.
Die photo and specification of the MCU.
TABLE 2. Summary of Epileptic Seizure Detection Tag.
| Mixed-signal MCU | |
|---|---|
| Digital Part | |
| On chip processor | 32-bit OpenRISC MCU |
| Hardware accelerator | FFT / ApEn |
| Peripherals | DCU / SPI / UART |
| Analog Part | |
| SNDR | 87.03 dB |
| ADC ENOB | 10–12 bits |
| PGA Gain | 1, 2, 4, 8, 16, 32 X |
| Epileptic Seizure Detection Tag | |
| Input voltage range | 0~3.3 V |
| Output voltage range | 0~3.3 V |
| Current consupmtion | 18.09 mA |
| Size (length*width*height) | 41.6  33.6 33.6  8.3 mm 8.3 mm |
| Weight | 5.7 gram |
C. Fabric Electrode
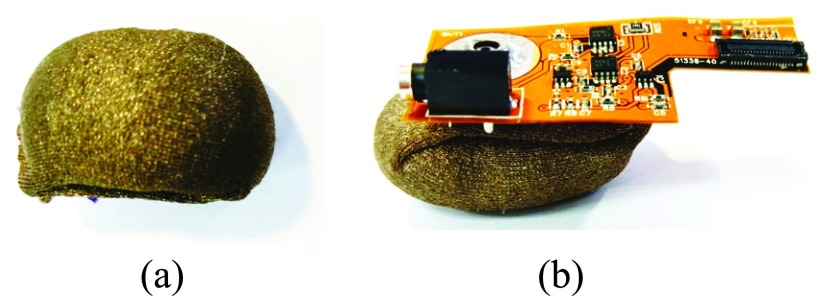
Fig. 7 (a) shows the fabric electrode. The conductive textile of the fabric electrode is made of metal strands woven and textile. With characteristic of conductivity and excellent soft performance, the conductive textile is appropriate to be used for the electrode of smart headband.
FIGURE 7.
Fabric electrode and its combination with pre-amplifier.
The metal button of the pre-amplifier shown in Fig. 6 is fitting to the metal button of fabric electrode. By combining pre-amplifier with electrode, the distance from measured position to pre-amplifier can be shorted to 7 mm. Therefore, the noise interference can be reduced. The combination of fabric electrode and pre-amplifier is shown in Fig. 7 (b). The sectional view of analog front-end circuitry is shown in Fig. 8.
FIGURE 8.
Sectional view of the analog front-end circuitry.
D. Mixed-Signal MCU on Epileptic Seizure Detection Tag
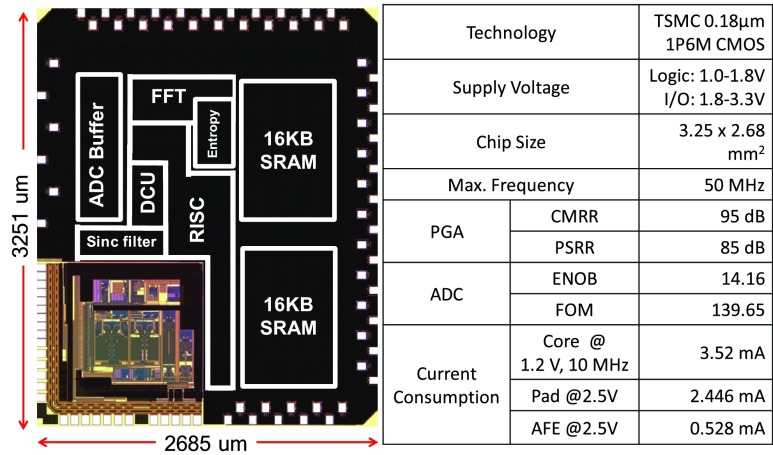
Epileptic Seizure Detection Tag (ESDT) contains a mixed-signal MCU and BLE chip. The mixed-signal MCU fabricated in TSMC 0.18  CMOS technology with ARM design kit comprises a revised 32-bit reduced instruction set computing (RISC) processor core, embedded 32KB SRAM, a multi-mode Sigma-Delta analog-to-digital converter (SD-ADC), 64-bits Fast Fourier Transform (FFT), and 64-bits Approximate Entropy (ApEn) hardware accelerated engine. Diverse peripherals include a data control unit (DCU) with direct memory access (DMA) feature, a 1K bytes buffer for the SD-ADC and SPI/UART for comprehensive application [17], [18]. The micrograph and specifications of the chip are shown in Fig. 9.
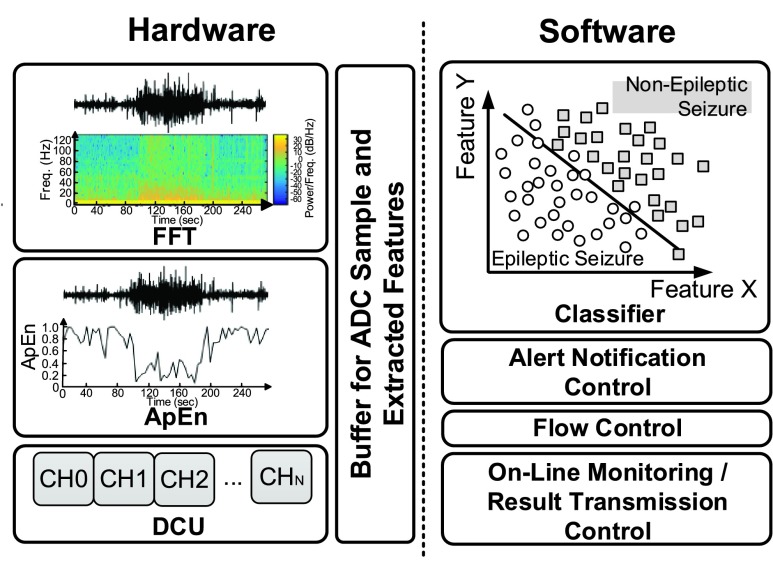
Fig. 10 shows the work-division of the mixed-signal MCU [18]. Compared to the 32-bit processor-based design [15], the processing time of entropy is reduced by 40 times. Furthermore, FFT computations can be decreased by 59.6 times. This is because of dedicated hardware accelerators. Besides, the energy-efficient implementation of the FFT core and the entropy-coding engines [18] can improve the overall processing time and the energy dissipation by 32.8 and 8.5 times. The co-operation of hardware and software achieves the best optimization of the system.
FIGURE 10.
Hardware and software division of the system.
E. BLE Module
The BLE module CC2540 [19] from Texas Instruments (TI) is chosen to work with the mixed-signal MCU. The mixed-signal MCU controls data flow and uses SPI/UART interface to communicate with the BLE transceiver. The EEG raw data and epileptic seizure detection result is transmitted through the Bluetooth module and is displayed in real time on the APP.
The mixed-signal MCU, BLE chip and on-board antenna is integrated into one small printed circuit board (PCB). The size of ESDT is only 41.6 (length) * 33.6 (width) * 8.3 (height) mm and the weight is only 5.7 g. The specification of ESDT is summarized in TABLE 2.
F. APP Design
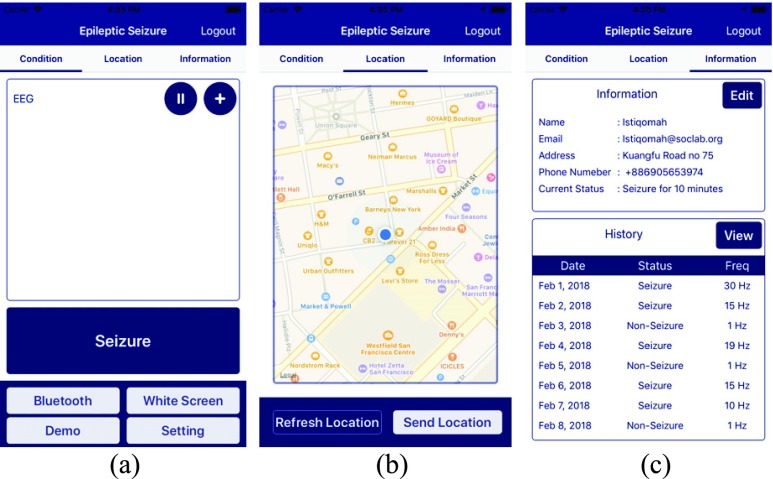
An APP is designed based on the application scenario as shown in Fig. 11. When a patient has epileptic seizure, the APP will record the patient’s location and health status. When the epileptic seizure is detected by the smart headband, the APP will send notification to patient’s family members or his or her doctors for necessary support. After logging in the APP, the user interface consists of three main pages: 1) condition page, 2) location page and 3) information page. The condition page is shown in Fig. 12 (a). It displays the status of Bluetooth connection and data representation. The data received, such as EEG signal and epileptic seizure detection result from ESDT, will be shown in a 5-minute time scale. These data will be also sent to the cloud database and saved as the history of patients’ health record. Once an epileptic seizure is detected by the ESDT, this APP will call the related people such as patients’ family and send the patients’ locations. For location page shown in Fig. 12 (b), it will detect patients’ location in real time. It can also send location message to patients’ family manually by the button of “Send Location.” On the information page shown in Fig. 12 (c), it can display patients’ history of patients’ health record and the frequency of epileptic seizure per day for one month.
FIGURE 11.
Application scenario for targeting epilepsy patients.
FIGURE 12.
Main pages of the corresponding APP.
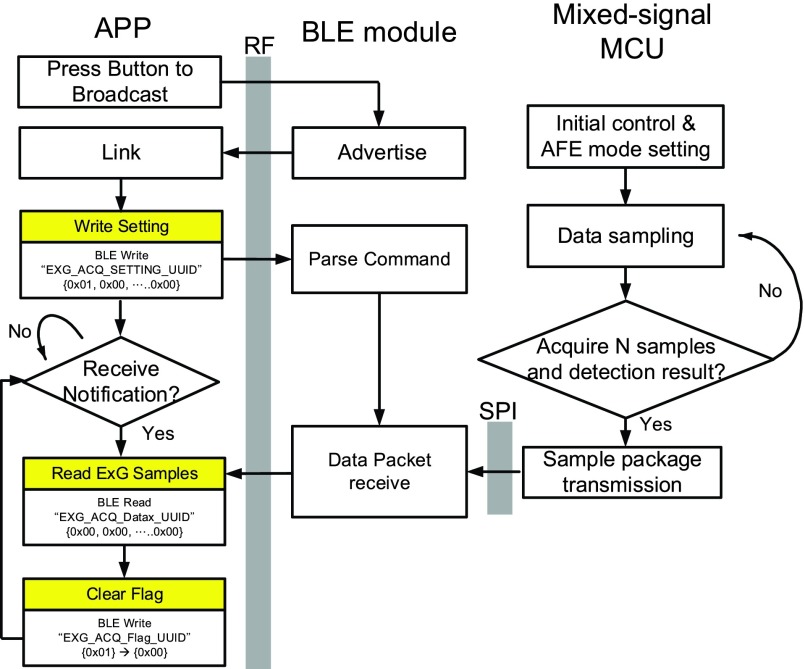
We describe in the following the control flow of Bluetooth. The flow is divided into three parts: APP, BLE module and mixed-signal MCU. At the booting time, the mixed-signal MCU will perform the initial control and analog front-end (AFE) mode setting. The BLE module will frequently send advertisement to the APP. After that, the mixed-signal MCU starts sampling raw data. When a sufficient number of samples are collected, epileptic seizure detection result can be determined, these data will be transmitted in a package format to the BLU module through SPI protocol. Afterward, the BLE module will transfer data to the APP through the on-board antenna of the ESDT. This APP can display raw data and epileptic seizure detection result in a real-time manner. The detailed control flow of Bluetooth is shown in Fig. 13.
FIGURE 13.
Control flow of BLE module, mixed-signal MCU and APP.
G. Components of Smart Headband
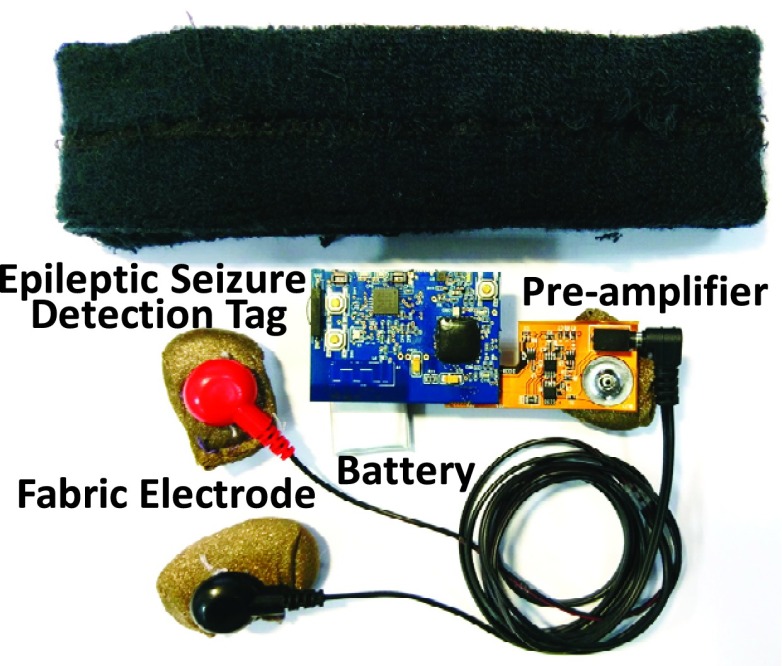
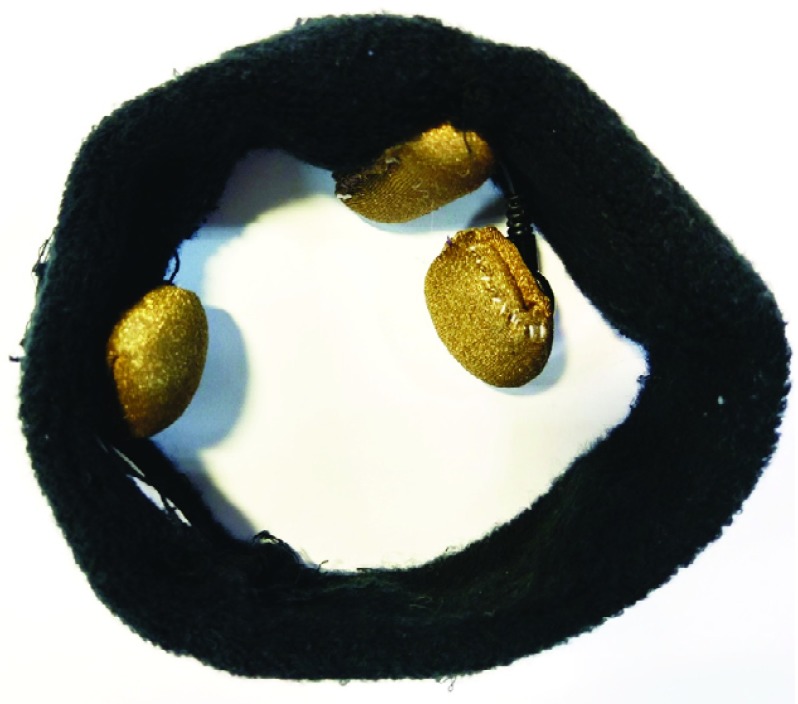
Fig. 14 shows the components of the smart headband. It is composed of five elements: 1) analog front-end circuitry with a pre-amplifier and three fabric electrodes, 2) Epileptic Seizure Detection Tag (ESDT), 3) rechargeable lithium-ion battery, 4) bio-potential measurement cable, and 5) fabric headband. With a 500 mAh battery, the system can continuously capture EEG signals, execute epileptic seizure detection algorithm, and transmit detection result up to 30 hours. The smart headband weighting only 50.3g is appropriate for wearable usage. Fig. 15 shows the final integration of above system. All of the circuit components can be integrated inside the headband.
FIGURE 14.
Components of the smart headband.
FIGURE 15.
Final integration of the smart headband.
III. Epileptic Seizure Detection Algorithm
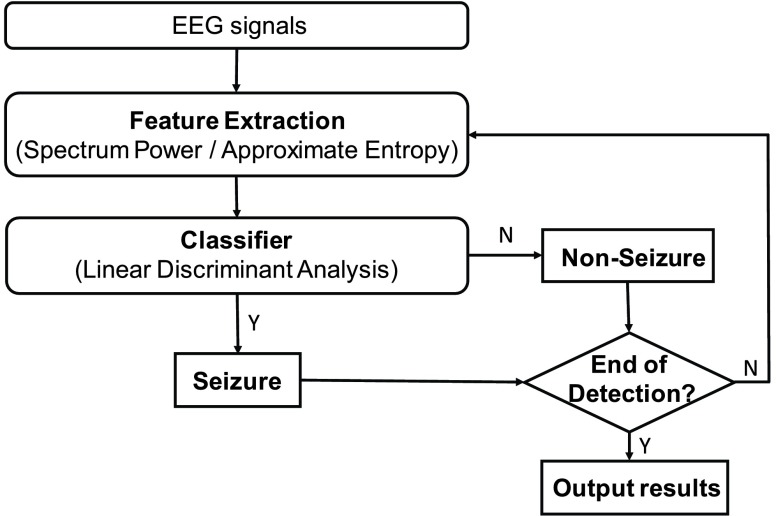
This session will describe the epileptic seizure detection algorithm [20], [21]. In our previous works [15], [18], it was demonstrated that combining the multi-band EEG power spectrum with approximate entropy (ApEn) to classify the seizure and non-seizure EEG segments can perform very well. The time-domain and frequency-domain characteristics of EEG signals were integrated as the features and the linear discriminant analysis (LDA) [21], [22], which was utilized as the seizure classifier to reduce computational cost. The flow chart of the epileptic seizure detection algorithm is shown in Fig. 16. In order to achieve accurate online seizure detection, EEG data corresponding to seizure and non-seizure were utilized for feature extraction and classifier training.
FIGURE 16.
Flow chart of proposed epileptic seizure detection algorithm.
A. Data for Analysis and Training
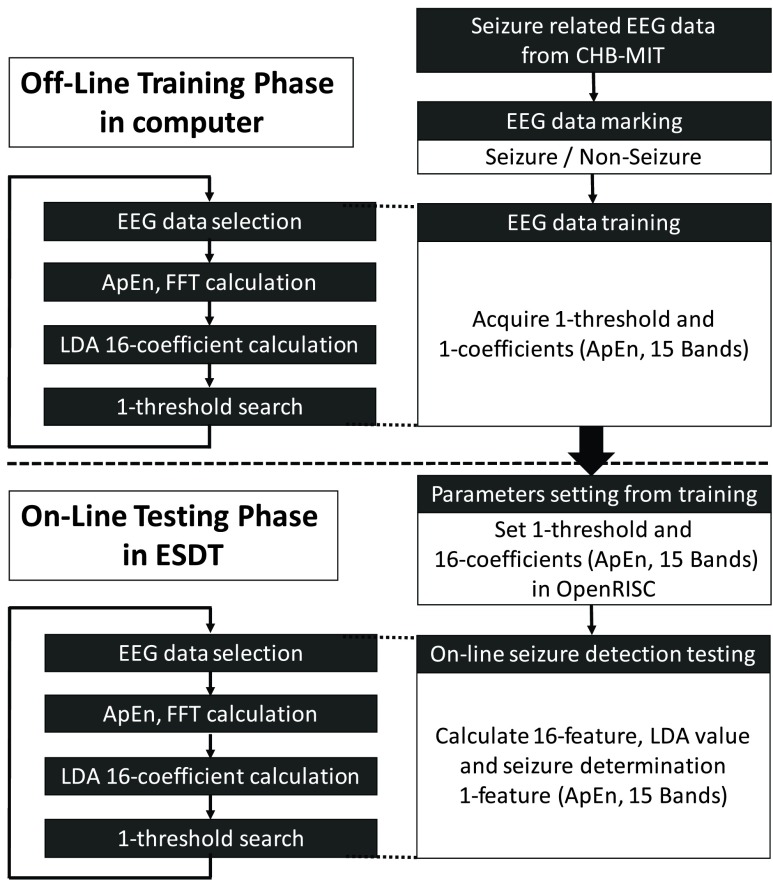
The performance of the epileptic seizure detection algorithm is validated by using Boston Children’s Hospital’s CHB-MIT scalp EEG clinical database [23]. The database is open source, and can be accessed by all researchers. It comprises more than 906 hours of surface EEG data and contains seizure patterns from 24 different epilepsy patients. The channel FP2-F8 is utilized for training, which is similar to the measurement position of smart headband. Fig. 17 shows the overall procedures in the epileptic seizure detection algorithm. Two essential stages of EEG signal processing are performed in this study. In the first stage, continuous EEG signals of each epilepsy patient are recorded for feature extraction corresponding to seizures and non-seizures. These spontaneous events are used to train the seizure classifier program offline. While the parameters of a seizure detection model are determined, the parameters are downloaded to the processor to perform the online seizure detection over the testing data.
FIGURE 17.
Detailed procedures in the epileptic seizure detection algorithm.
B. Feature Extraction
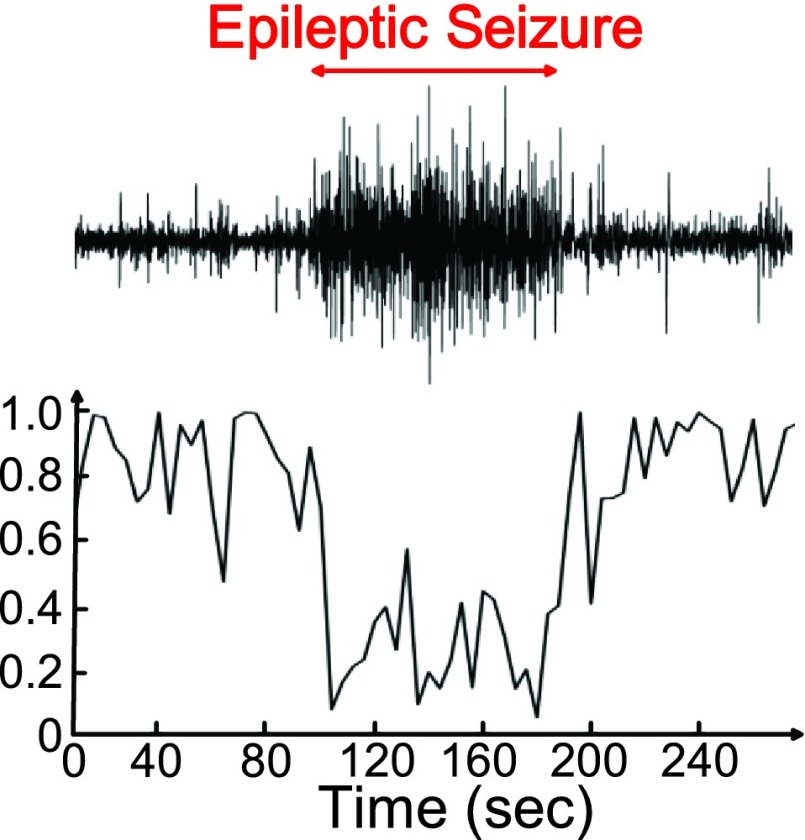
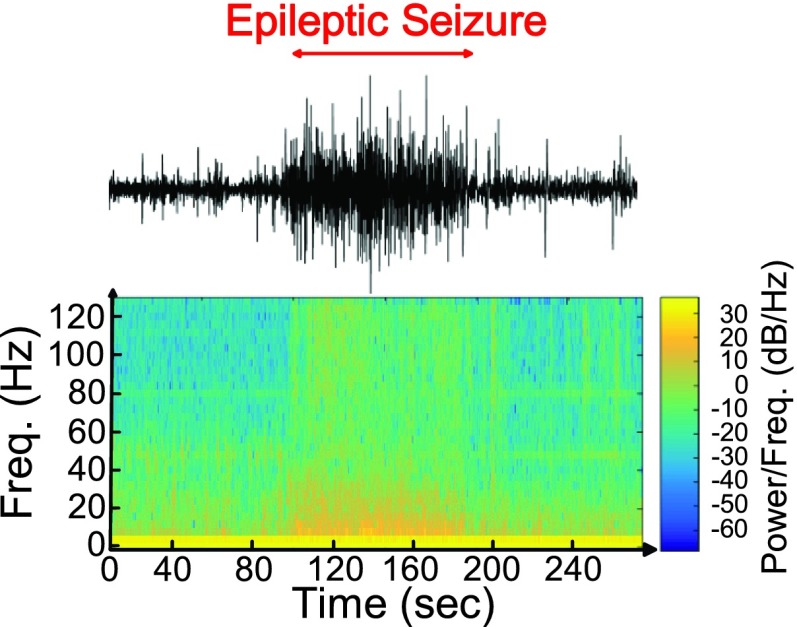
Approximate entropy (ApEn) is the measurement that quantifies the regularity of time series. It has been used for the detection of epilepsy recently [24], [25]. Our previous study [16] observed that ApEn is a good feature to discriminate between seizure and non-seizure. Fig. 18 shows the 64-point ApEn calculation results of seizure number 6 on subject 1 in CHB-MIT scalp EEG clinical database. When the subject has epileptic seizure, the value of ApEn analysis will decrease because the EEG signals of a seizure are more regular than those in normal state. The frequency bands whose power changes are highly correlated with seizure can perform as the complementary features of entropy to reduce false detections during movements. Fig. 19 shows the 64-point FFT calculation result of seizure number 6 on subject 1 in the CHB-MIT scalp EEG clinical database.
FIGURE 18.
Approximate entropy analysis result of epileptic seizure.
FIGURE 19.
Spectral analysis based on short-time Fourier transform.
C. Classifier
Sixteen feature indexes (ApEn and 15 frequency bands from 0Hz to 128Hz) are fed into a classifier to verify seizure occurrences. A linear classifier, linear discriminant analysis (LDA) [21], is implemented in this work. The LDA is often used to reduce the dimensions of classification problems by separating the data into different classes and minimizing the data distribution of the same class in the feature space.
D. EEG Data for Training and Testing
The overall procedures of the epileptic seizure detection algorithm are shown in Fig. 17. Two essential stages including offline training phase and online testing phase of EEG signal processing are performed in EEG data of the CHB-MIT scalp EEG clinical database. FP2-F8 Channel of the EEG database is used for the measurement position of smart headband.
In the training phase, continuous EEG signals of each subject are recorded for marking and training. EEG signals which correspond to seizures and non-seizures are marked by a specialist. The marked events are used to extract ApEn and FFT values, train LDA classifier, and search the best thresholds.
In the testing phase, the parameters of a seizure detection model, including 1-coefficient of LDA classifier and 1-threshold of seizure determination, are determined, and then downloaded to the mixed-signal MCU. Afterward, online seizure detection testing is performed in the mixed-signal MCU.
E. Threshold Determination Method
The distribution of seizures’ and non-seizures’ values of LDA is used for threshold determination method in this work [26]. We use the mean and the multiples of standard deviation to determine the best threshold for epileptic seizure determination. The threshold determination method is shown in Fig. 20.
FIGURE 20.
Threshold determination method.
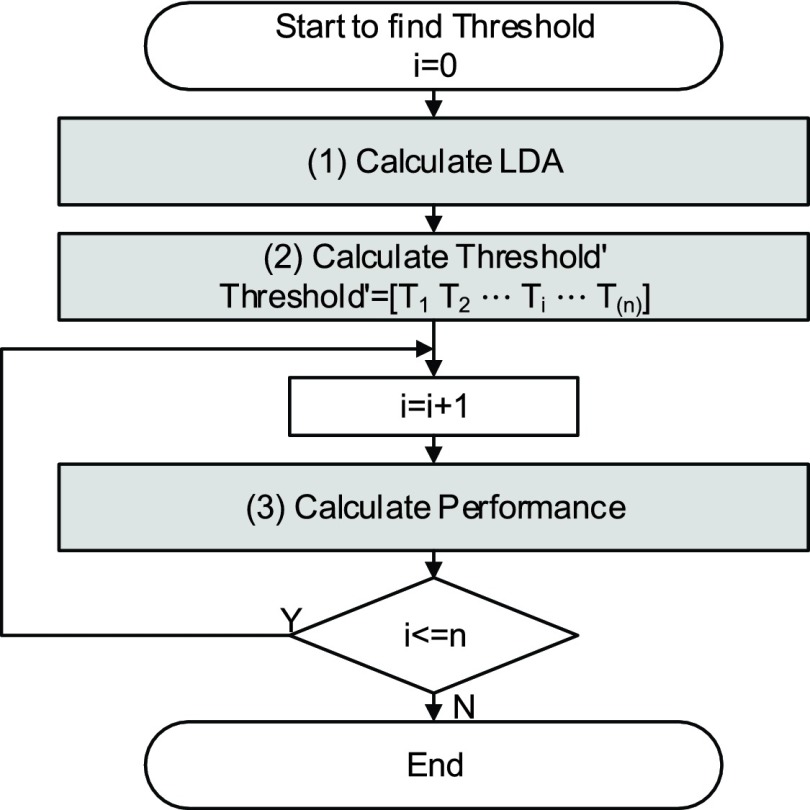
The following is the steps of the threshold determination method, and the flowchart of fast parameter determination method is depicted in Fig. 21.
-
(1)
We calculate the LDA value with 1-coefficient of LDA classifier.
-
(2)We compute the mean and the standard deviation of actual non-Seizure’s LDA value, so Threshold can be written as

-
(3)
We test the detection rate and the false detection rate for Threshold which is determined by step (2).
-
(4)
Finally, we can select the best threshold from the test in Step (3).
FIGURE 21.
Flow chart of the threshold determination method.
Compared with testing every set of threshold, this method is 4320 times faster in this work, and it can attain the same performance.
IV. Experimental Results
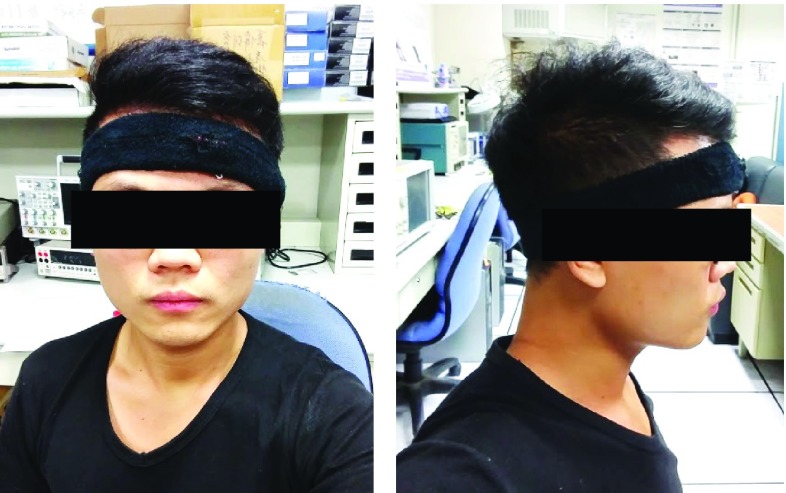
The measurement setup of the whole system is shown in Fig. 22. A subject wears the smart headband. In Fig. 23, the system captures EEG signals, transmits the signal to APP via Bluetooth protocol, and displays raw data on the APP in real time. The EEG signals in the Fig. 23 are from the CHB-MIT database.
FIGURE 22.
Example of patient with Smart headband.
FIGURE 23.
(a) EEG waveform of non-seizure from database (b) EEG waveform of seizure from database.
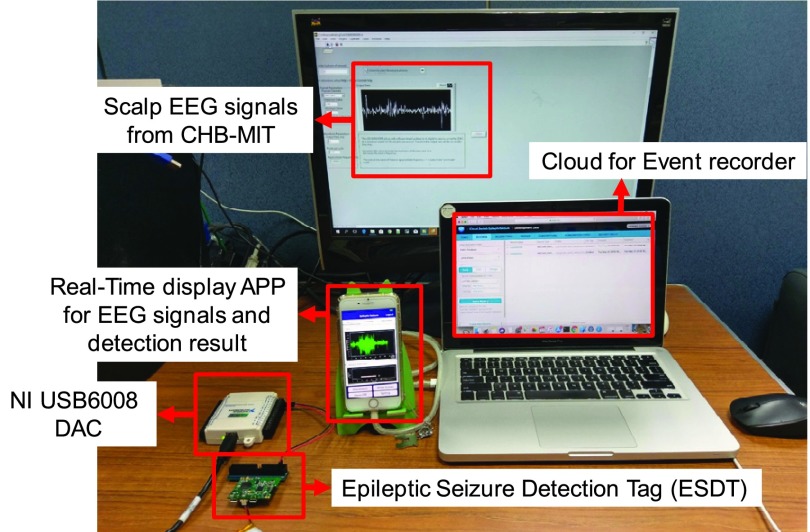
The functionality of ESDT is verified by EEG signals from the CHB-MIT scalp EEG clinical database. The overall procedures have been shown in Fig. 17. After 1-coefficient of LDA classifier and 1-threshold of seizure determination are selected from the training phase, the mixed-signal MCU enters the testing phase based on these selected parameters.
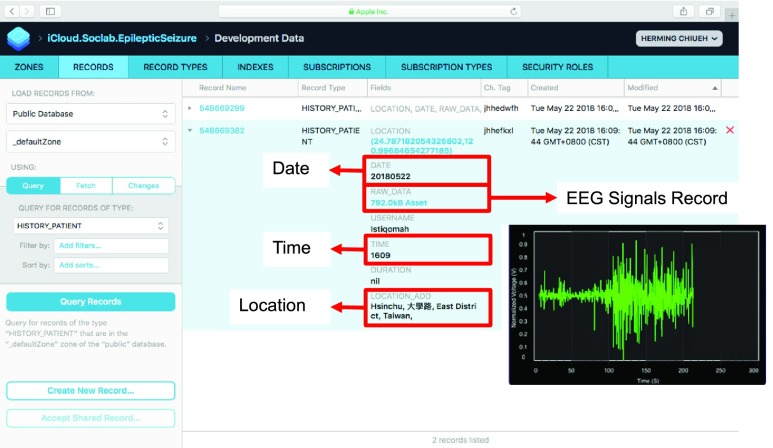
Fig. 24 shows the environment setup of system verification. The digital EEG signals from the CHB-MIT scalp EEG clinical database are converted into analog signals by a Digital-to-Analog convertor. Then the analog signals are sampled by a SD-ADC of the mixed-signal MCU. After raw data are captured and detection result is determined, the mixed-signal MCU will transmit raw data and detection result to the APP via Bluetooth. When seizure is detected, the APP will give notification to patient’s family and also upload seizure event, such as time, location and 30–60 seconds EEG signals before seizure to cloud for doctors to diagnosis the patient. Fig. 25 shows some examples of seizure event record on the cloud.
FIGURE 24.
Environment setup of system verification.
FIGURE 25.
Example of seizure event record on cloud server.
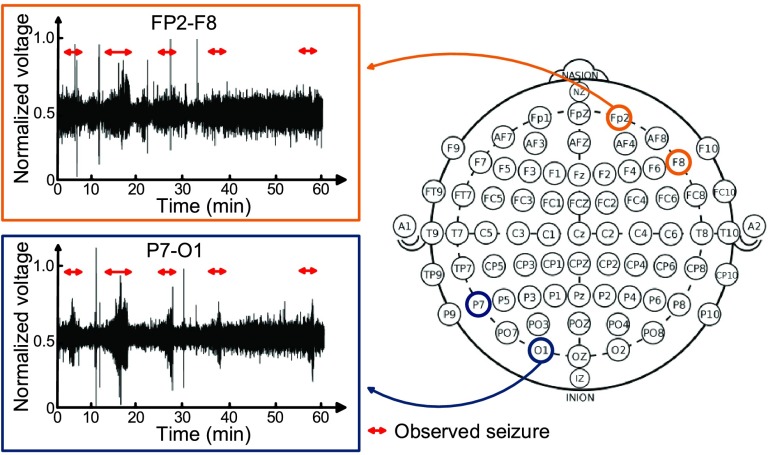
Although there are 24 subjects in the CHB-MIT scalp EEG clinical database, some of them do not have generalized onset seizure. It is implied that the seizure doesn’t affect the entire brain. Take one of them for example. Fig. 26 shows the EEG signal behaviors of subject 15 in electrode position FP2-F8 and P8-O1. This subject is male and 16 years old. In the record time from 23:39:54 to 24:39:54, 5 seizures are observed within one hour. The red arrow indicates the observed seizure by a specialist. It is apparent that seizures are unclear in FP2-F8 electrode position, while they are clear in P7-O1 electrode position. As a result, the experimental result will apply 7 subjects who have seizures affecting their entire brains. In other words, the 7 subjects would benefit from this system.
FIGURE 26.
EEG signal comparison of subject 15 in electrode position FP2-F8 and P8-O1.
Performance of the epileptic seizure detection algorithm is evaluated based on 7 subjects from the CHB-MIT scalp EEG clinical database. All the 7 subjects have intractable seizures affecting their entire brain. After the training phase is executed in each subject, the parameters of 1-coefficient and 1-threshold are used for the on-line seizure detection. TABLE 3 shows the observed seizure duration for each subject.
TABLE 3. Observed Seizure Duration.
| Subject | Total Duration (hours) | Number of Seizure | Seizure Duration (seconds) | Seizure Mean (seconds) |
|---|---|---|---|---|
| #1 | 42 | 7 | 442 | 63 |
| #3 | 38 | 7 | 402 | 57 |
| #5 | 39 | 5 | 558 | 112 |
| #8 | 20 | 5 | 919 | 184 |
| #19 | 30 | 3 | 237 | 79 |
| #20 | 29 | 8 | 294 | 37 |
| #24 | 12 | 16 | 511 | 32 |
The subjects’ information and epileptic seizure detection result with the method above is shown in TABLE 4. EEG data recorded around 220 hours in FP2-F8 channel of 7 subjects are used for training and testing. The detection accuracy and false alarm (false positive) is defined by the following equations:
 |
TABLE 5. Comparison Table.
| [9] | [10] | [11] | [12] | |
|---|---|---|---|---|
| Functionality | Detection / Alarming | Detection / Alarming / Diagnosis | Detection / Alarming | Detection / Alarming |
| Signal Type | EEG | Body motion | ECG / Body motion | EMG / Body motion |
| Signal Capture Device | Headset | Bracelet | Jacket | Armband |
| Detection Device | APP | Cloud | Cloud | APP |
| Algorithm | SVM / ANN / KNN | SDA | Moving average | Visual Analysis |
| Accuracy | 97 % | X | X | 100% |
| False Alarm | X | X | X | 5% |
| Battery Lifetime | X | X | X | X |
TABLE 4. Performance of Proposed System.
| Subject | Detection Rate (%) | False Alarm (num/hour) | Event Record (seconds) |
|---|---|---|---|
| #1 | 100 | 0.74 | 1582 |
| #3 | 85.71 | 0.55 | 1148 |
| #5 | 100 | 0.64 | 1458 |
| #8 | 100 | 0.05 | 1099 |
| #19 | 100 | 0.30 | 597 |
| #20 | 100 | 0.76 | 714 |
| #24 | 87.5 | 0.32 | 987 |
The average detection rate is 92.68% and average false alarm is 0.527/hour. Furthermore, by event record, doctor only needs to review 7,585 seconds (1 % EEG recordings) for precise diagnosis.
Compared to other related work, this work uses EEG signals to detect seizure in order to record seizure event for precise diagnosis. Furthermore, seizure detection algorithm is executed in hardware in this work to reduce noise interference from wireless transmission. And with a 500 mAh battery, the device can service up to 30 hours.
V. Conclusion
In this work, a smart headband combined with a corresponding APP for epileptic seizure detection is presented. To obtain better quality of EEG signals from a subject ’s skin, we combined the fabric electrode with a pre-amplifier in the analog front-end circuitry. The analog front-end circuitry was assembled on FPC in order to fit the fabric headband. In addition, an epileptic seizure detection tag including a mixed-signal MCU and BLE chip for epileptic seizure detection is designed. Besides, corresponding APPs for epilepsy patients and medical doctors was also developed to record seizure events and location for patients.
The overall system is fully integrated into a fabric headband weighting only 50.3 g and can service up to 30 hours by using a 500 mAh battery. This compact smart headband with a corresponding APP for epileptic seizure detection can improve the patients’ quality of life by monitoring their health conditions at anytime and anywhere.
This work has been verified by a clinical database. These continuous EEG signals were recorded in normal daily living conditions. And ApEn and FFT are combined as the features in our algorithm to reduce false detections during movements [15]. Now, we are working with medical doctors together to file an IRB (Institutional Review Board) application. Once the IRB application is approved, the real subject verification will be conducted.
This work only uses one channel (FP2-F8) for seizure detection to avoid using conductive adhesive. Therefore, only generalized onset seizure can be detected. In order to extend the scope to detect focal onset seizure, a multi-channel system is necessary. Designing a headband with multi-channel detection capability is one of our future research directions.
Acknowledgment
Note: The subject in figures approves the usage of his image.
Funding Statement
This work was supported in part by Microsoft Research Asia and the Ministry of Science and Technology, Taiwan, under Contract MOST 106-2314-B-002-184, MOST 106-2221-E-009-191, MOST 107-2314-B002-003, and MOST 107-2221-E-009-134.
References
- [1].Patricia M. and Shafer O., (2014). About Epilepsy: The Basics—Epilepsy Foundation. [Online]. Available: https://www.epilepsy.com/learn/about-epilepsy-basics [Google Scholar]
- [2].Eadie M. J., “Shortcomings in the current treatment of epilepsy,” Expert Rev. Neurotherapeutics, vol. 12, no. 12, pp. 1419–1427, 2012. [DOI] [PubMed] [Google Scholar]
- [3].Schmidt D., “Drug treatment of epilepsy: Options and limitations,” Epilepsy Behav., vol. 15, no. 1, pp. 56–65, 2009. [DOI] [PubMed] [Google Scholar]
- [4].Theodore W. H. and Fisher R. S., “Brain stimulation for epilepsy,” Neurology, vol. 3, no. 2, pp. 111–118, 2004. [DOI] [PubMed] [Google Scholar]
- [5].Stacey W. C. and Litt B., “Technology insight: Neuroengineering and epilepsy–designing devices for seizure control,” Nature Clin. Pract. Neurol., vol. 4, pp. 190–201, Feb. 2008. [DOI] [PMC free article] [PubMed] [Google Scholar]
- [6].Nicolelis M. A. L., “Actions from thoughts,” Nature, vol. 409, pp. 403–407, Jan. 2001. [DOI] [PubMed] [Google Scholar]
- [7].Feddersen B., Vercueil L., Noachtar S., David O., Depaulis A., and Deransart C., “Controlling seizures is not controlling epilepsy: A parametric study of deep brain stimulation for epilepsy,” Neurobiol. Disease, vol. 27, no. 3, pp. 292–300, 2007. [DOI] [PubMed] [Google Scholar]
- [8].NUROPACE. Accessed: Feb. 15, 2018. [Online]. Available: http://www.neuropace.com/
- [9].Lasefr Z., Reddy R. R., and Elleithy K., “Smart phone application development for monitoring epilepsy seizure detection based on EEG signal classification,” in Proc. IEEE 8th Annu. Ubiquitous Comput., Electron. Mobile Commun. Conf. (UEMCON), Oct. 2017, pp. 83–87. [Google Scholar]
- [10].Marquez A., Dunn M., Ciriaco J., and Farahmand F., “iSeiz: A low-cost real-time seizure detection system utilizing cloud computing,” in Proc. IEEE Global Humanitarian Technol. Conf. (GHTC), Oct. 2017, pp. 1–7. [Google Scholar]
- [11].Chen H.et al. , “A wearable sensor system for neonatal seizure monitoring,” in Proc. IEEE 14th Int. Conf. Wearable Implantable Body Sensor Netw. (BSN), May 2017, pp. 27–30. [Google Scholar]
- [12].Gheryani M., Salem O., and Mehaoua A., “An effective approach for epileptic seizures detection from multi-sensors integrated in an Armband,” in Proc. IEEE 19th Int. Conf. e-Health Netw., Appl. Services (Healthcom), Oct. 2017, pp. 1–6. [Google Scholar]
- [13].Ramirez-Alaminos J., Sendra S., Lloret J., and Navarro-Ortiz J., “Low-cost wearable bluetooth sensor for epileptic episodes detection,” in Proc. IEEE Int. Conf. Commun. (ICC), May 2017, pp. 1–6. [Google Scholar]
- [14].Regalia G., Caborni C., Migliorini M., Onorati F., and Picard R., “Real-time seizure detection performance with Embrace alert system: One year real-life setting case study,” in Proc. Int. Congr. Mobile Health Devices Seizure Detection, 2017, doi: 10.13140/RG.2.2.28448.48648. [DOI] [Google Scholar]
- [15].Chen T.-J.et al. , “The implementation of a low-power biomedical signal processor for real-time epileptic seizure detection on absence animal models,” IEEE J. Emerg. Sel. Topics Circuits Syst., vol. 1, no. 4, pp. 613–621, Dec. 2011. [Google Scholar]
- [16].Liang S.-F., Chang W.-L., and Chiueh H., “EEG-based absence seizure detection methods,” in Proc. Int. Joint Conf. Neural Netw. (IJCNN), Jul. 2010, pp. 1–4. [Google Scholar]
- [17].Lee S.-C., Chen T.-J., and Chiueh H., “A multi-channel multi-mode physiological signals acquisition and analysis platform,” in Proc. 2013 IEEE Int. Symp. Circuits Syst., Beijing, China, May 2013, pp. 397–400. [Google Scholar]
-
[18].Chen T.-J., Lee S.-C., Yang C.-H., Chiu C.-F., and Chiueh H., “A
 mixed-signal processor for epileptic seizure detection,” in Proc. 2013 Symp. VLSI Circuits, Kyoto, Japan, Jun. 2013, pp. C52–C53. [Google Scholar]
 - [19].Texas Instruments. CC2540, Bluetooth Low Energy Wireless MCU With USB. Accessed: Oct. 13, 2017. [Online]. Available: http://www.ti.com/product/CC2540
- [20].Liang S.-F., Wang H.-C., and Chang W.-L., “Combination of EEG complexity and spectral analysis for epilepsy diagnosis and seizure detection,” EURASIP J. Adv. Signal Process., vol. 2010, p. 853434, Dec. 2010. [Online]. Available: https://asp-eurasipjournals.springeropen.com/articles/10.1155/2010/853434 [Google Scholar]
- [21].Tharwat A., Gaber T., Ibrahim A., and Hassanien A. E., “Linear discriminant analysis: A detailed tutorial,” AI Commun., vol. 30, no. 2, pp. 169–190, 2017. [Google Scholar]
- [22].Liang S.-F., Chen Y.-C., Wang Y.-L., Chen P.-T., Yang C.-H., and Chiueh H., “A hierarchical approach for online temporal lobe seizure detection in long-term intracranial EEG recordings,” J. Neural Eng., vol. 10, no. 4, p. 045004, 2013. [DOI] [PubMed] [Google Scholar]
- [23].Goldberger A. L.et al. , “PhysioBank, PhysioToolkit, and PhysioNet: Components of a new research resource for complex physiologic signals,” Circulation, vol. 101, no. 23, pp. 215–220, 2000. [DOI] [PubMed] [Google Scholar]
- [24].Kannathal N., Choo M. L., Acharya R. U., and Sadasivan P. K., “Entropies for detection of epilepsy in EEG,” Comput. Methods Programs Biomed., vol. 80, no. 3, pp. 187–194, 2005. [DOI] [PubMed] [Google Scholar]
- [25].Pincus S. M., “Approximate entropy as a measure of system complexity,” Proc. Nat. Acad. Sci. USA, vol. 88, pp. 2297–2301, Mar. 1991. [DOI] [PMC free article] [PubMed] [Google Scholar]
- [26].Chang S.-T., Chen T.-J., Jeng C., Liang S.-F., and Chiueh H., “Fast training for epileptic seizure detector,” in Proc. 3rd Int. Conf. Neuroprosthetic Devices (ICNPD’11), Sydney, NSW, Australia, Nov. 2011, pp. 26–28. [Google Scholar]
- [27].Lin S.-K., Lin Y.-S., Lin C.-Y., and Chiueh H., “A smart headband for epileptic seizure detection,” in Proc. IEEE HI-POCT, Bethesda, MD, USA, Nov. 2017, pp. 221–224. [Google Scholar]


