Abstract
Study Design
Cross-sectional observational study.
Purpose
To compare measurements of appendicular skeletal muscle mass (ASMM) and whole fat mass (WFM) obtained using dualenergy X-ray absorptiometry (DXA) and bioelectrical impedance analysis (BIA) among patients with low back pain (LBP). Moreover, the study investigated the correlation between BIA-based ASMM and DXA-based bone mineral density (BMD).
Overview of the Literature
If reliable, BIA may be a useful alternative to DXA as a screening tool for sarcopenia and osteoporosis among patients with LBP.
Methods
Measurements were performed in 130 patients, including BMD of the lumbar spine and femoral neck. The correlation between DXA and BIA as well as between BIA-ASMM and BMD were evaluated.
Results
BIA and DXA were highly correlated in both male and female patients (r =0.73–0.90, p <0.0001). However, BIA consistently overestimated ASMM by 1.5–2.5 kg on an average (p <0.0001) and underestimated WFM (−4.0 to −2.7 kg) on an average (p <0.0001). BIA-based ASMM correlated with BMD of the lumbar spine in both male and female patients (r =0.28–0.37, p ≤0.02) and that of the femoral neck (r =0.34–0.51, p ≤0.005). Regarding the calculated skeletal muscle index (SMI: ASMM/height [m2]) used as a criterion for sarcopenia, BIA-based SMI correlated with BMD of the lumbar spine in male patients (r =0.44, p =0.0004) and that of the femoral neck in female patients (r =0.33, p =0.009).
Conclusions
BIA may be a favorable alternative to DXA as a screening tool for sarcopenia and osteoporosis among patients with LBP. Considering the overestimation of BIA-based ASMM and SMI, we recommend using the cutoff values for sarcopenia of 7.9 kg/m2 for males and 6.1 kg/m2 for females.
Keywords: Lumbar vertebrae, Low back pain, Skeletal muscle, Sarcopenia, Osteoporosis
Introduction
Sarcopenia is a major cause of declining physical function and increased risk of falling among elderly individuals [1]. As clear diagnostic methods and criteria for sarcopenia are in the process of being defined, the aspects of its epidemiology remain unclear. Measurement of appendicular skeletal muscle mass (ASMM) using dualenergy X-ray absorptiometry (DXA) is considered to be the gold standard for the diagnosis of sarcopenia [2]. The skeletal muscle index (SMI: ASMM/height [m2]) is used as the diagnostic criterion for sarcopenia. However, due to its cost and need for specialization, DXA assessments are performed only in a limited number of medical facilities, which is not feasible for large-scale screening of sarcopenia in the general population. Consequently, this limits the current understanding of the epidemiology of sarcopenia.
Bioelectrical impedance analysis (BIA) is emerging as a popular alternative to DXA due to its easy installation and superior cost-effectiveness. BIA measures tissue impedance by circulating a weak alternating current through the body. Physiological tissues, such as fat, muscle, and bone, exhibit different impedance. Thus, BIA provides a measure of whole body fat. Studies have demonstrated a correlation between BIA- and DXA-based measurements in healthy adults and athletes, with BIA having been proposed as a feasible alternative to DXA in healthy populations [3-7]. However, the correlation between BIA- and DXA-based measurements in clinical populations has not been comprehensively evaluated. The aim of the present study was to compare BIA- and DXA-based measurements among patients with low back pain (LBP), a common disorder among Japanese adults.
Materials and Methods
Our observational/cross-sectional study was approved by the Ethical Review Board of Chiba University Hospital (IRB approval no., 2225), and all patients provided written informed consent, as per the requirements of the Declaration of Helsinki. Patients who were assessed for LBP in the clinic between April 1, 2015, and December 31, 2016 were enrolled in the study. Exclusion criteria were difficulty in maintaining an upright position owing to scoliokyphosis, presence of pacemakers, extreme obesity defined as a body mass index (BMI) >30 kg/m2, and presence of artificial joint/spinal implants. All patients underwent both BIA (MC-780A; TANITA, Tokyo, Japan) and DXA (Discovery; Hologic, Waltham, MA, USA) measurements at our medical facility. The following measurements were performed: ASMM and whole fat mass (WFM) using BIA and DXA and bone mineral density (BMD) for the lumbar spine and femoral neck using DXA. The SMI was calculated from the BIA- and DXA-based measurements of ASMM. The maximum delay between the DXA- and BIA-based measurements was 1 month.
1. Measured patient variables
The following patient-specific variables were measured/calculated for analysis: ASMM, WFM, SMI, age, BMI, and BMD of the lumbar spine and femoral neck. Patients were also classified according to the clinical diagnosis of LBP. The diagnosis of primary osteoporosis was established based on the criteria defined by the Japan Osteoporosis Society guidelines, namely a T-score of the DXA-based BMD of the lumbar spine or femoral neck ≤−2 standard deviation (SD).
2. Patient characteristics
This study included 130 patients (66 males and 64 females) with a mean±SD age of 65.1±13.6 years. Patient characteristics are summarized in Table 1. The proportion of patients with osteoporosis was 13.6% (9/66 patients) among males and 42.2% (27/64 patients) among females. The SMI was lower in individuals with osteoporosis than in those without osteoporosis; however, this between-group difference was not statistically significant. Lumbar spinal stenosis and lumbar disc herniation were the most common causes of LBP.
Table 1.
Patients’ characteristics
| Characteristic | Men (n=66) | Women (n=64) |
|---|---|---|
| Age (yr) | 66.1±12.8 | 64.0±14.5 |
| Body mass index (kg/m2) | 23.0±2.7 | 22.1±3.3 |
| Measured value of dual-energy X-ray absorptiometry | ||
| BMD, lumbar spine (g/cm2) | 1.11±0.24 | 0.91±0.21 |
| BMD, femoral neck (g/cm2) | 0.75±0.12 | 0.61±0.13 |
| Appendicular skeletal muscle mass (kg) | 20.0±3.4 | 13.7±2.4 |
| Whole fat mass (kg) | 16.4±5.3 | 17.6±5.4 |
| Skeletal muscle mass index (kg/m2) | 7.1±0.9 | 5.8±0.8 |
| Measured value of bioelectrical impedance analysis | ||
| Appendicular skeletal muscle mass (kg) | 22.5±3.9 | 15.2±2.3 |
| Whole fat mass (kg) | 12.4±5.4 | 14.9±6.1 |
| Skeletal muscle mass index (kg/m2) | 8.0±1.0 | 6.5±0.8 |
| Patient background | ||
| Osteoporosis | ||
| + | 9 | 27 |
| - | 57 | 37 |
| Skeletal muscle mass index (kg/m2) | ||
| + | 7.4±0.6 | 6.2±0.7 |
| - | 8.1±1.1 | 6.6±1.9 |
| p-value | 0.05 | 0.07 |
| Lumbar spinal stenosis/lumbar disc herniation | 59 | 44 |
| Spinal deformity | ||
| Scoliosis & kyphosis | 3 | 3 |
| Compression fracture | 2 | 11 |
| Lumbar disc disease | 2 | 6 |
Values are presented as mean±standard deviation or number.
BMD, bone mineral density.
3. Statistical analysis
The primary outcome of this study was the correlation between BIA- and DXA-based measurements of ASMM and WFM and the resultant difference in the calculated SMI. The secondary outcome was the correlation between BIA-based measurements of ASMM/calculated SMI and DXA-based measurements of BMD of the lumbar spine and femoral neck. All measurements were separately evaluated for males and females. Spearman’s correlation analysis was used, with p<0.05 denoting statistical significance. Between-group differences in measured values were also compared using a paired t-test analysis, with p<0.05 denoting statistical significance. All analyses were performed using the JMP Pro ver. 12.0 software (SAS Institute Inc., Cary, NC, USA).
Results
1. Primary outcome: agreement between BIA- and DXA-based measurements of ASMM and WFM
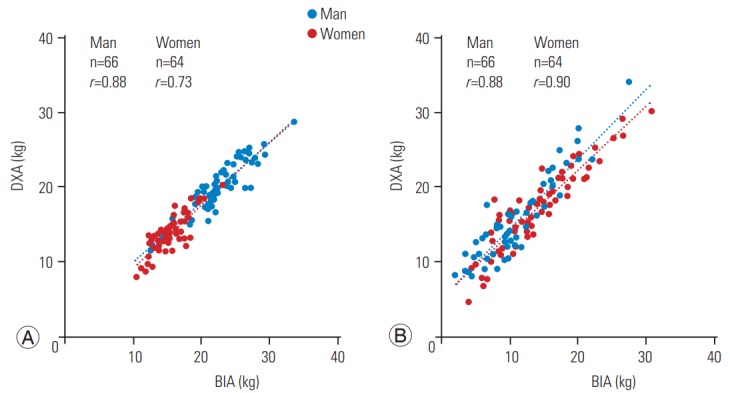
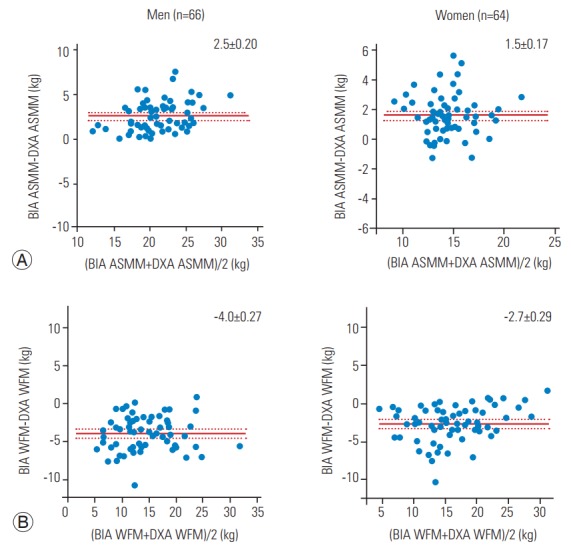
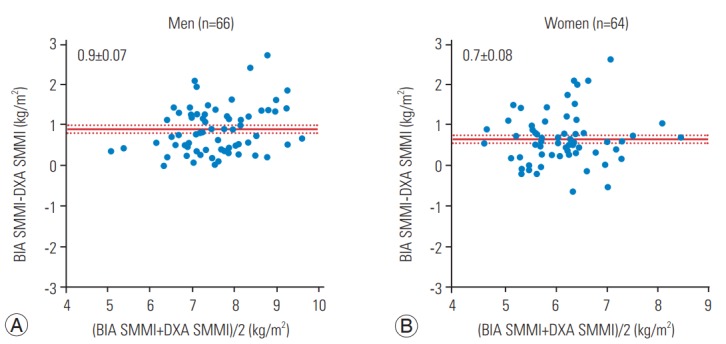
The correlation between BIA- and DXA-based measurements of ASMM and WFM is shown in Fig. 1. Both BIA and DXA measurements were highly correlated: ASMM, r=0.88 in males and r=0.73 in females, p<0.0001; and WFM, r=0.88 in males and r=0.90 in females, p<0.0001. The absolute difference between measurements is shown in Figs. 2 and 3. The BIA-to-DXA difference was as follows: ASMM, 2.5±0.20 kg in males and 1.5±0.17 kg in females (p<0.0001 for both); WFM, −4.0±0.27 kg in males and −2.7±0.29 kg in females (p<0.0001 for both); and SMI 0.9±0.07 kg/m2 in males and 0.7±0.08 kg/m2 in females (p<0.0001 for both). Therefore, in both males and females, BIA consistently overestimated ASMM and consequently the SMI. In contrast, it underestimated WFM.
Fig. 1.

Correlation between BIA- and DXA-based measurements of appendicular skeletal muscle mass (A) and whole fat mass (B) in males and females. BIA, bioelectrical impedance analysis; DXA, dual-energy X-ray absorptiometry.
Fig. 2.

Difference in ASMM (A) and WFM (B) in males and females. BIA, bioelectrical impedance analysis; DXA, dual-energy X-ray absorptiometry; WFM, whole fat mass; ASMM, appendicular skeletal muscle mass.
Fig. 3.

Difference in SMMI (A) and females (B). BIA, bioelectrical impedance analysis; DXA, dual-energy X-ray absorptiometry; SMMI, skeletal muscle mass index.
2. Secondary outcome: correlation between BIA-based ASMM/SMI measurements and DXA-based BMD
The correlation between BIA-based ASMM/SMI and DXA-based BMD measurements is shown in Table 2. Correlation coefficients between ASMM and SMI as well as BMD were as follows: ASMM versus lumbar spine, r=0.37 in males (p=0.002) and r=0.28 in females (p=0.02); ASMM versus femoral neck, r=0.34 in males (p=0.005) and r=0.51 in females (p<0.0001); SMI versus lumbar spine, r=0.44 in males (p=0.0004) and r=0.19 in females (p=0.13); and SMI versus femoral neck, r=0.24 in males (p=0.06) and r=0.33 in females (p=0.009). Therefore, moderate positive correlations were identified between BIA-based measurements of ASMM and DXA-based measurements of BMD of the lumbar spine and the femoral neck. However, BIA-based SMI was positively correlated with BMD of the lumbar spine in males (p=0.0004) and that of the femoral neck in females (p=0.009).
Table 2.
Correlation between BIA measurement of appendicular skeletal muscle mass and skeletal muscle mass index and dual-energy X-ray absorptiometry measurement of BMD
| Variable | BIA appendicular skeletal muscle mass |
BIA skeletal muscle mass index |
||
|---|---|---|---|---|
| Men | Women | Men | Women | |
| Lumbar spine BMD | ||||
| Correlation coefficient | 0.37a) | 0.28a) | 0.44a) | 0.19 |
| p-value | 0.0002 | 0.02 | 0.0004 | 0.12 |
| Femoral neck BMD | ||||
| Correlation coefficient | 0.34a) | 0.51a) | 0.23 | 0.33a) |
| p-value | 0.0005 | <0.0001 | 0.06 | 0.009 |
BIA, bioelectrical impedance analysis; BMD, bone mineral density.
Statistically significant.
Discussion
The results of the present study confirm a high correlation between BIA- and DXA-based measurements of ASMM and WFM among patients with LBP. This finding is consistent with previous studies assessing populations of healthy adults and athletes [3-7]. In Japan, LBP accounts for 24.5% of all cases of musculoskeletal pain among individuals aged ≥30 years. In addition, it is predicted that LBP will remain the most common musculoskeletal pain for the next 50 years [8]. Therefore, identifying the positive correlation between BIA- and DXA-based measurements may be beneficial in clinical practice.
The results demonstrated that BIA overestimated ASMM and consequently the SMI and underestimated WFM compared with DXA. This trend is consistent with a previous study reporting an overestimation of parameters using BIA compared with DXA in a healthy population [9]. In Taiwan, the diagnostic reference values based on BIA for sarcopenia among healthy elderly individuals were shown to be higher than those based on DXA [10]. Notably, the Asian Working Group for Sarcopenia recommended the following cutoff values for SMI: 7.0 kg/m2 for males and 5.4 kg/m2 for females using DXA-based measurements of ASMM and 7.0 kg/m2 for males and 5.7 kg/m2 for females using BIA-based measurements [11]. Based on our findings of BIA in the present study, we propose that the SMI cutoff values (calculated from BIA-based ASMM) may increase by approximately 1 kg/m2 (0.9 kg/m2 for males and 0.7 kg/m2 for females) in comparison to DXA-based cutoff values. This may correct the observed overestimation of BIA-based ASMM values. Therefore, the new recommended cutoff values for sarcopenia diagnosis based on BIA measurements is 7.9 kg/m2 for males and 6.1 kg/m2 for females.
Our study demonstrated a positive correlation between BIA-based measurements of ASMM and DXA-based measurements of BMD of the lumbar spine and femoral neck in both males and females. This relationship has been previously reported for DXA-based measurements [12,13]. Additionally, the present data show that SMI is positively correlated with BMD of the lumbar spine in males and that of the femoral neck in females. BIA is simpler and more cost-effective than DXA; thus, these results support the use of BIA as a favorable alternative to DXA for the screening of osteoporosis in clinical practice and research. Moreover, we propose that in patients with a SMI below the newly recommended cutoff BIA-based values, osteoporosis is a complication of LBP. The difference in the correlation between SMI-BMD and ASMM-BMD may reflect the risk of compression fracture and/or mild scoliosis associated with osteoporosis, affecting patient height. Taking this risk factor into consideration, it may be necessary to standardize muscle mass to a variable other than height, particularly in patients with LBP.
Two limitations of the present study must be acknowledged. First, patients with implants (often encountered in the field of orthopedics) were not included in the study. Second, the study did not examine previous treatments for osteoporosis received by patients, knowing that the presence or absence of such treatment could have influenced BMD.
Conclusions
In conclusion, a high correlation between BIA- and DXA-based measurements of ASMM and WFM was demonstrated for both male and female patients with LBP. Considering the consistent bias of BIA in ASMM, SMI, and WFM measurements compared with DXA, we recommended new BIA-based SMI cutoff values for sarcopenia of 7.9 kg/m2 for males and 6.1 kg/m2 for females. Moreover, BIA-based measurements of ASMM and SMI correlated well with DXA-based measurements of BMD. Therefore, BIA may provide a simpler and cost-effective alternative to DXA for the screening of sarcopenia and osteoporosis among adults with LBP.
Footnotes
No potential conflict of interest relevant to this article was reported.
Author Contributions
KF conducted data collection and data entry, and wrote the manuscript. KI and YE participated in the study design. SO, MS, GK, TS, JS, YS, KA, HK, MI, and HK developed data collection. All authors contributed to, read, reviewed, and approved the article.
References
- 1.Tanaka M, Nagai K, Koshiba H, Matui T, Kozaki K. Sarcopenia and its relationship with falling among outpatients attending a geriatric and memory clinic at Kyorin University Hospital. Nihon Ronen Igakkai Zasshi. 2017;54:63–74. doi: 10.3143/geriatrics.54.63. [DOI] [PubMed] [Google Scholar]
- 2.Baumgartner RN, Koehler KM, Gallagher D, et al. Epidemiology of sarcopenia among the elderly in New Mexico. Am J Epidemiol. 1998;147:755–63. doi: 10.1093/oxfordjournals.aje.a009520. [DOI] [PubMed] [Google Scholar]
- 3.Verney J, Schwartz C, Amiche S, Pereira B, Thivel D. Comparisons of a multi-frequency bioelectrical impedance analysis to the dual-energy X-ray absorptiometry scan in healthy young adults depending on their physical activity level. J Hum Kinet. 2015;47:73–80. doi: 10.1515/hukin-2015-0063. [DOI] [PMC free article] [PubMed] [Google Scholar]
- 4.Huang AC, Chen YY, Chuang CL, et al. Crossmode bioelectrical impedance analysis in a standing position for estimating fat-free mass validated against dual-energy X-ray absorptiometry. Nutr Res. 2015;35:982–9. doi: 10.1016/j.nutres.2015.08.005. [DOI] [PubMed] [Google Scholar]
- 5.Esco MR, Snarr RL, Leatherwood MD, et al. Comparison of total and segmental body composition using DXA and multifrequency bioimpedance in collegiate female athletes. J Strength Cond Res. 2015;29:918–25. doi: 10.1519/JSC.0000000000000732. [DOI] [PubMed] [Google Scholar]
- 6.Velazquez-Alva Mdel C, Irigoyen-Camacho ME, Huerta-Huerta R, Delgadillo-Velazquez J. A comparison of dual energy x-ray absorptiometry and two bioelectrical impedance analyzers to measure body fat percentage and fat-free mass index in a group of Mexican young women. Nutr Hosp. 2014;29:1038–46. doi: 10.3305/nh.2014.29.5.7254. [DOI] [PubMed] [Google Scholar]
- 7.Wang JG, Zhang Y, Chen HE, et al. Comparison of two bioelectrical impedance analysis devices with dual energy X-ray absorptiometry and magnetic resonance imaging in the estimation of body composition. J Strength Cond Res. 2013;27:236–43. doi: 10.1519/JSC.0b013e31824f2040. [DOI] [PubMed] [Google Scholar]
- 8.Suka M, Yoshida K. The national burden of musculoskeletal pain in Japan: projections to the year 2055. Clin J Pain. 2009;25:313–9. doi: 10.1097/AJP.0b013e31818c00c5. [DOI] [PubMed] [Google Scholar]
- 9.Buckinx F, Reginster JY, Dardenne N, et al. Concordance between muscle mass assessed by bioelectrical impedance analysis and by dual energy X-ray absorptiometry: a cross-sectional study. BMC Musculoskelet Disord. 2015;16:60. doi: 10.1186/s12891-015-0510-9. [DOI] [PMC free article] [PubMed] [Google Scholar]
- 10.Chien MY, Huang TY, Wu YT. Prevalence of sarcopenia estimated using a bioelectrical impedance analysis prediction equation in community-dwelling elderly people in Taiwan. J Am Geriatr Soc. 2008;56:1710–5. doi: 10.1111/j.1532-5415.2008.01854.x. [DOI] [PubMed] [Google Scholar]
- 11.Chen LK, Liu LK, Woo J, et al. Sarcopenia in Asia: consensus report of the Asian Working Group for Sarcopenia. J Am Med Dir Assoc. 2014;15:95–101. doi: 10.1016/j.jamda.2013.11.025. [DOI] [PubMed] [Google Scholar]
- 12.Miyakoshi N, Hongo M, Mizutani Y, Shimada Y. Prevalence of sarcopenia in Japanese women with osteopenia and osteoporosis. J Bone Miner Metab. 2013;31:556–61. doi: 10.1007/s00774-013-0443-z. [DOI] [PubMed] [Google Scholar]
- 13.Sjoblom S, Suuronen J, Rikkonen T, Honkanen R, Kroger H, Sirola J. Relationship between postmenopausal osteoporosis and the components of clinical sarcopenia. Maturitas. 2013;75:175–80. doi: 10.1016/j.maturitas.2013.03.016. [DOI] [PubMed] [Google Scholar]


