Abstract
Kidneys are highly vascularized and contain many distinct vascular beds. However, the origins of renal endothelial cells and roles of the developing endothelia in the formation of the kidney are unclear. We have shown that the Foxd1-positive renal stroma gives rise to endothelial marker-expressing progenitors that are incorporated within a subset of peritubular capillaries; however, the significance of these cells is unclear. The purpose of this study was to determine whether deletion of Flk1 in the Foxd1 stroma was important for renal development. To that end, we conditionally deleted Flk1 (critical for endothelial cell development) in the renal stroma by breeding-floxed Flk1 mice (Flk1fl/fl) with Foxd1cre mice to generate Foxd1cre; Flk1fl/fl (Flk1ST−/−) mice. We then performed FACsorting, histological, morphometric, and metabolic analyses of Flk1ST−/− vs. control mice. We confirmed decreased expression of endothelial markers in the renal stroma of Flk1ST−/− kidneys via flow sorting and immunostaining, and upon interrogation of embryonic and postnatal Flk1ST−/− mice, we found they had dilated peritubular capillaries. Three-dimensional reconstructions showed reduced ureteric branching and fewer nephrons in developing Flk1ST−/− kidneys vs. controls. Juvenile Flk1ST−/− kidneys displayed renal papillary hypoplasia and a paucity of collecting ducts. Twenty-four-hour urine collections revealed that postnatal Flk1ST−/− mice had urinary-concentrating defects. Thus, while lineage-tracing revealed that the renal cortical stroma gave rise to a small subset of endothelial progenitors, these Flk1-expressing stromal cells are critical for patterning the peritubular capillaries. Also, loss of Flk1 in the renal stroma leads to nonautonomous-patterning defects in ureteric lineages.
Keywords: kidney development, endothelial cell progenitors, vasculogenesis, renal stroma, Flk1, Foxd1
metanephric kidney development involves the highly integrated processes of metanephric mesenchyme induction and ureteric epithelium-branching morphogenesis (27, 28). The metanephric mesenchyme is subdivided into the nephrogenic mesenchyme, which surrounds ureteric tips and ultimately gives rise to nephron epithelia, and the Foxd1-marked renal stroma, which surrounds and signals with nephron progenitors and ureteric epithelia. The stroma has previously been shown to give rise to many cell types, including glomerular mesangial cells, pericytes, and vascular smooth muscle cells. Furthermore, the stroma appears to provide a developmental niche for developing vasculature. Ablation of the entire renal stroma leads to a wide array of kidney defects including mispatterning of the ureteric epithelium, the nephron progenitors, and the vasculature (4, 8, 11, 17).
As one of the primary functions of the kidney is to filter blood at the glomerulus and regulate tubular secretion and/or absorption of fluid and molecules, it has a complex vascular network, consisting of glomerular capillary loops, peritubular capillaries, vasa recta, and macrovascular beds. The focus of most studies has been placed on the glomerular capillaries with only a few focused on the other vascular compartments (as reviewed in Ref. 37). Furthermore, vascular formation in the kidney (as in other tissues) likely occurs as a result of both angiogenesis, in which vessels sprout off of preexisting vessels (such as the renal artery) and continue to grow and branch (1, 25, 26, 29), and vasculogenesis, where the formation of de novo vessels arises from vascular precursor cells (16). Recent studies also suggest that there are multiple sources of vasculogenic or angiogenic endothelial progenitors within the kidney (10). Recently, our laboratory identified a novel source of endothelial marker-expressing progenitors that arise from the Foxd1-positive renal stroma and that are ultimately present in a small subset of peritubular capillaries (35). Furthermore, it was shown that these endothelial marker-expressing stromal (EMES) cells could be propagated out of isolated stromal compartments (7, 13). The significance of these EMES cells in the developing and postnatal kidney is unknown.
To interrogate the role of EMES cells in patterning the renal vasculature and other kidney lineages, we generated Foxd1cre-mediated conditional knockouts of Flk1 in the renal stroma (Flk1ST−/− mice). Flk1 (VEGFR2/KDR) is a vascular endothelial growth factor receptor that is critical for formation and maintenance of endothelial cells (31). Flk1ST−/− mice developed dilated peritubular capillaries persisting into adulthood. In addition, there are nonautonomous defects including a paucity of mature collecting ducts, hypoplastic renal papillae, and associated urinary-concentrating defects.
MATERIALS AND METHODS
Animals.
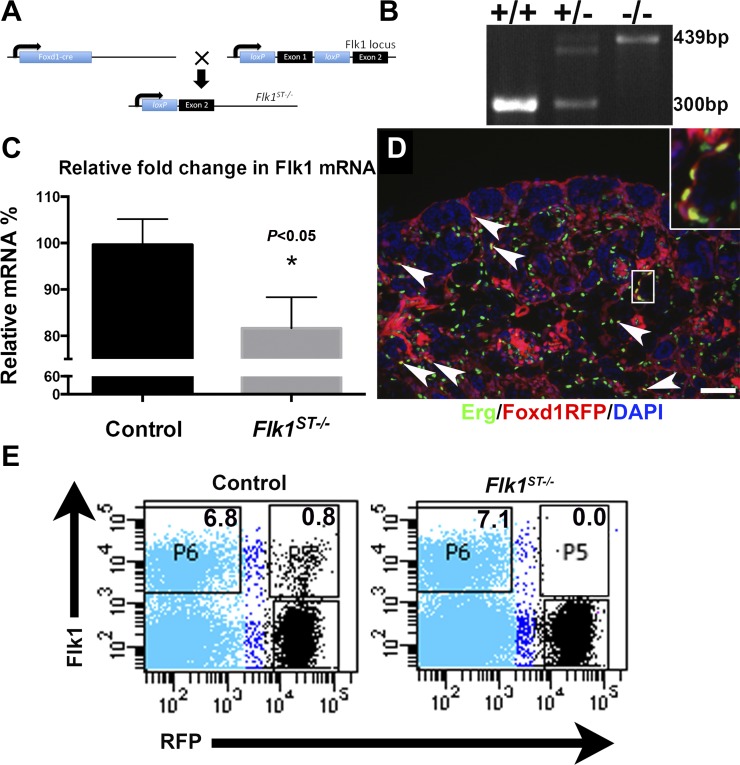
We used the transgenic Foxd1EGFPcre mouse line that expresses GFP and cre recombinase in the renal stroma (12). These mice were bred with Flk1-floxed mice (Flk1fl/fl) (gift from Janet Rossant, Hospital for Sick Children, Toronto, Canada) to generate Foxd1cre; Flk1fl/fl mice (Fig. 1A) that conditionally delete Flk1 in the Foxd1-positive EMES (Flk1ST−/−). To permanently label and track the fate of the Foxd1-expressing cells, we bred Flk1ST−/− mice with TdTomato:CAG (tdTomato) reporter mice (The Jackson Laboratory) that express red fluorescent protein (RFP) in all cre-positive derivatives (18). The University of Pittsburgh Institutional Animal Care and Use Committee approved all experiments (Approval No. 16088935).
Fig. 1.
Foxd1-derived endothelium are deleted from the Flk1ST−/− mutant animals embryonically. A: schematic showing the construct and breeding strategy for the deletion of Flk1 using the Foxd1cre. B: representative genotyping showing a wild-type (single bottom band), heterozygote (double band), and homozygote (top band). C: graph indicating an ~20% reduction in relative mRNA levels in E15.5 Flk1ST−/− kidneys vs. littermate controls (n = 3, where each n represents pooled kidneys from a single litter of controls and mutants). D: representative immunofluorescence image of an embroynice day 18.5 (E18.5) Foxd1creTdTomato kidney (Foxd1RFP) costained with the vascular transcription factor Erg (green). The localization of the endothelial marker-expressing stromal (EMES) cells can be seen speckled throughout the cortex and medulla (arrows). Inset: a cluster of the EMES cells. DAPI is shown in blue. Scale bar = 100 μm. E: representative FACS plots of RFP-tagged E15.5 Flk1ST−/− mutant kidneys showing a virtual absence of RFP-positive/Flk1-positive cells (P5), confirming conditional deletion of Flk1 in the Foxd1-positive renal stroma.
Genotyping.
Genotyping was performed as previously described (11, 35). In brief, tail clippings of embryonic tissues were collected and genomic DNA was extracted. PCR was utilized to identify all mouse genotypes. The primers used to detect the Foxd1EGFPcre allele were as follows: forward 5′-TCTGGTCCAAGAATCCGAAG-3′ and reverse 5′-GGGAGGATTGGGAAGACAAT-3′, which showed a cre-positive band at 450 basepairs (bp) while cre-negative mice had no band. The primers used to detect the Flk1-floxed allele were as follows: forward 5′-TGGAGAGCAAGGCGCTGCTAGC-3′ and reverse 5′-CTTTCCACTCCTGCCTACCTAG-3′, which showed a wild-type band at 300 bp and a mutant band at 439 bp (Fig. 1B). The presence of RFP in the embryos was visualized using a dissecting microscope and confirmed using primers. To detect the presence of the TdTomato we utilized the following” forward 5′-CTGTTCCTGTACGGCATGG-3′ and reverse 5′-GGCATTAAAGCAGCGTATCC-3′, which showed a single band at 196 bp.
Microangiography and quantitation of vessel diameter.
Postnatal day 30 (P30) mutant and control juvenile animals were subjected to fluorescent microangiography (n = 6 for each genotype) as previously published (15). In brief, following the anesthetization, mice were intracardiac injected with an agarose-fluorescent microbead mixture. Kidneys were then excised, placed on ice for 10 min, and then fixed with 4% paraformaldehyde. The kidneys were then processed into frozen blocks and exhaustively sectioned. Five levels were collected through each kidney, which were then stained with an antibody to PECAM (CD31; Cat. No. 553370; BD Biosciences) and imaged along with the fluorescent microbeads. These images were then quantitated using MATLAB as previously described (15), and high-throughput analysis revealed peritubular capillary area and perimeter.
Tissue collection.
For frozen sectioning, whole embryos and kidneys were dissected, fixed in 4% paraformaldehyde (PFA), dehydrated in 30% sucrose, and then embedded in OCT medium. Sections were subsequently cut at 6 µm on a cryostat and stored at −80°C. For wholemount collection, kidneys were dissected in a similar manner, fixed in 4% PFA overnight, dehydrated through 100% methanol the next day, and subsequently stored in chamber wells at −20°C.
Flow sorting.
Flow sorting was performed as previously described (35). In brief, E15.5 kidneys from Foxd1cre; Flk1fl/+; TdTomato heterozygous control (n-6) and Foxd1cre; Flk1fl/fl; TdTomato mutant (n = 6) mice were harvested and dissociated into single cell suspensions. The cells were subsequently immunostained for Flk1 (Cat. No. 560070 or 561259; BD Biosciences) or PECAM (Cat. No. 551262 or 561410 or 561813; BD Biosciences) at a concentration of 1:20, and the percentages of RFP-positive (Foxd1 derived) cells or Flk1- or PECAM-positive cells (endothelial cells) and double-positive cells were determined.
Three-dimensional reconstruction.
The three-dimentional (3D) reconstructions were performed as previously described (5, 32, 33). In brief, embryonic day 13.5 (E13.5) embryos (n = 5 per genotype) were harvested, fixed with PFA, and processed into paraffin. These embryos were then exhaustively sectioned at 5 μm. The sections were stained with hematoxylin and eosin, and the various renal lineages were traced using Microbrightfield software (MBF Bioscience) from which ureteric and nephron structure volume and area were determined. Ureteric epithelial images were then exported into Imaris imaging software (Bitplane, Concord, MA), and a skeletonized ureteric tree was generated, allowing for tip number and ureteric length to be determined.
Real time PCR.
Real time PCR analysis was performed as previously described (5). In brief, each sample consisted of pooled control or mutant kidney mRNA from one litter (n = 3 litters). RNA from these pooled samples was analyzed using a C1000 Thermal Cycler (Bio-Rad, Hercules, CA) to determine the levels of Flk1, Foxd1, Notch 2, Raldh2, Sox17, and Sox18 mRNA in the tissues.
Tissue section analysis.
For immunofluorescence, embryonic or isolated tissue sections were blocked in a 10% bovine, serum albumin/donkey serum solution in PBS and incubated at 4°C overnight with primary antibodies Endomucin (Cat. No. Sc65495; Santa Cruz Biotechnology), PECAM (BD Biosciences), Erg (Cat. No. EPR3864; Epitomics), activated caspase-3 (Cat. No. G7481; Promega), aquaporin 2 (Aqp2; Cat. No. KP9201; Calbiochem), Meis1 (Cat. No. 10599, Santa Cruz Biotecnology), tenascin C (Cat. No. AB19011, Millipore), α-smooth muscle actin (Cat. No. A5228; Sigma), or DBA lectin (Cat. No. FL1031; Vector Laboratories). The following day, slides were washed several times in PBS and incubated with the appropriate secondary antibody for 1 h each. DAPI stains were applied over the last 15 min after which there was a third round of PBS washes. Staining was visualized with a Leica upright microscope (Leica, Buffalo Grove, IL). For the immunohistochemical staining for Endomucin, primary antibody was applied as above and then an anti-rat ABC kit (Cat. No. PK-6104; Vector Laboratories) was utilized to visualize the stain and counterstained with hematoxylin and eosin.
Twenty-four hour urine collection.
P30 control and mutant mice (n = 6, for each genotype) were placed in metabolic cages (1 animal/cage) for 24 h after training period as previously described (34). Water and food were carefully weighed before and after the 24-h collection period, and the urine and fecal matter were weighed. Urine was also tested for osmolarity (mosM). The body weight was also measured at the beginning and the conclusion of the 24-h period. Each mouse was recorded twice to avoid any discrepancies.
Statistics.
Data is presented as means ± SD. For single group comparison, a Student t-test was utilized. For multiple group comparisons, ANOVA with post hoc Bonferroni correction was applied. All statistical analyses, including linear regression analyses, were performed using GraphPad Prism software, version 5.0c (GraphPad Software, San Diego, CA). P < 0.05 was considered to indicate a statistically significant difference.
RESULTS
Confirmation of Flk1 deletion in the Foxd1-derived endothelium.
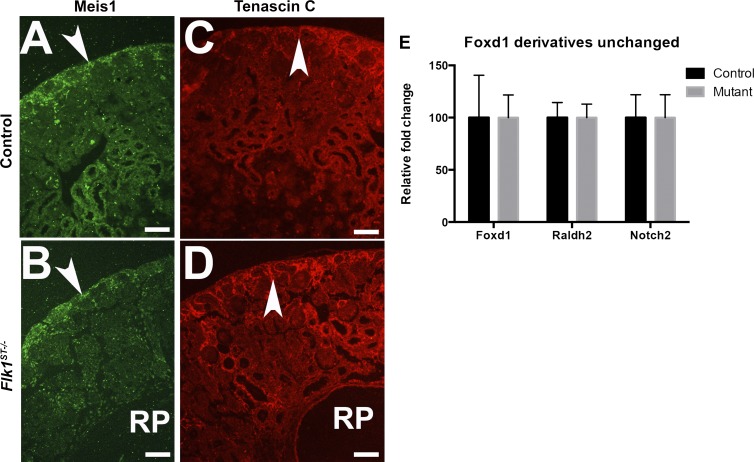
We have previously observed that the embryonic kidney contains endothelial marker-expressing cells that are derived from a Foxd1-positive stromal lineage (7, 13, 35). To determine the role of Flk1 in these cells on the formation of the kidney, we utilized a conditional knockout approach breeding Foxd1cre mice (12) with Flk1-floxed mice to produce Foxd1cre; Flk1fl/fl (Flk1ST−/−) mice. We first harvested embryonic kidneys and performed real-time PCR analysis for Flk1 mRNA expression. We observed approximately a 20% decrease in Flk1 mRNA expression in mutant kidneys vs. cre-negative littermates at E15.5. (Fig. 1C). This 20% reduction of Flk1 mRNA expression in the total kidney is greater than the observed numbers of EMES cells (1–3%) that are present (7, 13, 35) and may reflect abnormalities in overall vascular patterning. To confirm the deletion of Flk1 in EMES cells, we bred the Flk1ST−/− mice with a TdTomato (RFP) cre reporter mouse line and performed FACsorting for RFP (Foxd1-derived cells) and Flk1. Even when we were conservative about setting the gates, we found that embryonic controls had double-labeled cells (Fig. 1E), whereas they were virtually absent in Flk1ST−/− kidneys (Fig. 1E). This is important because in vitro studies have shown that there is a common Flk1-positive progenitor that can give rise to both endothelium and pericytes depending on whether they are exposed to VEGF or PDGF-B (3, 38). However, previous studies from our laboratory have shown that in the kidney Flk1 is confined to endothelium (35), and upon isolation using FACSorting of embryonic kidneys, these cells specifically give rise to endothelium (7, 13). Furthermore, to this we also showed the deletion was specific to endothelial cells as the other Foxd1 markers (Foxd1, Notch2, and Raldh2) had unchanged expression levels and stromal architecture (as marked by Meis1 and tenascin C) (Fig. 2).
Fig. 2.
Stromal genes are unchanged in Flk1ST−/− mutant kidneys. A and B: Immunofluorescence staining for the stromal marker Meis1 at E18.5 reveals a similar expression pattern in the cortical stroma (arrow) in controls (A) and mutants (B). The dilated renal pelvis (RP) is prevalent in the mutant. C and D: immunofluorescence staining for the stromal marker tenascin C at E18.5 reveals a similar expression pattern in the cortical stroma (arrow) in controls (C) and mutants (D). The dilated RP is prevalent in the mutant. Scale bar = 100 μm. E: histogram is representative of real time PCRs conducted on mutants and controls at E15.5 showing that the remaining Foxd1-derived lineages (marked by Foxd1, Raldh2, and Notch2) were unaltered.
Flk1ST−/− mutants have defective vascular formation.
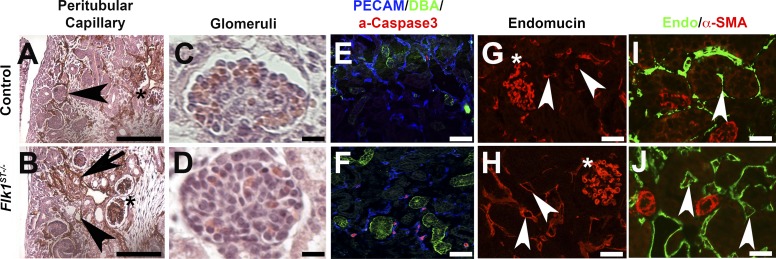
We next investigated the conditional deletion of Flk1 in the Foxd1-expressing cells on the remnant vessels. At E15.5, many of the Flk1ST−/− remnant peritubular capillaries were disorganized and dilated compared with controls (Fig. 3, A and B), while the glomerular capillaries were unaffected (Fig. 3, A–D). Activated caspase 3 staining revealed increased apoptosis in microvasculature surrounding the DBA-positive collecting ducts in mutants vs. controls (Fig. 3, E and F). The cells undergoing apoptosis in Flk1ST−/− kidneys may be EMES cells that lack Flk1, and fail to mature, or they could potentially be remnant vessels (31). Endomucin staining showed that dilatation of the remnant peritubular capillaries persisted in adult Flk1ST−/−animals vs. controls (Fig. 3, G and H).
Fig. 3.
Flk1ST−/− mutant kidneys have dilated peritubular capillaries. A and B: immunohistochemistry staining for Endomucin (brown) at E15.5 show controls (A) with normal small caliber microvessels; however, mutants (B) displayed dilated peritubular capillaries (arrowheads) and a lack of organization (arrows) although the glomerular capillaries (stars) were unaffected. C and D: hematoxylin and eosin (H&E)-stained glomeruli at E18.5 reveal no obvious differences between control (C) and mutant (D) glomerular capillaries. E and F: control (E) and Flk1ST−/− kidney sections (F) stained for PECAM (endothelial cells, blue), DBA (collecting ducts, green), and activated caspase 3 (apoptosis, red) reveal markedly more apoptotic nuclei in mutant endothelial cells that surround the collecting ducts than in controls (E). G and H: postnatal day 30 (P30) kidneys stained with Endomucin (microvasculature, red) that shows significant dilatation in the mutant (H) peritubular capillaries (arrowheads) compared with controls (G), while glomerular capillaries appear equivalent (asterisk). I and J: 30 kidneys stained with Endomucin (green) and costained with the smooth muscle marker α-smooth muscle actin (α-SMA; red). The large muscular vessels show abundant α-SMA (red) in both the controls (I) and mutants (J). However, the mutant peritubular capillaries are dilated and do not express α-SMA (arrows). Scale bars: A and B = 200 μm; C and D = 25 μm; E–J = 100 μm.
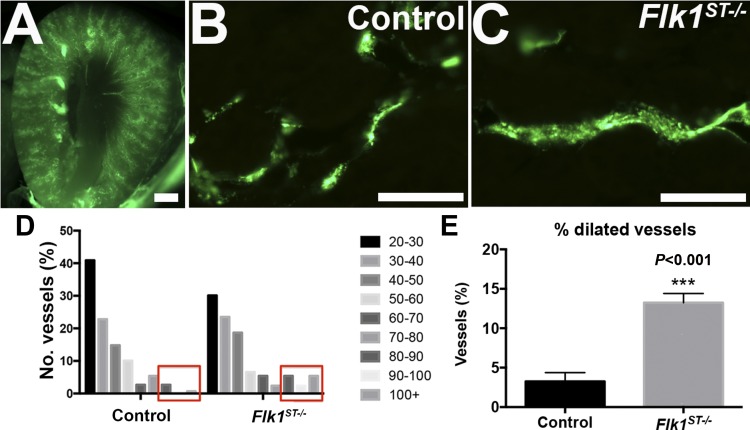
We verified that the percentage of peritubular capillaries with a diameter >80 μm was higher in the postnatal mutant kidneys compared with controls (controls = 3.4% vs. mutants 13.2%, *P < 0.001), using microangiography to measure capillary vessel diameter and unbiased quantitation (15) (Fig. 4).
Fig. 4.
Fluorescent microangiography confirms dilated peritubular capillaries. A and B: representative images from fluorescent microangiography at P30 kidneys showing low (A)- and high-power (B) images of controls. C: representative image of a dilated capillary in the mutant. D: graph of the distribution of the microvessel caliber (area, μm2) from angiography reveals that the mutant microvasculature has a shift to the right, indicating relatively dilated capillaries compared with controls. E: histogram showing the percentage of dilated vessels. Scale bars: A = 1, 000 μm; B = 100 μm; n = 5 for both groups.
Flk1ST−/− mutants have defective ureteric branching and nephron formation.
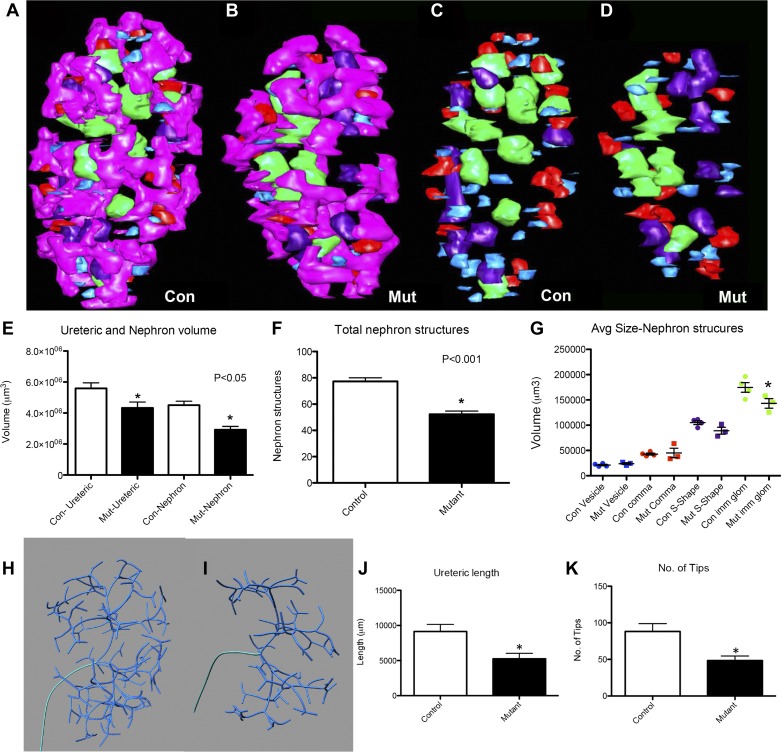
Given the disrupted microvasculature in Flk1ST−/−embryonic kidneys, we next assessed whether these developmental defects were associated with nonautonomous effects on other renal lineages. Utilizing 3D reconstruction, we observed an overall reduction in the volume and surface area of E13.5 Flk1ST−/− kidneys vs. controls (Fig. 5, A–D, and Table 1). In addition, 3D reconstructions revealed relatively normal overall architecture of the mutant ureteric trees and developing nephron structures, although there appeared to be fewer of each compared with controls (Fig. 5, A–D). Quantitative analyses of the 3D reconstructions did confirm a decrease in E13.5 mutant ureteric and nephron volume as well as total nephron number (Fig. 5, E and F and Table 1). Interestingly as nephron structures advanced in maturity, mutant structures (i.e., S-shaped bodies were trending and immature glomeruli) were smaller than their control littermate counterparts (Fig. 5G). Skeletonization of the ureteric tree revealed a reduction in total mutant ureteric length and in the number of tips (Fig. 5, H–K and Table 1). This likely reflects a direct effect of a loss of the Foxd1-derived endothelium on the formation of the nephrons.
Fig. 5.
Flk1ST−/− kidneys have abnormal ureteric branching morphogenesis and nephron formation. A–D: 3-dimensional (3D) reconstructions of E13.5 kidneys appear to show less ureteric branching (B, pink) and fewer developing nephron structures (B and D) than controls (A and C). Blue: renal vesicle; red: comma-shaped body; purple: S-shaped body; and green: immature glomeruli. E: histogram depicting the reduction in mutant ureteric and nephron volume vs. controls. F: histogram confirming that there are fewer developing nephron structures in the mutants compared with the controls. G: histogram showing that volumes of the more mature nephron structures are reduced in the mutants in comparison with the controls. H and I: skeletonization of the ureteric epithelium appears to show less ureteric branching in E13.5 mutants (I) compared with controls (H). J and K: graphs confirming a reduction in both mean total ureteric length (J) and ureteric tip number (K) in the mutants as compared with controls. For all graphs, *P < 0.05; n = 5 for both groups.
Table 1.
Embryonic day 13.5 control and Flk1ST−/− mean kidney measurements
| Control (n = 5) | Mutant (n = 5) | |
|---|---|---|
| Kidney | ||
| Volume, µm3 | 4.10 × 10⁷ ± 1.11 × 10⁷ | 2.66 × 10⁷ ± 0.71 × 10⁷* |
| Surface area, µm2 | 5.51 × 10⁵ ± 1.07 × 10⁵ | 4.05 × 10⁵ ± 0.92 × 10⁵* |
| Ureteric tree | ||
| Volume, µm3 | 4.85 × 10⁶ ± 1.30 × 10⁶ | 3.31 × 10⁶ ± 0.99 × 10⁶* |
| Relative volume, % | 11.9 ± 0.1 | 12.4 ± 0.98 |
| Total length, µm | 9.14 × 10³ ± 2.26 × 10³ | 5.26 × 10³ ± 1.73 × 10³* |
| Tip number | 88.2 ± 23.9 | 50.6 ± 13.9* |
| Branch number | 85.2 ± 22.7 | 48.4 ± 14.1* |
| Nephron | ||
| Volume, µm3 | 3.72 × 10⁶ ± 1.21 × 10⁶ | 1.73 × 10⁶ ± 1.17 × 10⁶* |
| Relative volume, % | 9.0 ± 0.8 | 5.9 ± 3.1* |
| Number | 65.4 ± 20.0 | 36.0 ± 16.2* |
| Average volume, µm3 | ||
| Renal vesicle | 2.35 × 10⁴ ± 0.33 × 10⁴ | 2.19 × 10⁴ ± 0.15 × 10⁴ |
| Comma shape | 5.36 × 10⁴ ± 1.15 × 10⁴ | 5.11 × 10⁴ ± 1.31 × 10⁴ |
| S shape | 10.05 × 10⁴ ± 1.18 × 10⁴ | 8.16 × 10⁴ ± 2.67 × 10⁴ |
| Immature glomeruli | 16.50 × 10⁴ ± 1.89 × 10⁴ | 12.49 × 10⁴ ± 2.03 × 10⁴* |
Values are means ± SE.
P < 0.05.
Flk1ST−/− mutant kidneys have underdeveloped papilla.
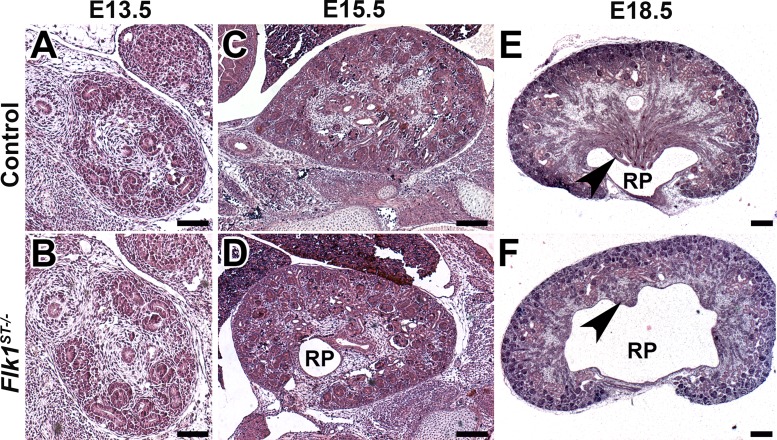
To interrogate the overall formation of the kidney in the Flk1ST−/− mutants, we performed a thorough histological evaluation from E13.5 through to E18.5 (Fig. 6). At E13.5, the overall formation of the kidney is comparable between the mutants and the controls (Fig. 6, A and B). However, by E15.5, we observed a dilated renal pelvis beginning to become prominent (Fig. 6, C and D). We next examined kidneys from E18.5 controls and Flk1ST−/− mutants to determine the consequence of the early reduction in branching morphogenesis. Hematoxylin and eosin-stained sections revealed that mutants had hypoplastic renal papillae (of variable severity) and a paucity of collecting medullary ducts compared with controls (Fig. 6, E and F).
Fig. 6.
Histological examination of Flk1ST−/− kidneys reveals timing of papillary hypoplasia. A–F: representative histological images from E13.5–18.5 stained with H&E. A and B: the cross section of the E13.5 kidney does not reveal dramatic histological differences in the controls (A) and mutants (B). C and D: although at E15.5 the kidney size looks equivalent between the controls (C) and mutants (D) the beginning of the dilated RP is observed. E and F: representative images of E18.5 kidneys display the dilated renal pelvis and the hypoplastic medulla with the paucity of collecting ducts (arrows) in mutants (F) compared with controls (E). Scale bars: A and B = 75 μm; C and D = 200 μm; E and F = 250 μm.
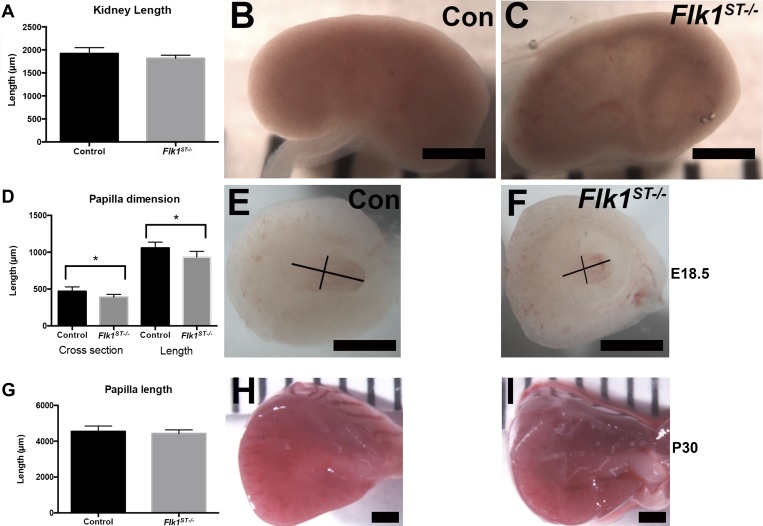
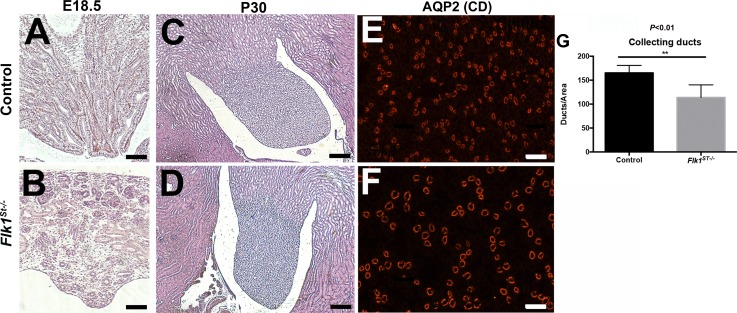
Although the overall kidney size was not altered by E18.5, a subset of the mutant kidneys (12/20) appeared hollowed out, as indicated by their translucent appearance (Fig. 7, A–C). However, when we bisected even the nonhollowed out kidneys and measured the length (control = 1,059 ± 78 μm; mutant = 935 ± 76 μm; P < 0.01, n = 8) and width (control = 470 ± 60 μm; mutant = 389 ± 38 μm; P < 0.01, n = 8) of the papilla, we found it to be smaller in the mutant kidneys compared with controls (Fig. 7, D–F). Interestingly, by P30, the mutant papillae largely grew to normal size compared with controls (Fig. 7, G–I). Histological examination of the papilla of control and mutants confirmed the dysplastic papilla in the Flk1ST−/− kidneys at E18.5 (Fig. 8, A and B) that had resolved by P30 (Fig. 8, C and D); however, immunostaining with Aqp2 (collecting duct marker) revealed a marked decrease in the density of P30 Flk1ST−/− collecting ducts and these were larger in diameter compared with controls (Fig. 8, E and F). Quantitative analysis confirmed a reduction in the number of Aqp-2 positive collecting ducts (control = 165 ± 16; mutant = 114 ± 26; P < 0.01) per area in P30 mutant kidneys vs. controls (Fig. 8G).
Fig. 7.
Mutant kidneys have comparable size but variable papillary hypoplasia. A: histogram showing that the kidney length is unaltered in mutants in comparison to controls. B and C: wholemount images that depict the subset (12/20) of mutant kidneys which are hollowed out (translucent) (C) in comparison to controls (B) at E18.5. D: histogram showing that the mutant papilla at E18.5 is hypoplastic in the mutants compared with controls (control: n = 24; Flk1ST−/−: n = 8). E and F: wholemount images of the kidneys that were bisected revealing the hypoplastic papilla even in the mutant kidneys that did not appear hollowed out (F) compared with controls (E). The black lines are representative of the measurements of the lengths and cross sections of the papilla. G: histogram of papilla length at P30 shows no difference between control and mutants. H and I: wholemount images of P30 juvenile kidneys that were bisected depicting equivalent renal papilla in the control and mutant kidneys. Scale bars: B, C, E, F, H, and I = 1,000 μm.
Fig. 8.
Flk1ST−/− mice display a hypoplastic medulla and a paucity of collecting ducts A and B: representative images of E18.5 renal papilla show that compared with the control (A), the mutant remnant medullae have fewer and disorganized tubular epithelial structures (B). C and D: representative adult papillary images displaying regrowth of the papilla in the mutants (D), which is now comparable to controls (C). E and F: Representative aquaporin 2 (Aqp2) immunofluorescent images indicating that compared with controls (E), mutant medullary regions (F) have fewer and dilated collecting ducts. G: histogram confirms a reduction in Aqp2-positive collecting ducts per area in mutants vs. controls. Scale bars: A and B = 250 μm; C and D = 500 μm; E and F = 100 μm.
Flk1ST−/− mutants have a mild urinary concentrating defect.
To examine the functional consequences of the reduction in mutant collecting ducts, we performed 24-h urine collection concurrent with quantification of water intake in control and mutant mice. We found that compared with controls, P30 mutants had a trend for increased water intake (control = 3.4 ± 1.0 ml; mutant = 4.0 ± 1.7 ml; P = 0.26), increased urine output (control = 1.3 ± 0.5 ml; mutant = 1.9 ± 0.6; P < 0.05) and a decrease in urine osmolality (control = 2,847 ± 567 mosM; mutant = 1,612 ± 487 mosM; P < 0.05), all consistent with a concentrating defect (Fig. 9, A–C).
Fig. 9.
Flk1ST−/− mice have a mild concentrating defect. A–C: histograms of data collected from 24-h water intake and urine collections revealed mild trends for increased water intake (A), increased urine output (B), and lower osmolarity (C) in mutants vs. control animals, consistent with concentrating defects in mutants. *P < 0.05; controls: n = 16; mutants: n = 17.
DISCUSSION
From these studies, we determined that EMES cells are critical for maintaining appropriately patterned peritubular capillaries. Furthermore, that deletion of Flk1 in these cells lead to ureteric branching defects and these caused the formation of a hypoplastic medulla and shortening of the papilla that resolved postnatally but caused concentrating defects. These findings are discussed in turn.
Although no specific congenital malformation of the peritubular capillaries has been identified (likely due to the complex nature of this vascular network), it is interesting to note the variability of recovery after ischemic injury as is seen following acute kidney injury (22). This is largely a peritubular capillary-induced lesion, and it may be hypothesized that subtle (albeit nonpathological) congenital abnormalities of the microvasculature leave these kidneys susceptible to future insults. To add to this, one of the other primary microvascular injuries is seen in diabetics where the primary site of damage is the peritubular capillaries (19). We show that when we conditionally delete Flk1 in EMES cells from the outset, we observe disorganized and dilated microvasculature at an early developmental stage. From the proximity of these cells, they are likely to be incorporated into the peritubular capillaries. Previously we have shown that the EMES cells represent a small population of cells making up approximately 1–3% of all the endothelium in the kidney (35). We hypothesize that these cells contribute to the vasculogenic endothelium within the kidney and may act to set up a primitive vascular plexus as well as to hone the ingrowing angiogenic vessels to the appropriate location (37). Subsequently, when Flk1 is deleted in these cells in the Flk1ST−/− kidneys, we see the disorganization of the microvasculature and dilation of the remnant peritubular capillaries. These findings are in contrast to other studies that have lineage tagged the Foxd1 stroma using β-gal or the mTmG mouse and immunohistochemistry for Flk1 or CD31 (12, 14, 30). We have performed similar analysis, and it is extremely difficult to localize these cells with that approach, due to the fact that Flk1 and CD31 are expressed in the cytoplasm and Foxd1 is a transcription factor expressed in the nucleus. It was not until we performed the FACS analysis that the abundance of these EMES cells was apparent. For the immunofluorescence localization of these cells, the use of Erg (transcription factor) and the Foxd1cre bred to the TdTomato was the only combination that showed reliable results. As we have depicted in Fig. 1, the visualization of the yellow cells makes for the easier identification and localization of these cells. In addition to this in collaboration with the laboratory of Vainio et al. (7, 13), we have been able to isolate the Foxd1 stroma and grow the cells as organoids. Using this approach, we have been able to produce endothelium from these organoids in the absence of all other cells types showing the capacity of the renal stroma to differentiate into endothelium (7, 13). However, a limitation of our study is that we did not employ the inducible Foxd1cre mouse as was previously done by Kobayashi et al. (14). Thus we cannot definitively rule out expression in an unrelated lineage or residual Flk1 expression in the early common Foxd1/Six2 nephron progenitors.
Our findings indicate that early ureteric branching is inhibited in the Flk1ST−/− kidneys and that this was coupled with smaller nephron lineages likely as a result. Previously, it has been shown that VEGF signaling is stimulatory for ureteric branching (20). It was also confirmed that blocking of Flk1 leads to a reduction in ureteric branching (6). It is thus likely that deletion of Flk1 in the EMES cells leads to a reduction in VEGF-FLK1 signaling (as seen in the reduction in Flk1 mRNA) and this predisposes as a noncell autonomous defect on ureteric branching and nephron formation. Previously, we have shown that deletion of Fgfr2 in the ureteric epithelium causes a reduction in ureteric branching leading to an increase in nephron size (33), suggesting that loss of several growth factors in the microenvironment can reduce the final cytoarchitecture. Another possibility is that early EMES cells have unidentified trophic factors for the ureteric and/or nephron lineages that are absent or reduced in the Flk1ST−/− mutants.
Interestingly, the early branching defects observed in the Flk1ST−/− kidneys manifest into a hypoplastic medulla and papilla with varying severity that resolves as the animals age. The variability of the phenotype may be as a result of inefficient conditional deletion of Flk1 in the renal stroma as it has previously been shown with the Foxd1cre line (4, 11, 23). This papillary catch up growth recapitulates the findings in mice that angiotensin II signaling mediates postnatal papillary growth, and it can be postulated, as is the case with our mutants, that there is a rapid proliferative state postnatally leading to the lengthening (36). However, fewer collecting ducts are observed and mice have a mild concentrating defect. Future studies will aim to elucidate the cause of the concentrating defects and whether they are specifically due to the underdeveloped collecting ducts or abnormal peritubular capillary formation. The defective formation of the medullary microvasculature may leave these animals susceptible to becoming anemic or urinary tract infections as is seen in medullary cystic disease and nephronophthisis (2, 9). Although we did not see alterations in renal erythropoietin levels via real time PCR in our adult mutants (data not shown), we will aim future studies on this phenomenon. Taken together, these findings suggest critical roles for Foxd1-derived EMES cells in the formation of both the vascular and nonvascular compartments of the kidney. A similar phenotype has been described in mice with combined deletion of Sox17/18, genes that are expressed in a subset of endothelial cells, which like our mutant mice develop a hypoplastic renal medulla and dilatation of the peritubular capillaries (21). Whole kidney expression of either Sox17 or Sox18 by qunatitative PCR in embryonic Flk1ST−/− mice was unaltered vs. controls (data not shown). Furthermore, recent studies have shown in a hypoplastic renal medulla model that the vasculature becomes perturbed suggesting that there is likely feedback between these two dynamic structures (24). Consequently, there is likely either loss of another trophic signal or perfusion defects that contribute to the ureteric/collecting duct and nephrogenesis defects in the Flk1ST−/− mutants. Thus defects in the microvasculature may represent an underrecognized means by which renal developmental abnormalities/renal fetal reprogramming may occur, possibly increasing susceptibility to hypertension or chronic kidney disease in the future.
DISCLOSURES
No conflicts of interest, financial or otherwise, are declared by the authors.
AUTHOR CONTRIBUTIONS
E.M., K.V.M., and S.S.-L. conceived and designed research; E.M., K.V.M., E.P., D.S.B., C.M.S., and S.S.-L. performed experiments; E.M., K.V.M., E.P., D.S.B., C.M.S., R.K., J.H., B.D.H., C.M.B., and S.S.-L. analyzed data; E.M., K.V.M., E.P., D.S.B., C.M.S., R.K., J.H., B.D.H., C.M.B., and S.S.-L. interpreted results of experiments; E.M., K.V.M., E.P., D.S.B., C.M.S., and S.S.-L. prepared figures; E.M., K.V.M., and S.S.-L. drafted manuscript; E.M., K.V.M., J.H., C.M.B., and S.S.-L. edited and revised manuscript; E.M., K.V.M., E.P., D.S.B., C.M.S., R.K., J.H., B.D.H., C.M.B., and S.S.-L. approved final version of manuscript.
ACKNOWLEDGMENTS
The authors would like to thank the flow-sorting core for extensive assistance throughout this project, in particular Alison Logar, and Joshua Michel. We would also like to thank Dr. Janet Rossant for the kind donation of the Flk1 floxed mouse line. K. Maringer is supported by National Institute of Diabetes and Digestive and Kidney Disease (NIDDK) Grant F32 (DK111165), S. Sims-Lucas is supported by NIDDK Grants K01 (DK096996) and R03 (DK110503).
REFERENCES
- 1.Abrahamson DR, Robert B, Hyink DP, St John PL, Daniel TO. Origins and formation of microvasculature in the developing kidney. Kidney Int Suppl : S7–S11, 1998. doi: 10.1046/j.1523-1755.1998.06702.x. [DOI] [PubMed] [Google Scholar]
- 2.Ala-Mello S, Kivivuori SM, Rönnholm KA, Koskimies O, Siimes MA. Mechanism underlying early anaemia in children with familial juvenile nephronophthisis. Pediatr Nephrol : 578–581, 1996. doi: 10.1007/s004670050164. [DOI] [PubMed] [Google Scholar]
- 3.Carmeliet P. Manipulating angiogenesis in medicine. J Intern Med : 538–561, 2004. doi: 10.1111/j.1365-2796.2003.01297.x. [DOI] [PubMed] [Google Scholar]
- 4.Das A, Tanigawa S, Karner CM, Xin M, Lum L, Chen C, Olson EN, Perantoni AO, Carroll TJ. Stromal-epithelial crosstalk regulates kidney progenitor cell differentiation. Nat Cell Biol : 1035–1044, 2013. doi: 10.1038/ncb2828. [DOI] [PMC free article] [PubMed] [Google Scholar]
- 5.Di Giovanni V, Walker KA, Bushnell D, Schaefer C, Sims-Lucas S, Puri P, Bates CM. Fibroblast growth factor receptor-Frs2α signaling is critical for nephron progenitors. Dev Biol : 82–93, 2015. doi: 10.1016/j.ydbio.2015.01.018. [DOI] [PMC free article] [PubMed] [Google Scholar]
- 6.Gao X, Chen X, Taglienti M, Rumballe B, Little MH, Kreidberg JA. Angioblast-mesenchyme induction of early kidney development is mediated by Wt1 and Vegfa. Development : 5437–5449, 2005. doi: 10.1242/dev.02095. [DOI] [PubMed] [Google Scholar]
- 7.Halt KJ, Pärssinen HE, Junttila SM, Saarela U, Sims-Lucas S, Koivunen P, Myllyharju J, Quaggin S, Skovorodkin IN, Vainio SJ. CD146(+) cells are essential for kidney vasculature development. Kidney Int : 311–324, 2016. doi: 10.1016/j.kint.2016.02.021. [DOI] [PubMed] [Google Scholar]
- 8.Hatini V, Huh SO, Herzlinger D, Soares VC, Lai E. Essential role of stromal mesenchyme in kidney morphogenesis revealed by targeted disruption of Winged Helix transcription factor BF-2. Genes Dev : 1467–1478, 1996. doi: 10.1101/gad.10.12.1467. [DOI] [PubMed] [Google Scholar]
- 9.Hildebrandt F, Attanasio M, Otto E. Nephronophthisis: disease mechanisms of a ciliopathy. J Am Soc Nephrol : 23–35, 2009. doi: 10.1681/ASN.2008050456. [DOI] [PMC free article] [PubMed] [Google Scholar]
- 10.Hu Y, Li M, Gothert JR, Gomez RA, Sequeira-Lopez ML. Hemovascular progenitors in the kidney require sphingosine-1-phosphate receptor 1 for vascular development. J Am Soc Nephrol : 1984–1995, 2016. doi: 10.1681/ASN.2015060610. [DOI] [PMC free article] [PubMed] [Google Scholar]
- 11.Hum S, Rymer C, Schaefer C, Bushnell D, Sims-Lucas S. Ablation of the renal stroma defines its critical role in nephron progenitor and vasculature patterning. PLoS One : e88400, 2014. doi: 10.1371/journal.pone.0088400. [DOI] [PMC free article] [PubMed] [Google Scholar]
- 12.Humphreys BD, Lin SL, Kobayashi A, Hudson TE, Nowlin BT, Bonventre JV, Valerius MT, McMahon AP, Duffield JS. Fate tracing reveals the pericyte and not epithelial origin of myofibroblasts in kidney fibrosis. Am J Pathol : 85–97, 2010. doi: 10.2353/ajpath.2010.090517. [DOI] [PMC free article] [PubMed] [Google Scholar]
- 13.Junttila S, Saarela U, Halt K, Manninen A, Pärssinen H, Lecca MR, Brändli AW, Sims-Lucas S, Skovorodkin I, Vainio SJ. Functional genetic targeting of embryonic kidney progenitor cells ex vivo. J Am Soc Nephrol : 1126–1137, 2015. doi: 10.1681/ASN.2013060584. [DOI] [PMC free article] [PubMed] [Google Scholar]
- 14.Kobayashi A, Mugford JW, Krautzberger AM, Naiman N, Liao J, McMahon AP. Identification of a multipotent self-renewing stromal progenitor population during mammalian kidney organogenesis. Stem Cell Reports : 650–662, 2014. doi: 10.1016/j.stemcr.2014.08.008. [DOI] [PMC free article] [PubMed] [Google Scholar]
- 15.Kramann R, Tanaka M, Humphreys BD. Fluorescence microangiography for quantitative assessment of peritubular capillary changes after AKI in mice. J Am Soc Nephrol : 1924–1931, 2014. doi: 10.1681/ASN.2013101121. [DOI] [PMC free article] [PubMed] [Google Scholar]
- 16.Lancrin C, Sroczynska P, Serrano AG, Gandillet A, Ferreras C, Kouskoff V, Lacaud G. Blood cell generation from the hemangioblast. J Mol Med (Berl) : 167–172, 2010. doi: 10.1007/s00109-009-0554-0. [DOI] [PubMed] [Google Scholar]
- 17.Levinson RS, Batourina E, Choi C, Vorontchikhina M, Kitajewski J, Mendelsohn CL. Foxd1-dependent signals control cellularity in the renal capsule, a structure required for normal renal development. Development : 529–539, 2005. doi: 10.1242/dev.01604. [DOI] [PubMed] [Google Scholar]
- 18.Madisen L, Zwingman TA, Sunkin SM, Oh SW, Zariwala HA, Gu H, Ng LL, Palmiter RD, Hawrylycz MJ, Jones AR, Lein ES, Zeng H. A robust and high-throughput Cre reporting and characterization system for the whole mouse brain. Nat Neurosci : 133–140, 2010. doi: 10.1038/nn.2467. [DOI] [PMC free article] [PubMed] [Google Scholar]
- 19.Maric-Bilkan C, Flynn ER, Chade AR. Microvascular disease precedes the decline in renal function in the streptozotocin-induced diabetic rat. Am J Physiol Renal Physiol : F308–F315, 2012. doi: 10.1152/ajprenal.00421.2011. [DOI] [PMC free article] [PubMed] [Google Scholar]
- 20.Marlier A, Schmidt-Ott KM, Gallagher AR, Barasch J, Karihaloo A. Vegf as an epithelial cell morphogen modulates branching morphogenesis of embryonic kidney by directly acting on the ureteric bud. Mech Dev : 91–98, 2009. doi: 10.1016/j.mod.2008.12.003. [DOI] [PubMed] [Google Scholar]
- 21.Matsui T, Kanai-Azuma M, Hara K, Matoba S, Hiramatsu R, Kawakami H, Kurohmaru M, Koopman P, Kanai Y. Redundant roles of Sox17 and Sox18 in postnatal angiogenesis in mice. J Cell Sci : 3513–3526, 2006. doi: 10.1242/jcs.03081. [DOI] [PubMed] [Google Scholar]
- 22.Pannu N, James M, Hemmelgarn B, Klarenbach S; Alberta Kidney Disease Network . Association between AKI, recovery of renal function, and long-term outcomes after hospital discharge. Clin J Am Soc Nephrol : 194–202, 2013. doi: 10.2215/CJN.06480612. [DOI] [PMC free article] [PubMed] [Google Scholar]
- 23.Phua YL, Chu JY, Marrone AK, Bodnar AJ, Sims-Lucas S, Ho J. Renal stromal miRNAs are required for normal nephrogenesis and glomerular mesangial survival. Physiol Rep : e12537, 2015. doi: 10.14814/phy2.12537. [DOI] [PMC free article] [PubMed] [Google Scholar]
- 24.Phua YL, Gilbert T, Combes A, Wilkinson L, Little MH. Neonatal vascularization and oxygen tension regulate appropriate perinatal renal medulla/papilla maturation. J Pathol : 665–676, 2016. doi: 10.1002/path.4690. [DOI] [PubMed] [Google Scholar]
- 25.Robert B, St John PL, Abrahamson DR. Direct visualization of renal vascular morphogenesis in Flk1 heterozygous mutant mice. Am J Physiol Renal Physiol : F164–F172, 1998. [DOI] [PubMed] [Google Scholar]
- 26.Robert B, St John PL, Hyink DP, Abrahamson DR. Evidence that embryonic kidney cells expressing flk-1 are intrinsic, vasculogenic angioblasts. Am J Physiol Renal Physiol : F744–F753, 1996. [DOI] [PubMed] [Google Scholar]
- 27.Sariola H. Nephron induction. Nephrol Dial Transplant , Suppl 9: 88–90, 2002. doi: 10.1093/ndt/17.suppl_9.88. [DOI] [PubMed] [Google Scholar]
- 28.Saxen L. Organogenesis of the Kidney. Cambridge, UK: Cambridge Univ. Press, 1987. doi: 10.1017/CBO9780511565083. [DOI] [Google Scholar]
- 29.Sequeira Lopez ML, Gomez RA. Development of the renal arterioles. J Am Soc Nephrol : 2156–2165, 2011. doi: 10.1681/ASN.2011080818. [DOI] [PMC free article] [PubMed] [Google Scholar]
- 30.Sequeira-Lopez ML, Lin EE, Li M, Hu Y, Sigmund CD, Gomez RA. The earliest metanephric arteriolar progenitors and their role in kidney vascular development. Am J Physiol Regul Integr Comp Physiol : R138–R149, 2015. doi: 10.1152/ajpregu.00428.2014. [DOI] [PMC free article] [PubMed] [Google Scholar]
- 31.Shalaby F, Rossant J, Yamaguchi TP, Gertsenstein M, Wu XF, Breitman ML, Schuh AC. Failure of blood-island formation and vasculogenesis in Flk-1-deficient mice. Nature : 62–66, 1995. doi: 10.1038/376062a0. [DOI] [PubMed] [Google Scholar]
- 32.Sims-Lucas S. Analysis of 3D branching pattern: hematoxylin and eosin method. Methods Mol Biol : 73–86, 2012. doi: 10.1007/978-1-61779-851-1_7. [DOI] [PubMed] [Google Scholar]
- 33.Sims-Lucas S, Argyropoulos C, Kish K, McHugh K, Bertram JF, Quigley R, Bates CM. Three-dimensional imaging reveals ureteric and mesenchymal defects in Fgfr2-mutant kidneys. J Am Soc Nephrol : 2525–2533, 2009. doi: 10.1681/ASN.2009050532. [DOI] [PMC free article] [PubMed] [Google Scholar]
- 34.Sims-Lucas S, Caruana G, Dowling J, Kett MM, Bertram JF. Augmented and accelerated nephrogenesis in TGF-beta2 heterozygous mutant mice. Pediatr Res : 607–612, 2008. doi: 10.1203/PDR.0b013e31816d9130. [DOI] [PubMed] [Google Scholar]
- 35.Sims-Lucas S, Schaefer C, Bushnell D, Ho J, Logar A, Prochownik E, Gittes G, Bates CM. Endothelial progenitors exist within the kidney and lung mesenchyme. PLoS One : e65993, 2013. doi: 10.1371/journal.pone.0065993. [DOI] [PMC free article] [PubMed] [Google Scholar]
- 36.Song R, Preston G, Khalili A, El-Dahr SS, Yosypiv IV. Angiotensin II regulates growth of the developing papillas ex vivo. Am J Physiol Renal Physiol : F1112–F1120, 2012. doi: 10.1152/ajprenal.00435.2011. [DOI] [PMC free article] [PubMed] [Google Scholar]
- 37.Stolz DB, Sims-Lucas S. Unwrapping the origins and roles of the renal endothelium. Pediatr Nephrol : 865–872, 2015. 10.1007/s00467-014-2798-3. [DOI] [PMC free article] [PubMed] [Google Scholar]
- 38.Yamashita J, Itoh H, Hirashima M, Ogawa M, Nishikawa S, Yurugi T, Naito M, Nakao K, Nishikawa S. Flk1-positive cells derived from embryonic stem cells serve as vascular progenitors. Nature : 92–96, 2000. doi: 10.1038/35040568. [DOI] [PubMed] [Google Scholar]


