

Abstract
Background:
One important example of impaired motor function after surgery is diaphragmatic dysfunction after upper abdominal surgery. In this study, we directly recorded efferent phrenic nerve activity and determined the effect of the upper abdominal incision. We hypothesized that phrenic motor output would be decreased after the upper abdominal incision; we also hypothesized that blocking sensory input from the incision using thoracic epidural anesthesia would diminish this incision-induced change in phrenic motor activity.
Methods:
Efferent phrenic activity was recorded 1 hour to 10 days after upper abdominal incision in urethane-anesthetized rats. Ventilatory parameters were measured in unanesthetized rats using whole-body plethysmography at multiple time points after incision. We then determined the effect of thoracic epidural anesthesia on phrenic nerve activity and ventilatory parameters after incision.
Results:
Phrenic motor output remained reduced by approximately 40% 1 hour and 1 day after incision, but was not different from sham by postoperative day 10. One day after incision (n=9), compared to sham-operated animals (n=7), there was a significant decrease in spike frequency area-under-the-curve [median (interquartile range): 54.0 (48.7 to 84.4) vs. 97.8 (88.7 to 130.3); P = 0.0184], central respiratory rate [0.71 (0.63 to 0.79) vs. 0.86 (0.82 to 0.93)/second; P = 0.0460], and inspiratory-to-expiratory duration ratio [0.46 (0.44 to 0.55) vs. 0.78 (0.72 to 0.93); P = 0.0023]. Unlike humans, a decrease, not an increase, in breathing frequency has been observed after the abdominal incision in whole-body plethysmography. Thoracic epidural anesthesia attenuated the incision-induced changes in phrenic motor output and ventilatory parameters.
Conclusions:
Upper abdominal incision decreased phrenic motor output and ventilatory parameters, and this incision-induced impairment was attenuated by thoracic epidural anesthesia. Our results provide direct evidence that afferent inputs from the upper abdominal incision induce reflex inhibition of phrenic motor activity.
Introduction
The effects of incisional injury on the sensory system have been studied to better understand postoperative pain. Incisions activate and sensitize nociceptors and nociceptive dorsal horn neurons associated with pain-related behaviors and exaggerated responses to various stimuli–hyperalgesia.1–7 The effects of incisional injury on the motor system have not been evaluated despite its clinical relevance.
One important clinically relevant example of impaired motor function after surgery is reduced diaphragmatic function after upper abdominal surgery.8–13 Such impairment contributes to adverse postoperative pulmonary complications, which include atelectasis, pneumonia, increased requirement of supplemental oxygen and the need for mechanical ventilation. Currently, the mechanisms responsible for this inhibitory response remain largely unknown. While several possible factors have been suggested as contributing to reduced diaphragmatic function after surgery, previous studies indicate that neither pain nor the impairment of diaphragmatic contractile properties is likely to be the major causes of postoperative diaphragmatic dysfunction.10,11,14 Instead, injury-induce reflex inhibition of phrenic motor neuron drive has been hypothesized to be a major factor.11–14
Inhibition of phrenic motor output after upper abdominal surgery has been supported only by indirect evidence.11–14 In this study, we directly recorded efferent phrenic nerve activity to determine the effect of upper abdominal incision on the phrenic motor output. To further evaluate this model’s validity and relevance to human pathophysiology, we examined the effect of upper abdominal incision on ventilatory parameters in awake, unrestrained rats using whole-body plethysmography. Finally, we determined the effect of thoracic epidural anesthesia on the efferent phrenic nerve activity and the ventilatory parameters after the upper abdominal incision.
Materials and Methods
Animals
All experimental procedures were approved by The University of Iowa Animal Care and Use Committee, Iowa City, Iowa. The animals were treated in accordance with the Guide for the Care and Use of Laboratory Animals by National Institutes of Health.
One hundred and six adult male and female Sprague–Dawley rats (250 to 300 g; Harlan, Indianapolis, IN, USA) were used. Rats were housed in groups of two in clear plastic cages unless stated otherwise, in temperature controlled (23 ± 2 °C) rooms with a 12-hour light-dark cycle. Food and water were available ad libitum.
Upper abdominal incision
Anesthesia was induced by placing the animal in a sealed plastic box with 5% isoflurane mixed with air. Then anesthesia was maintained at 1.5 to 2% isoflurane in air using a precision vaporizer (Midmark, Lincolnshire, IL, USA), delivered via a nose cone. After induction of anesthesia, ketoprofen (Fort Dodge Animal Health, Fort Dodge, IA, USA) was subcutaneously administered (5 mg/kg). The skin of the abdomen was shaved and prepared with povidone-iodine. Beginning from the costal margin, approximately 1 cm left of the midline, a 3-cm paramedian, vertical incision was made with #11 blade through the abdominal skin, muscle and fascia layers, and peritoneum. The incision was retracted laterally using a self-retaining retractor for 45 minutes. During the retraction period, the surgical field was covered with an occlusive self-adhering plastic drape to minimize heat and fluid loss. Then the wound was irrigated with warm sterile saline. After hemostasis with gentle pressure, the peritoneum and muscle layer was sutured separately using 4–0 monocryl (Ethicon Inc., Somerville, NJ, USA). Skin was closed with surgical skin staples. Throughout the surgery, rectal temperature was maintained at 37±1 °C using a heating pad. Sham-operated animals underwent the same duration of anesthesia, shaving, and skin preparation. After the abdominal incision or sham procedure, animals were allowed to recover in their cages. Twenty-four hours after the abdominal incision, the animals received another subcutaneous dose of ketoprofen (5 mg/kg). The skin staples were removed under isoflurane anesthesia at the end of the postoperative day (POD) 8.
Gastrocnemius incision
Gastrocnemius incision was performed under isoflurane-anesthesia using a method similar to that described previously,15,16 with some modifications. Briefly, subcutaneous ketoprofen (5 mg/kg) was administered following induction of anesthesia. After sterile preparation of the right posterior hindlimb, 3-cm longitudinal incision was made through the skin, underlying fascia, and the gastrocnemius muscle with a # 11 blade. The muscle origin and insertion remained intact. Grasping forceps were then inserted through the incision into one head of the gastrocnemius muscle to divide and retract the muscle. Then the incision was retracted laterally using a self-retaining retractor for 45 minutes. After hemostasis with gentle pressure, incised muscle was sutured using 4–0 monocryl (Ethicon Inc., Somerville, NJ, USA). Skin was closed with surgical skin staples. The animals received another dose of subcutaneous ketoprofen (5 mg/kg) 24 hours after the gastrocnemius incision.
Phrenic nerve recording
Anesthesia was induced by placing the animal in a sealed plastic box with 5% isoflurane mixed with air, and maintained with 1.5 to 2% isoflurane in 50% oxygen in nitrogen delivered via a nose cone. The rats were placed in a supine position, and the ventral side of the neck was shaved and prepared with povidone-iodine. Once a tracheostomy was performed via a midline incision on the ventral surface of the neck, rats were mechanically ventilated with 50% oxygen in nitrogen for the remainder of the experiment, using a small animal ventilator (Inspira Advanced Safety Ventilator; Harvard Apparatus, Holliston, MA, USA). End-tidal carbon dioxide partial pressure was continuously monitored using a micro-sampling carbon dioxide analyzer (MicroCapStar carbon dioxide Analyzer; CWE Inc., Ardmore, PA, USA), and maintained between 38 and 42 mmHg throughout the experiment by modifying the ventilator settings. The vagus nerves were isolated and sectioned bilaterally in the mid-cervical region to prevent entrainment of respiratory output with the ventilator. The external jugular vein was cannulated with PE-50 polyethylene tubing (Intramedic™, BD, Franklin Lakes, NJ, USA) for intravenous administration of drugs. Once intravenous access was obtained, rats were slowly converted to urethane anesthesia. Urethane (Sigma-Aldrich, St. Louis, MO, USA) was freshly prepared for each experiment, by dissolving urethane crystals in saline to yield a final concentration of 20% (w/v). The isoflurane level was gradually decreased and then turned off, while a loading dose of urethane (1.6 g/kg; intravenous) was administered over a 20-minute period. The adequacy of anesthesia was confirmed by a lack of withdrawal response or cardiorespiratory response to toe pinch, and supplemental boluses of urethane (0.1 g/kg) were administered as necessary. After the loading dose of urethane, anesthesia was maintained by an intravenous infusion of urethane (50 mg· kg−1· hour−1). The common carotid artery was cannulated with PE-50 polyethylene tubing for continuous monitoring of the blood pressure. Throughout the experiment, mean arterial blood pressure was maintained above 90 mmHg. Rectal temperature was measured and maintained at 37 ± 1 °C using a servo-controlled heating pad and a radiant heat lamp. Both arterial and venous cannulations were performed on the side opposite to the phrenic nerve that was going to be recorded.
The phrenic nerve was isolated unilaterally within the caudal neck region using a ventral approach, cut distally, and desheathed. The isolated phrenic nerve was then placed on a bipolar platinum/iridium hook electrode (100 μm diameter; FHC, Bowdoin, ME, USA) and submerged in mineral oil. Once the phrenic nerve isolation was completed, the adequacy of anesthesia was reconfirmed, and then animals were paralyzed with rocuronium bromide (2.5 mg/kg; intravenous; Novaplus®, Vizient, Bettendorf, IA, USA) to minimize unsynchronized spontaneous respiratory efforts and to avoid motion artifacts during neural recording. Following paralysis, the adequacy of anesthesia was periodically monitored by observing blood pressure and phrenic responses to toe pinch. Efferent phrenic nerve activity was recorded at least 1 hour after conversion to urethane anesthesia to allow stabilization of blood pressure and phrenic nerve activity. The animals were euthanized at the conclusion of the experiment.
Data were analyzed off-line by an individual blind to the group assignment. Neural signals were amplified (1,000 to 10,000X), and band-pass filtered (100 to 10,000 Hz) by a differential amplifier (DAM50, Harvard Apparatus). The analog outputs were connected to a data sampling system (Power1401 mk2; CED, Cambridge, UK) and analyzed by a signal analysis program (Spike 2; CED). Efferent phrenic nerve activity was quantified from the moving average of the rectified phrenic neurograms. The following parameters were measured: spike frequency area-under-the-curve (AUC), integrated phrenic neurogram (∫Phr) AUC, central respiratory rate (respiratory cycles/minute), and inspiratory-to-expiratory duration ratio (TI:TE) (Figure. 1). For the spike frequency and ∫Phr, both the AUC/respiratory cycle and the AUC/minute were analyzed. These variables were averaged over a 10-minute recording period.
Figure 1.
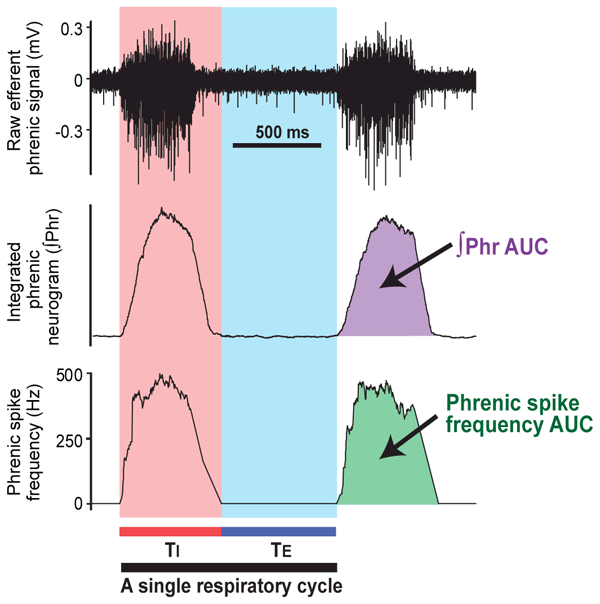
Data analysis of the efferent phrenic nerve activity. The digitalized raw signals (upper panel) were rectified and the integrated by constructing the integrated phrenic neurogram (∫Phr) with a 100-ms time constant (middle panel). The phrenic spike frequency curve was constructed by averaging discharge frequency per 100-ms period (lower panel). Inspiratory duration (TI) was defined as the duration of burst activity on the phrenic spike frequency curve, and expiratory duration (TE) was defined as the period between the end of inspiration and the onset of the subsequent burst. Therefore, the duration of each respiratory cycle was determined by calculating the sum of TI and TE. The following parameters were measured: spike frequency area-under-the-curve (AUC), ∫Phr AUC, central respiratory rate (respiratory cycles/minute), and inspiratory-to-expiratory duration ratio (TI:TE).
Whole-body plethysmography
Ventilatory parameters were measured in unanesthetized and unrestrained rats while breathing room air, using a commercially available whole-body plethysmography system (Buxco, DSI™, St. Paul, MN, USA). Rats were acclimated to the testing environment for at least 3 days before testing. On the second day of acclimation, a temperature transponder (IPTT-300; Bio Medic Data Systems, Seaford, DE, USA) was inserted subcutaneously between the shoulder blades under isoflurane anesthesia. By using these implantable microchip transponders and a wireless scanner (DAS-7009; Bio Medic Data Systems), body temperature could be measured on freely moving animals without disturbing them.
Prior to each measurement, the plethysmography system was calibrated according to the manufacturer’s instructions. The rat was placed in a Plexiglas recording chamber (20-cm diameter; 3.9-liters volume), and allowed to settle for 10 minutes, followed by a 30-minute measurement period during which data were captured in the software database (FinePointe; DSI™). Animals were closely observed during the measurement period, and the data collected during quiet wakefulness, indicated by open eyes with no body movement, were included in the further analysis. Throughout the experiment, the chamber was ventilated by a continuous outflow and inflow of air (2.5 L/minute, respectively) using a bias flow regulator (Buxco, DSI™), to prevent unwanted carbon dioxide or temperature buildup inside the recording chamber. Oxygen and carbon dioxide levels in the chamber outflow were continuously measured using a gas analyzer (GE Healthcare Datex-Ohmeda, Chicago, IL, USA). Temperature and humidity inside the Plexiglas recording chamber were measured continuously, and the temperature was controlled with maximal fluctuation less than 1 °C using a heat lamp. Body temperature was wirelessly measured as mentioned above, immediately before and after the recording session. The chamber temperature, chamber humidity, body temperature, and body weight were entered into the software to calculate ventilatory parameters using the Drorbaugh and Fenn equation.17
Raw data were analyzed off-line by an individual blind to the group assignment. All data segments of greater than 10-second duration that did not contain sighs, coughs, sniffing, or movement artifacts were selected and averaged from the ventilatory data collected during the quiet awake state. The measured parameters included breathing frequency, tidal volume, minute ventilation, inspiratory time, expiratory time, and expiratory flow at 50% expired volume (EF50). Minute ventilation and tidal volume values were normalized for body weight.
Epidural Catheterization
The epidural catheter construction was modified from previous studies.18,19 The epidural catheter was made of a 2-cm segment of the 32-gauge polyurethane catheter (OD 0.272 mm; ID 0.127 mm; ReCathCo, Allison Park, PA, USA) that was heat-welded to a 13-cm piece of PE-10 polyethylene tubing (OD 0.61mm; ID 0.28 mm; Intramedic™). The dead space of the assembled catheter was 9.5 to 9.9 μl. The catheters were prepared and sterilized before insertion.
In anesthetized rats, the dorsal thoracolumbar region was shaved, made kyphotic, and sterilized with povidone-iodine. A 2-cm longitudinal, midline incision was made at the level of T13 and L1 spinous processes. The paraspinal musculature and fascia were dissected and retracted to expose the supraspinous ligament, which was carefully cut. The spinous processes of T13 and L1 were removed to facilitate epidural catheter insertion. The 32-gauge polyurethane catheter portion, reinforced with a polytetrafluoroethylene-coated stainless steel stylet (75-μm diameter; ReCathCo), was introduced into the epidural space through a small hole drilled between T13 and L1 intervertebral space using an electric drill. To place its tip around T9 and T10 level, the epidural catheter was gently inserted 2 cm toward the cephalad direction with the aid of a dissecting microscope, and the stylet was withdrawn. The catheter was then fixed to the T13 vertebral body, and sutured to the fascia. The catheter was tunneled under the skin, and 3 cm of the distal end was exteriorized at the posterior cervical region. The catheter was flushed with phosphate-buffered saline (PBS; Gibco, Grand Island, NY, USA) and sealed using heat. All incisions were sutured and the animals were allowed to recover from the procedure for at least 2 or 3 days before the experiment. Following insertion of the epidural catheter, rats were singly housed in individual cages to minimize potential catheter dislodgement or damage to the external portion of the catheter by the cage mate.
Experimental protocols
In order to avoid the effect of circadian rhythm, phrenic recording experiments were performed between 10 a.m. and 2 p.m., and whole-body plethysmography experiments were performed between noon and 2 p.m.
Protocol A (Figure 2): The short-term effect of upper abdominal incision vs. sham incision on efferent phrenic nerve activity, measured 1 hour after the incision.
Figure 2.
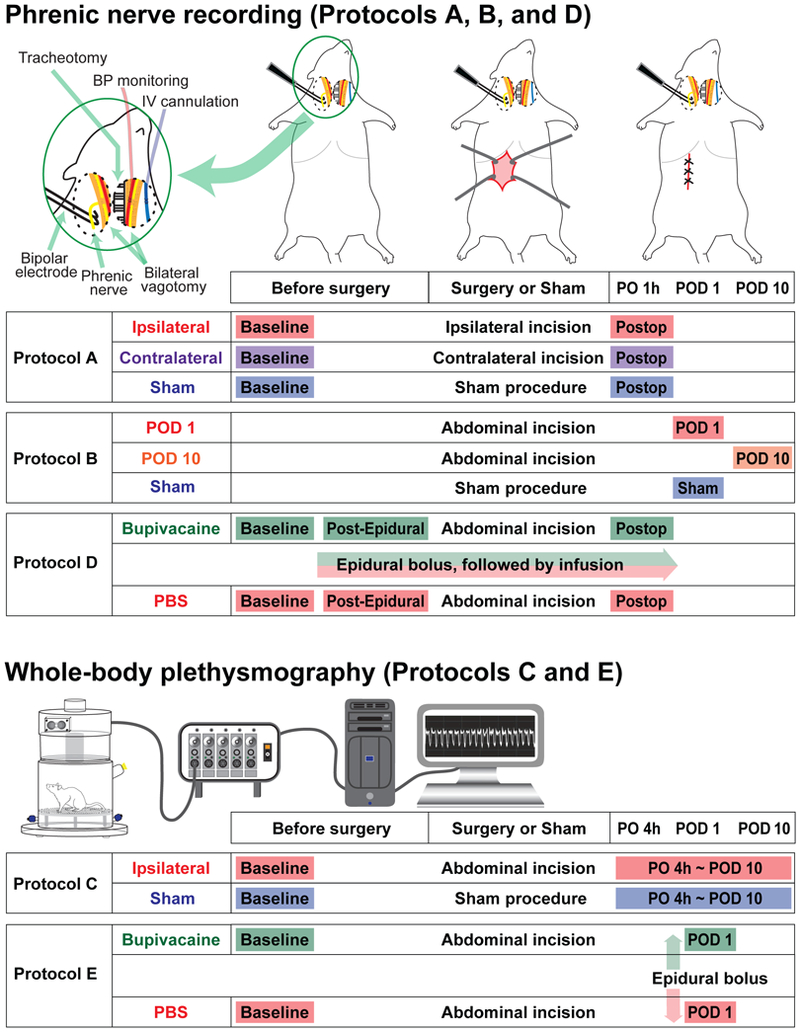
Experimental protocols for the in vivo efferent phrenic nerve recording and whole-body plethysmography. For the Protocols A, B, and D, efferent phrenic nerve activity was recorded in the urethane-anesthetized, vagotomized, paralyzed and mechanically ventilated rats, using a bipolar hook electrode. The inset in the top left corner shows a schematic diagram of the preparation. In the Protocol A, efferent phrenic nerve activity was recorded before and 1 hour after the upper abdominal incision or sham incision. In the “Ipsilateral” group, the phrenic nerves on the same side of the incision were recorded, and in the “Contralateral” group, the phrenic nerves on the opposite side were recorded. In the Protocol B, phrenic nerve activity was recorded 1 day or 10 days after the upper abdominal incision, and compared to the sham incision group. In the Protocol D, the effect of epidural bupivacaine or PBS administered before incision on the phrenic nerve activity was evaluated. The nerve activity was recorded before and after the upper abdominal incision. For the Protocol C and E, ventilatory parameters in the unanesthetized and unrestrained rats were measured using a whole-body plethysmography system. In the Protocol C, the measurements were performed before and at multiple time points after the upper abdominal incision or sham incision. In the Protocol E, the effect of epidural bupivacaine or PBS administered 1 day after the incision on ventilatory parameters was evaluated. More detailed description of the experimental protocols can be found in the Material and Methods section. PO 1 h = 1 hour postoperatively; POD = postoperative day; Postop = postoperative period; Post-Epidural = Post-epidural injection; PO 4 h = 4 hours postoperatively.
Under urethane anesthesia, the phrenic nerve was isolated as described above, and baseline efferent phrenic nerve activity was recorded. Immediately after the baseline recording, the rats underwent upper abdominal incision or sham incision. Phrenic nerve activity was recorded 1 hour after completion of the incision. Rats were randomly assigned to one of the following three groups: (i) in the “Ipsilateral” group, the left phrenic nerve, which was ipsilateral to the abdominal incision, was recorded; (ii) in the “Contralateral” group, the right phrenic nerve, which was contralateral to the abdominal incision, was recorded; (iii) in the “Sham” group, the left phrenic nerve was recorded and the animals underwent the sham incision.
Protocol B (Figure 2): Efferent phrenic nerve activity measured 1 day or 10 days after the upper abdominal incision.
Rats were randomly assigned to three groups, and underwent upper abdominal incision or sham incision. Efferent nerve activity was recorded from the left phrenic nerve 1 day after the abdominal incision (“POD 1” group), 10 days after the abdominal incision (“POD 10” group), or 1 day after the sham incision (“Sham” group)
Protocol C (Figure 2): The effect of upper abdominal incision (“Incision” group) vs. sham incision (“Sham” group) on ventilatory parameters.
Ventilatory parameters were measured using the whole-body plethysmography system as described above. Rats were randomly assigned to two groups. Using a repeated-measure design, rats were studied 1 day before (baseline), and 4 hours, 1, 2, 4, 7, and 10 days after the upper abdominal incision or sham incision.
In separate groups of animals, ventilatory parameters were measured after the gastrocnemius incision using the whole-body plethysmography system. This protocol was performed as a control experiment to aid in distinguishing the abdominal incision-specific changes in ventilatory parameters from non-specific or systemic effects of the incisions. Rats were randomly assigned to two groups. Using a repeated-measure design, rats were studied 1 day before (baseline), and 4 hours and 1 day after the gastrocnemius incision or sham incision.
Protocol D (Figure 2): The effect of epidural bupivacaine (“Bupivacaine” group) vs. PBS (“PBS” group) on efferent phrenic nerve activity before and after the upper abdominal incision.
In this protocol, thoracic epidural anesthesia using bupivacaine was used to block the afferent signals from upper abdomen. Rats were randomly assigned to two groups. Rats underwent epidural catheterization. After 2 or 3 days, the animals were prepared for the recording of the left phrenic nerve and baseline activity was recorded. Then 40 μl of 0.5% bupivacaine (Hospira, Lake Forest, IL, USA) was injected via the epidural catheter, followed by continuous infusion at a rate of 15 μl/hour. This initial bolus volume was selected based on our preliminary study indicating that 40 μl of methylene blue dye injected into the epidural catheter achieved the median cephalad and caudad spread to T4 and T13 levels, respectively. The control group received an epidural bolus followed by infusion of PBS. Ten minutes after completion of the epidural bolus, post-epidural, pre-incision phrenic nerve activity was recorded. Then rats underwent upper abdominal incision, and phrenic nerve activity was recorded 1 hour after completion of the incision. At the end of the protocol, rats were euthanized, and the catheter position was verified by injection of methylene blue dye followed by spinal dissection.
Protocol E (Figure 2): The effect of epidural bupivacaine (“Bupivacaine” group) vs. PBS (“PBS” group) on ventilatory parameters after the upper abdominal incision.
In this protocol, thoracic epidural anesthesia using bupivacaine was used to block the afferent signals from upper abdominal incision. Rats underwent epidural catheterization. Baseline ventilatory parameters were recorded with the whole-body plethysmography system 3 days after placement of epidural catheter. Animals underwent upper abdominal incision on the same day of the baseline measurement. On POD 1, 40 μl of 0.5% bupivacaine or PBS was injected via the epidural catheter. The person performing the test was blind to drug injected. Five minutes after completion of the epidural injection, the rat was placed into the recording chamber of the whole-body plethysmography system. Then the rat was allowed to acclimate for 10 minutes inside the chamber, and ventilatory parameters were recorded for 30 minutes. At the end of the protocol, rats were euthanized, and the catheter position was verified by injection of methylene blue dye followed by spinal dissection.
Statistics
Based on our experience in the preliminary studies, we collected data from seven to ten animals per group. No a priori statistical power calculation was conducted. All data sets were tested for normality of distribution by Kolmogorov Smirnov tests. When the repeated-measure designs were used, two-way ANOVA with repeated measures on one factor was used to analyze the phrenic nerve activity (Protocol A and D) and ventilatory parameters (Protocol C and E); significant main effects or interactions were followed by Sidak’s post hoc multiple comparison tests. Comparisons of the phrenic nerve activity among POD 1, POD 10, and the sham incision groups (Protocol B) were made by Kruskal-Wallis test followed by post hoc Dunn’s multiple comparison tests. For Protocol A, C, D, and E, data were normalized to baseline for each parameter. Data are presented as the mean ± standard deviation (SD) or median with interquartile range. Subgroup analyses by sex were performed using Friedman test or Kruskal-Wallis test followed by post hoc Dunn’s tests. P < 0.05 was considered significant. Statistical analyses were performed using Prism 5.04 (Graphpad Software, Inc., San Diego, CA, USA).
Results
A total of 126 rats were used in this study, and 38 of these animals underwent epidural catheterization. One hundred and twelve animals were included in the final data analysis; 63 rats were used for the phrenic nerve recording, and 49 rats for the whole-body plethysmography experiments. Fourteen rats were excluded from the study due to the following reasons; unexpected death during surgery or phrenic nerve recording (5 rats), neurologic deficit after epidural catheter placement (1 rat), improper epidural catheter position (for example, intrathecal or intramuscular; 5 rats), or technical problems with the phrenic nerve recording (3 rats). In the present study, no diagnostic tools were used to specifically detect any signs of pulmonary complications. However, the animals’ general well-being and behavior were evaluated through daily monitoring, and none of the animals exhibited any signs of stress or illness after the upper abdominal incision throughout the experimental period.
Protocol A: The short-term effect of upper abdominal incision vs. sham incision on efferent phrenic nerve activity (Figure 3)
Figure 3.
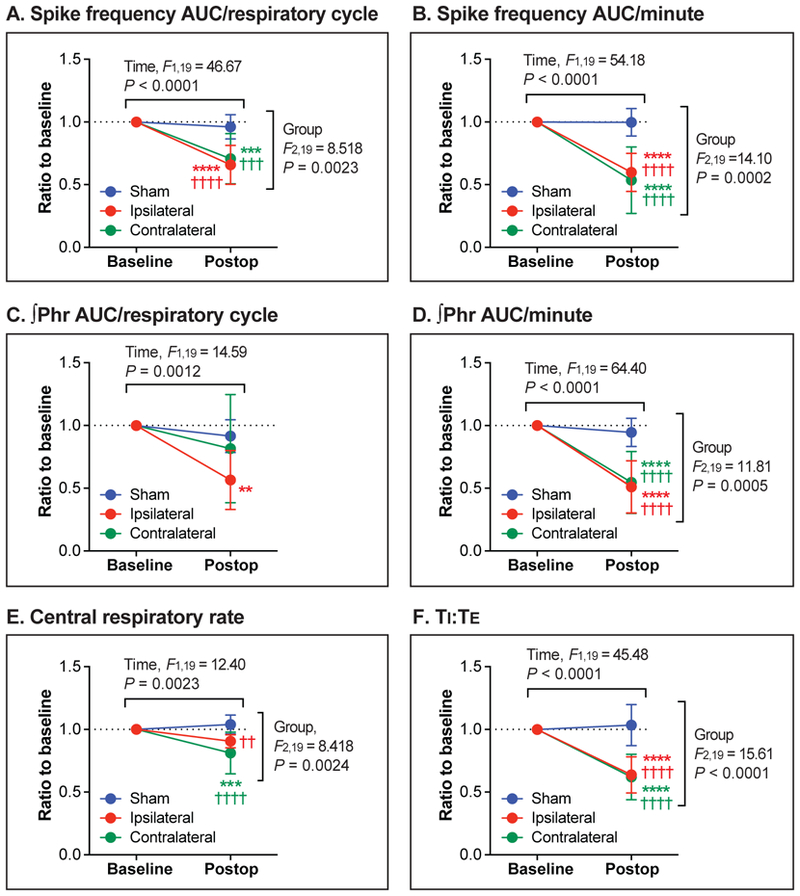
The short-term effect of upper abdominal incision vs. sham incision on efferent phrenic nerve activity (Protocol A). (A-F): One hour after the upper abdominal incision (Postop), spike frequency area-under-the-curve (AUC)/respiratory cycle (A), spike frequency AUC/minute (B), integrated phrenic neurogram (∫Phr) AUC/respiratory cycle (C), ∫Phr AUC/minute (D), central respiratory rate (E), and inspiratory-to-expiratory duration ratio (TI:TE; F) significantly decreased compared with baseline. The “Ipsilateral” (N = 7) and the “Contralateral” group (N = 7) respectively represent nerve activity recorded from the phrenic nerves on the same side and the opposite side of the abdominal incision. The control group underwent the sham incision (“Sham” group, N = 8). Data are presented as mean ± SD. **P < 0.01; ***P < 0.001; ****P < 0.0001 vs. Baseline, and ††P < 0.01; †††P < 0.001; ††††P < 0.0001 vs. Sham by two-way ANOVA with repeated measured in one factor, followed by Sidak’s multiple comparison tests.
For the spike frequency AUC/respiratory cycle (Figure 3A), the Ipsilateral (P < 0.0001) and the Contralateral groups (P = 0.0002), but not the Sham group (P = 0.8628), showed a significant difference between before and 1 hour after the incision. The baseline-normalized spike frequency AUC/respiratory cycle values of the Ipsilateral and the Contralateral groups were significantly lower compared with the Sham group (P < 0.0001 and P = 0.0002, respectively).
As shown in Figure 3B, there was a significant decrease in the spike frequency AUC/minute from baseline after the ipsilateral (P < 0.0001) and contralateral incision (P < 0.0001), but not after the sham incision (P > 0.9999). The baseline-normalized spike frequency AUC/minute values of the Ipsilateral and the Contralateral groups were significantly lower than that of the Sham group (P < 0.0001 and P < 0.0001, respectively).
∫Phr AUC/respiratory cycle after the incision was significantly lower compared with baseline in the Ipsilateral group (P = 0.0023), but not in the Contralateral (P = 0.2858) and the Sham groups (P = 0.7982) (Figure 3C). For the ∫Phr AUC/minute (Figure 3D), there were significant differences between before and after the incision in the Ipsilateral (P < 0.0001) and the Contralateral groups (P < 0.0001), but not in the Sham group (P = 0.8203). Baseline-normalized ∫Phr AUC/minute values of the Ipsilateral and the Contralateral groups were significantly lower compared with the Sham group (P < 0.0001 and P < 0.0001, respectively).
For central respiratory rate (Figure 3E), there was a significant difference between before and after the incision in the Contralateral group (P = 0.0006). The baseline-normalized respiratory rate values of the Ipsilateral and the Contralateral groups were significantly lower compared with the Sham group (P = 0.0048 and P < 0.0001, respectively)
There was a significant decrease in TI:TE from baseline after the ipsilateral (P < 0.0001) and contralateral incision (P < 0.0001), but not after the sham incision (P = 0.9155) (Figure 3F). The baseline-normalized TI:TE values of the Ipsilateral and the Contralateral groups were significantly lower than the Sham group (P < 0.0001 and P < 0.0001, respectively).
In summary, 1 hour after ipsilateral or contralateral upper abdominal incision, phrenic motor output was reduced by approximately 40%. This was based on spike frequency AUC, ∫Phr AUC, central respiratory rate, and TI:TE. Sham incision had no effect on these parameters. Raw (non-normalized) data for each parameter are provided in Supplementary Figure S1.
Protocol B: Efferent phrenic nerve activity measured 1 day or 10 days after the upper abdominal incision (Figure 4)
Figure 4.
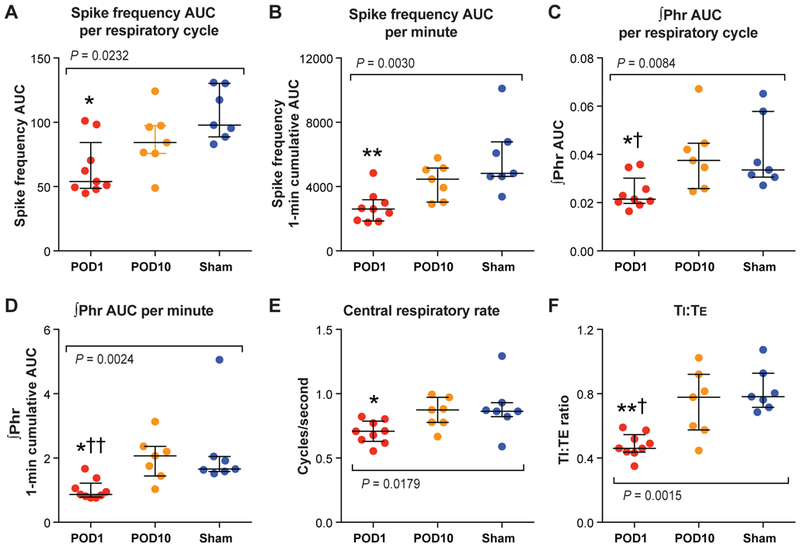
The efferent phrenic nerve activity measured 1 day or 10 days after the upper abdominal incision (Protocol B). (A-F): A significant decrease in spike frequency area-under-the-curve (AUC)/respiratory cycle (A), spike frequency AUC/minute (B), integrated phrenic neurogram (∫Phr) AUC/respiratory cycle (C), ∫Phr AUC/minute (D), central respiratory rate (E), and inspiratory-to-expiratory duration ratio (TI:TE; F) was observed 1 day after the abdominal incision (“POD 1” group, N = 9), compared with the “Sham” group (N = 7). The median values of the “POD 10” group (N = 7) were not different than the Sham group. The colored dots represent the individual data points, horizontal lines represent median, and error bars represent interquartile range. *P < 0.05; **P < 0.01 vs. Sham, and †P < 0.05; ††P < 0.01 vs. POD 10 by Kruskal-Wallis test followed by post hoc Dunn’s multiple comparison tests. POD = postoperative day.
Recording data from the POD 1, POD 10 and the Sham groups were compared. The median spike frequency AUC/respiratory cycle of the POD 1 group was significantly lower than that of the Sham group (P = 0.0184); on the other hand, there was no statistical difference between the POD 10 and the Sham groups (P = 0.5409) (Figure 4A). The median spike frequency AUC/minute of the POD 1 group, but not the POD 10 group, was lower than the Sham group (P = 0.0031 and P > 0.9999, respectively) (Figure 4B).
As shown in Figure 4C, the median ∫Phr AUC/respiratory cycle of the POD 1 group was significantly lower than that of the Sham group (P = 0.0360) or the POD 10 group (P = 0.0195); there was no difference between the POD 10 and the Sham groups (P > 0.9999). Similarly, the median ∫Phr AUC/minute of the POD 1 group was significantly lower compared with the Sham group (P = 0.0158) or the POD 10 group (P = 0.0061); the median ∫Phr AUC/minute values were not significantly different between the POD 10 and the Sham groups (P > 0.9999) (Figure 4D).
The median central respiratory rate of the POD 1 group, but not the POD 10 group, was significantly lower than that of the Sham group (P = 0.0460 and P > 0.9999, respectively) (Figure 4E).
The median TI:TE of the POD 1 group was significantly lower than that of the Sham group (vs. P = 0.0023) or the POD 10 group (P = 0.0268); there was no difference between the median TI:TE of the POD 10 and the Sham groups (P > 0.9999) (Figure 4F).
In summary, 1 day after upper abdominal incision, phrenic motor output remained reduced, similar to that observed 1 hour after incision. This was based on spike frequency AUC, ∫Phr AUC, central respiratory rate, and TI:TE. Phrenic nerve activity recorded 10 days after upper abdominal incision was not different compared with the Sham group demonstrating recovery.
Protocol C: The effect of upper abdominal incision vs. sham incision on ventilatory parameters (Figure 5)
Figure 5.
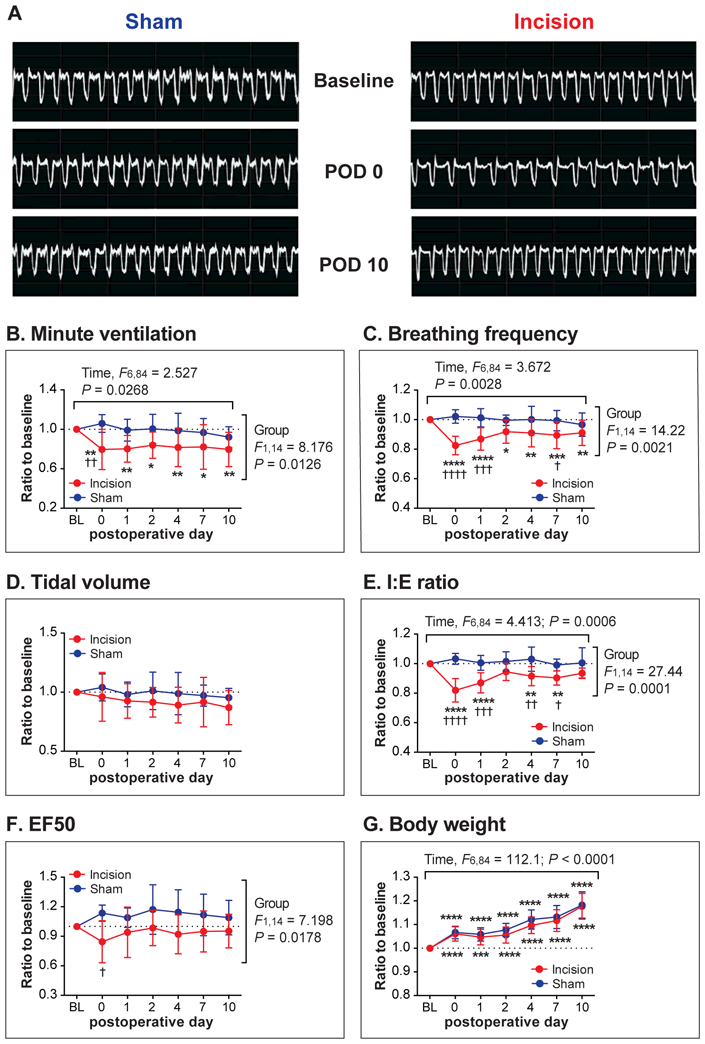
The effect of upper abdominal incision (“Incision” group) vs. sham incision (“Sham” group) on ventilatory parameters (Protocol C). (A): Sample whole-body plethysmography recordings from the Sham and the Incision group at baseline, on postoperative day (POD) 0, and POD 10. (B-F): Ventilatory parameters measured using the whole-body plethysmography system included minute ventilation (B), breathing frequency (C), tidal volume (D), inspiratory-to-expiratory time ratio (I:E ratio; E), and expiratory flow at 50% expired volume (EF50; F). A significant decrease in minute ventilation (B), breathing frequency (C), and I:E ratio (E) was observed for several days after the abdominal incision. (G): There was no difference in body weight between the Incision and the Sham groups. Data are presented as mean ± SD. N = 8 per group. *P < 0.05; **P < 0.01; ***P < 0.001; ****P < 0.0001 vs. Baseline, and †P < 0.05; ††P < 0.01 †††P < 0.001; ††††P < 0.0001 vs. Sham by two-way ANOVA with repeated measured in one factor, followed by Sidak’s multiple comparison tests. BL = baseline.
The example traces in Figure 5A show the recordings of two rats, one from the Sham group (left panels) and one from the Incision group (right panels).
The mean minute ventilation values on POD 0 though POD 10 were significantly lower than baseline in the Incision group (POD 0: P = 0.0024; POD 1: P = 0.0035; POD 2: P = 0.0280; POD 4: P = 0.0079; POD 7: P = 0.0105; POD 10: P = 0.0023), but not in the Sham group (Figure 5B). The baseline-normalized minute ventilation value of the Incision group was significantly lower than that of the Sham group on POD 0 (P = 0.0037).
For breathing frequency (Figure 5C), the mean values of the Incision group on POD 0 through POD 10 were significantly lower compared with baseline (POD 0: P < 0.0001; POD 1: P < 0.0001; POD 2: P = 0.0108; POD 4: P = 0.0037; POD 7: P = 0.0004; POD 10: P = 0.0042); the mean values of the Incision group were significantly lower than those of the Sham group on POD 0, 1, and 7 (P < 0.0001, P = 0.0004 and P = 0.0337, respectively).
There was no significant main effect or interaction for tidal volume (Figure 5D). The mean I:E (inspiratory-to-expiratory time) ratio values of the Incision group, but not the Sham group, were significantly lower compared with baseline, on POD 0 through POD 7 (POD 0: P < 0.0001; POD 1: P < 0.0001; POD 4: P = 0.0060; POD 7: P = 0.0011) (Figure 5E). The mean values of the Incision group were significantly lower than those of the Sham group on POD 0 through POD 7 (POD 0: P < 0.0001; POD 1: P = 0.0001; POD 4: P = 0.0014; POD 7: P = 0.0273).
The mean EF50 of the Incision group (Figure 5F) was significantly lower than that of the Sham group on POD 0 (P = 0.0131).
Since minute ventilation and tidal volume values were normalized for body weight, we also analyzed body weight throughout the testing period (Figure 5G). There were significant main effects of time (P < 0.0001) without any significant main effect of group or interaction. The post hoc tests indicated that body weight values on POD 0 through POD 10 were significantly greater compared with baseline in both the Incision and Sham groups. These data indicated that the Incision and Sham groups exhibited similar weight gain throughout the testing period, demonstrating that the differences found between the Incision and Sham groups in minute ventilation data (Figure 5B) were unlikely due to different weight gain profiles between the groups.
In summary, several ventilator parameters decreased to approximately 80% of baseline after upper abdominal incision and there were no changes in the Sham group. This was based on minute ventilation, breathing frequency, and I:E ratio. In general, recovery was evident by POD 10. Thus, phrenic motor neuron output data are in general agreement with the whole-body plethysmography measurements with marked effects on POD 0 and 1 and recovery by POD 10. Raw (non-normalized) data for each parameter are provided in Supplementary Figure S2.
Four hours after the gastrocnemius incision (POD 0), the mean values of minute ventilation and EF50 of the G-Incision group were significantly greater than those of the Sham group (P = 0.0259 and P = 0.0392, respectively; Figure 6). No significant difference in these parameters was observed on POD 1. Breathing frequency, tidal volume, and I:E values of the G-Incision group were not different compared with the Sham group throughout the experimental period.
Figure 6.
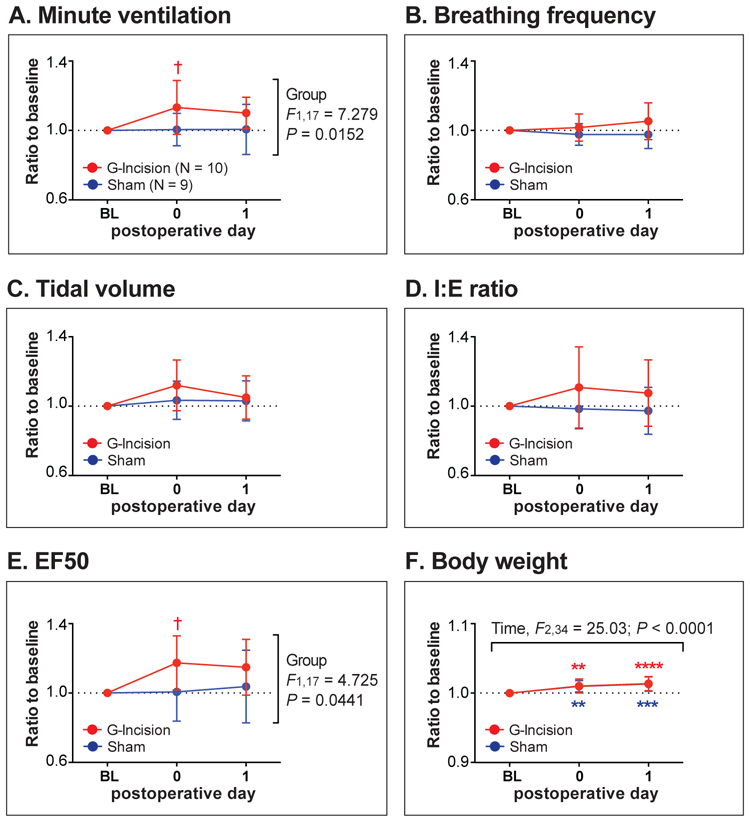
Ventilatory parameters after gastrocnemius incision (“G-Incision” group) vs. sham incision (“Sham” group). (A-E): Ventilatory parameters measured using the whole-body plethysmography system included minute ventilation (A), breathing frequency (B), tidal volume (C), inspiratory-to-expiratory time ratio (I:E ratio; D), and expiratory flow at 50% expired volume (EF50; E). (F): There was no difference in body weight between the Incision and the Sham groups. Data are presented as mean ± SD. Sample sizes are given in (A). **P < 0.01; ***P < 0.001; ****P < 0.0001 vs. Baseline, and †P < 0.05 vs. Sham by two-way ANOVA with repeated measured in one factor, followed by Sidak’s multiple comparison tests. BL = baseline.
Protocol D: The effect of epidural bupivacaine vs. PBS on efferent phrenic nerve activity before and after the upper abdominal incision (Figure 7)
Figure 7.
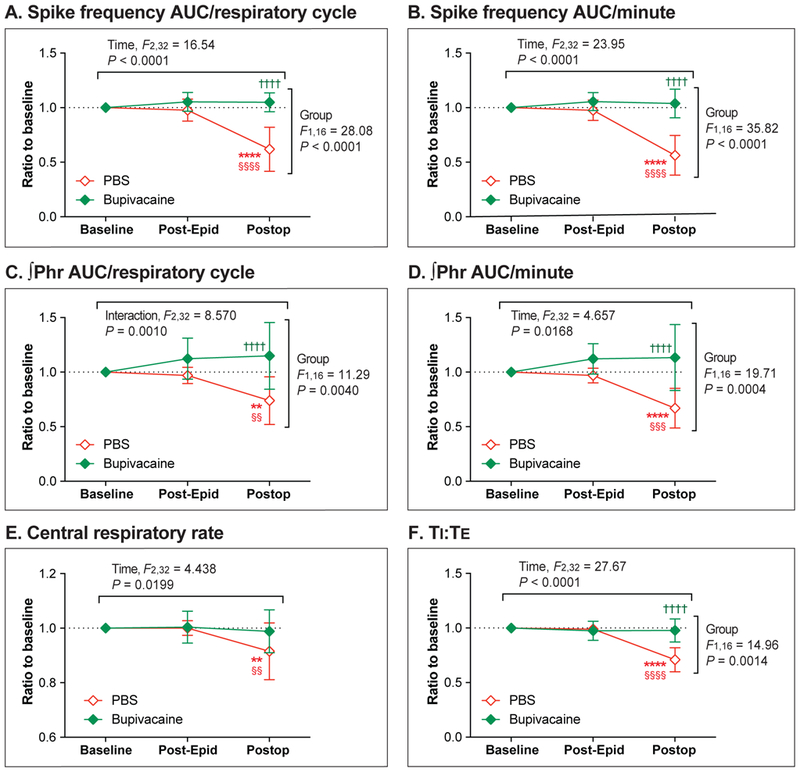
The effect of epidural bupivacaine (“Bupivacaine” group, N = 8) vs. PBS (“PBS” group, N = 10) on efferent phrenic nerve activity before and after the upper abdominal incision (Protocol D). (A-F): Neither epidural PBS nor bupivacaine had any effect on baseline phrenic nerve activity (Post-Epidural). After the abdominal incision (Postop), a significant decrease in spike frequency area-under-the-curve (ACU)/respiratory cycle (A), spike frequency AUC/minute (B), integrated phrenic neurogram (∫Phr) AUC/respiratory cycle (C), ∫Phr AUC/minute (D), central respiratory rate (E), and inspiratory-to-expiratory duration ratio (TI:TE; F) was observed in the PBS (control) group, but not in the Bupivacaine group. Data are presented as mean ± SD. **P < 0.01; ****P < 0.0001 vs. Baseline, §§P < 0.01; §§§P < 0.001; §§§§P < 0.0001 vs. Post-Epidural, and ††††P < 0.0001 vs. PBS by two-way ANOVA with repeated measured in one factor, followed by Sidak’s multiple comparison tests. Post-Epidural = Post-epidural injection.
The mean spike frequency AUC/respiratory cycle (Figure 7A) was significantly lower than baseline in the PBS group 1 hour after the abdominal incision (P < 0.0001); this decrease was prevented by epidural administration of bupivacaine (P = 0.7194). One hour after the incision, the mean spike frequency AUC/respiratory cycle of the Bupivacaine group was significantly greater than that of the PBS group (P < 0.0001).
Spike frequency AUC/minute (Figure 7B) decreased from baseline after the incision in the PBS group (P < 0.0001), but not in the Bupivacaine group (P = 0.8413). After the incision, the mean spike frequency AUC/minute of the Bupivacaine group was significantly greater than that of the PBS group (P < 0.0001).
The mean ∫Phr AUC/respiratory cycle after the incision was significantly lower compared with the baseline in the PBS group (P = 0.0013), but not in the Bupivacaine group (P = 0.1544) (Figure 7C). The mean ∫Phr AUC/respiratory cycle of the Bupivacaine group was significantly greater than that of the PBS group (P < 0.0001) after the incision.
The mean ∫Phr AUC/minute significantly decreased from baseline after the incision in the PBS group (P < 0.0001), but not in the Bupivacaine group (P = 0.1382) (Figure 7D). One hour after the incision, the mean ∫Phr AUC/minute of the Bupivacaine group was significantly greater than that of the PBS group (P < 0.0001).
As shown in Figure 7E, the mean central respiratory rate after the incision was significantly lower than baseline in the PBS group (P = 0.0044); on the other hand, central respiratory rate after the incision was not significantly different from baseline in the Bupivacaine group (P = 0.9016).
The baseline-normalized TI:TE value after the incision was significantly lower than baseline in the PBS group (P < 0.0001) but not in the Bupivacaine group (P = 0.7683) (Figure 7F). After the incision, the mean TI:TE of the Bupivacaine group was significantly greater than that of the PBS group (P < 0.0001).
In summary, the epidural injection of bupivacaine or PBS (“Post-Epidural” in Figure 7) did not affect the baseline parameters analyzed. Thoracic epidural anesthesia with 0.5% bupivacaine prevented the decrease in phrenic motor output after upper abdominal incision. Of note, the acute change in normalized phrenic motor output 1 hour after incision in the PBS group (Figure 7; Protocol D) was similar to those recorded in Protocol A (Fig. 3). Raw (non-normalized) data for each parameter are provided in Supplementary Figure S3. Data from the two rats with the improperly positioned epidural catheters are shown in Supplementary Figure S4.
Protocol E: The effect of epidural bupivacaine vs. PBS on ventilatory parameters after the upper abdominal incision (Figure 8)
Figure 8.
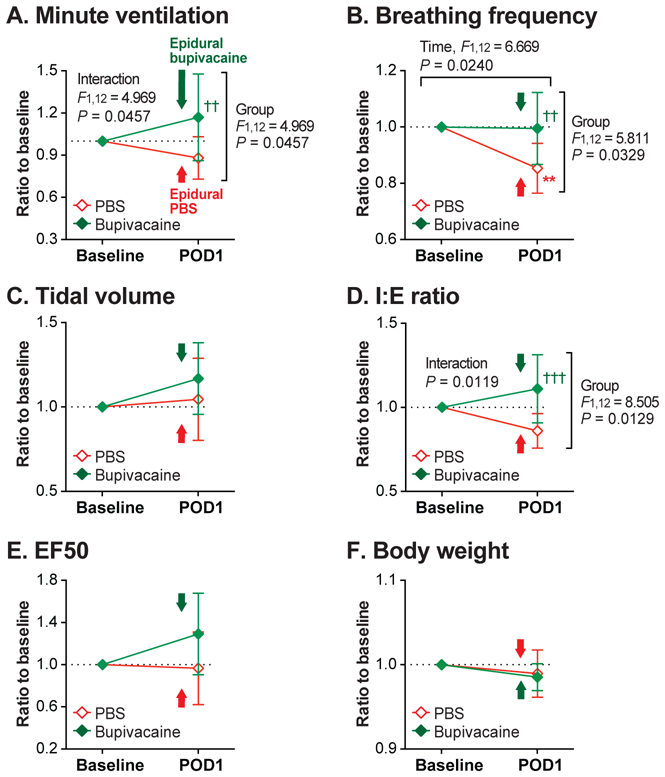
The effect of epidural bupivacaine (“Bupivacaine” group) vs. PBS (“PBS” group) administered 1 day after the upper abdominal incision on ventilatory parameters (Protocol E). (A-E): Ventilatory parameters, including minute ventilation (A), breathing frequency (B), tidal volume (C), inspiratory-to-expiratory time ratio (I:E ratio; D), and expiratory flow at 50% expired volume (EF50; E) were measured before (Baseline) and 1 day after the abdominal incision (POD 1). On POD 1, bupivacaine or PBS was epidurally injected 15 minutes prior to recording, as indicated by the arrows in the graphs. On POD 1, minute ventilation (A), breathing frequency (B), and I:E ratio (D) of the Bupivacaine group was significantly greater than that of the PBS group. (F): There was no difference in body weight between the Bupivacaine and the PBS groups. Data are presented as mean ± SD. N = 7 per group. **P < 0.01 vs. Baseline, and ††P < 0.01; †††P < 0.001 vs. PBS by two-way ANOVA with repeated measured in one factor, followed by Sidak’s multiple comparison tests.
Minute ventilation of the Bupivacaine group was significantly greater than that of the PBS group on POD 1 (P = 0.0086) (Figure 8A). While the mean breathing frequency of the PBS group decreased from baseline on POD1 (P = 0.0083), the Bupivacaine group did not change before and after the incision (P = 0.9910) (Figure 8B). On POD 1, baseline-normalized breathing frequency of the Bupivacaine group was significantly greater than that of the PBS group (P = 0.0046).
There was no significant main effect or interaction for tidal volume (Figure 8C). The mean I:E ratio (Figure 8D) of the Bupivacaine group was significantly greater than that of the PBS group on POD 1 (P = 0.0008). There was no significant main effect or interaction for EF50 (Figure 8E).
Since minute ventilation and tidal volume values were normalized for body weight, we analyzed body weight throughout the testing period (Figure 8F). There was no significant difference in body weight between the groups or between before and after the incision. Therefore, the difference found between the Bupivacaine and the PBS groups in minute ventilation data (Figure 8A) was unlikely due to different weight gain profiles between the groups.
In summary, thoracic epidural anesthesia with 0.5% bupivacaine administered 1 day after upper abdominal incision eliminated the decrease in minute ventilation, breathing frequency and I:E ratio caused by the surgery. Raw (non-normalized) data for each parameter are provided in Supplementary Figure S5. Data from the three rats with the improperly positioned epidural catheters are shown in Supplementary Figure S6.
Subgroup analyses by sex
While interpretation is limited by the small sample size (3 – 5 animals per group), subgroup analyses did not indicate any obvious sex-specific differences (Supplementary Figures S7–S10). Decreased phrenic motor output and impaired ventilatory parameters after the upper abdominal incision were observed in both male and female subjects.
Discussion
The results of the present study provide direct evidence that afferent inputs from an upper abdominal incision induce reflex inhibition of phrenic motor activity. Upper abdominal incision also reduces ventilatory parameters measured by the whole-body plethysmography system. The effects of upper abdominal incision on both phrenic nerve recordings and ventilatory parameters are greatest on POD 0 and 1 and improve through POD 10.
Efferent phrenic nerve activity and ventilation
Our results indicate that decreased efferent phrenic nerve activity after upper abdominal incision was not accompanied by any increase in the central respiratory rate, which theoretically could have exerted a somewhat compensatory effect. Rather, upper abdominal incision caused a significant decrease in the central respiratory rate as well, further contributing to the decrease in the spike frequency AUC/minute and the ∫Phr AUC/minute. Moreover, TI:TE was significantly decreased after incision, limiting the duration of the phrenic inspiratory burst.
In accordance with decreased TI:TE observed in the phrenic nerve activity, I:E ratio measured using the whole-body plethysmography system was significantly decreased from baseline after the upper abdominal incision. Tidal volume of the Incision group was not different from the Sham group, indicating that the postoperative decrease in minute ventilation was primarily due to the decrease in breathing frequency, in accordance with decreased central respiratory rate.
The effects of incision on nerve recordings and ventilatory parameters were consistent between the protocols in the present study. Ventilatory parameters measured after laparotomy in the unanesthetized rats are likely to be affected by various factors, such as diaphragmatic function, function of the other thoracoabdominal respiratory muscles, upper airway patency, and the presence of pain. Given that phrenic nerve is the sole motor supply to the diaphragm, the reduced phrenic activity by upper abdominal incision will translate to postoperative diaphragmatic dysfunction and therefore to ventilatory impairment, since the diaphragm contributes 70 to 90% to tidal breathing.20,21
Previous preclinical and clinical studies
Reduced phrenic motor activity after upper abdominal incision observed in the present study is in line with previous animal studies demonstrating diaphragmatic dysfunction after abdominal surgery.14,22,23 Impaired diaphragmatic function after upper abdominal surgery has been shown in previous human studies using various techniques.8–13 Our result is consistent with a previous clinical and preclinical studies that reported a significant decrease in the inspiratory portion of the breathing cycle after upper abdominal surgery.23,25,26
In human subjects, an increase in breathing frequency with a decrease in tidal volume is commonly observed after upper abdominal surgery.13,25,27,28 On the contrary, the results of the present study showed a decrease in breathing frequency following the upper abdominal incision in rats. Given that the only analgesics that the animals received was ketoprofen at a dose of 5 mg·kg−1·day−1, which has a minimal respiratory effect, it is unlikely that the observed decrease in breathing frequency was due to the side effect of the analgesics. Moreover, while the rats that underwent gastrocnemius incision received the same analgesic regimen, an increase in minute ventilation without any significant change in breathing frequency was observed in these animals. This finding also suggests that the decrease in breathing frequency observed after the upper abdominal incision is more likely to be a site-specific phenomenon, rather than a non-specific or generalized systemic effect of an incision. Decreased breathing frequency following abdominal surgery has also been demonstrated in other rodent species, such as mice and rabbits.29,30 On the other hand, an increase in breathing frequency has been shown in the larger animals, such as dogs and horses.22,23,31 It is possible that the respiratory phenotypes of these larger species more closely resemble those of humans. There may exist various anatomical and functional differences between humans and rodents. The mechanisms underlying these interspecies differences remain to be elucidated, and some caution should be applied when extrapolating data from the rodent models to humans. Nevertheless, our results demonstrated that the decreased breathing frequency after the upper abdominal incision was significantly reversed by thoracic epidural block, and this finding support that the changes in the ventilatory parameters most likely represent impairment induce by the abdominal incision. Therefore, our model of upper abdominal incision may provide an attractive alternative to the larger species, considering its cost-effectiveness, ease of handling, and the feasibility to amass large sample sizes.
Afferents mechanism of reflex inhibition of phrenic motor output
Since the model used in the present study involves full-thickness incision on one side of the abdominal wall, any afferent nerves supplying or passing through the incised area could have played a role mediating this reflex inhibition. In previous studies, direct stimulation of the afferent nerves innervating abdominal muscle and parietal peritoneum using electrical or chemical stimuli was shown to decrease phrenic nerve activity and diaphragmatic function,32–35 suggesting a potential role of these afferents mediating inhibition of phrenic motor output. Given the anatomical proximity of the abdominal incision to the diaphragm, phrenic afferent nerves innervating diaphragm and adjacent peritoneum might have played a role as well.36–38 The upper abdominal incision model used in the present study did not involve any visceral manipulation, and our results indicate that visceral injury was not necessary to induce inhibition of phrenic motor output. However, it is possible that surgeries that involve significant trauma to the visceral organs may contribute to a further decrease in phrenic activity.39–41 The relative contribution of different types of peripheral afferent nerves from the abdominal wall and viscera towards this inhibitory neural reflex is yet to be determined. Unilateral abdominal incision resulted in the bilateral impairment of phrenic output, implying the existence of the afferent or efferent pathways crossing to the contralateral side. Future studies involving focal lesioning at multiple different levels of the nervous system may help elucidate the neural circuits involved in this inhibitory reflex.
Previous clinical studies have shown that various indices of diaphragmatic dysfunction after upper abdominal surgery improved 50 to 100% by thoracic epidural anesthesia up to T4 segment with 0.5% bupivacaine.12,13 These findings suggested that reduced conduction of afferent and efferent signals at the level of spinal roots at least partially reversed diaphragmatic dysfunction. Relaxation of abdominal wall muscle tone from motor blockade by epidural local anesthetic and a consequent shift of the workload from the abdominal wall to the diaphragm also have been proposed as mechanisms underlying improvement of postoperative diaphragmatic dysfunction after epidural local anesthesia.12,13,42 In the present study, 0.5% bupivacaine administered via the epidural catheter, which was expected to block signals from the injured abdominal wall,43–45 prevented the decrease in phrenic motor output after the upper abdominal incision. These results provide evidence supporting reflex inhibition of phrenic motor output and/or pain as the contributor(s) to postoperative changes in ventilatory mechanics and diaphragmatic function. Relaxation of muscle tone from motor blockade is an unlikely mechanism by which thoracic epidural anesthesia improved phrenic motor output, given that the animals were kept paralyzed with rocuronium throughout the protocol, both before and after administration of epidural bupivacaine.
The relative contribution of pain to the postoperative ventilatory impairment remains unknown. Pain scores were not reported in the above-mentioned clinical studies that demonstrated an improvement of diaphragmatic function by epidural anesthesia.12,13 In a study evaluating the effect of parietal analgesia, continuous preperitoneal infusion of 0.2% ropivacaine not only reduced diaphragmatic dysfunction, but also decreased pain scores during activity after abdominal surgery.46 On the other hand, epidural analgesia with opioids without local anesthetics did not significantly improve diaphragmatic dysfunction despite reduced pain,10,47 suggesting that decreasing the perception of pain per se may not be sufficient to block the reflex inhibition of diaphragmatic function. Perhaps the afferent signal threshold for perception of pain is higher than that for reflex inhibition of phrenic motor output, and these two phenomena could be differentiated under some circumstances. The effect of thoracic epidural block using dilute local anesthetics, at the concentrations that are typically used to decrease pain during the postoperative period (for example, bupivacaine 0.05 to 0.125%), on reflex inhibition of phrenic activity and diaphragmatic function is unknown. Optimal blockade of the afferent signals from the incision to eliminate reflex inhibition of phrenic activity may require higher concentrations of local anesthetics than those that are typically used for postoperative care. These high concentrations of local anesthetics may be impractical for postoperative use due to the side effects that could delay functional recovery, such as lower limb motor weakness, hypotension, urinary retention and motor blockade of intercostal muscles.
Diaphragmatic dysfunction is believed to be important in the genesis of postoperative pulmonary complications,48,49 and there is a need to develop more effective clinical strategies that will prevent or reverse postoperative diaphragmatic dysfunction and adverse respiratory events.50–53 Further research to determine the potential receptors and the afferent nerves that mediate reflex inhibition of phrenic activity is warranted, since understanding of the afferent mechanisms will allow us to develop effective strategies to prevent and treat diaphragmatic dysfunction after upper abdominal surgery. It is our expectation that our model will play a complementary role to the human studies as part of this research endeavor, by allowing us to employ various approaches that cannot be used on human participants.
Supplementary Material
Figure S1. Raw (non-normalized) data for the Protocol A, the short-term effect of upper abdominal incision vs. sham incision on efferent phrenic nerve activity. (A) One hour after the upper abdominal incision (Postop), spike frequency area-under-the-curve (AUC)/respiratory cycle was significantly lower compared with baseline in the Ipsilateral (P = 0.0001) and the Contralateral groups (P = 0.0006), but not in the Sham group (P = 0.8767). (B) The spike frequency AUC/minute after the incision was significantly lower than baseline only in the Ipsilateral (P = 0.0005) and the Contralateral groups (P < 0.0001), but not in the Sham group (P > 0.9999). While there was no difference among the groups at baseline, the mean value of the Contralateral group was significantly lower than that of the Sham group (P = 0.0153) 1 hour after the incision. (C) The integrated phrenic neurogram (∫Phr) AUC/respiratory cycle after the incision was significantly lower compared with baseline in the Ipsilateral group (P = 0.0053). (D) There was a significant decrease in the ∫Phr AUC/minute from baseline after the incision in the Ipsilateral (P = 0.0007) and the Contralateral (P = 0.0038) groups, but not in the Sham group (P = 0.9716). (E) There was a significant decrease in central respiratory rate from baseline after the incision in the Contralateral group (P = 0.0008). The central respiratory rate of the Contralateral group was significantly lower than the Sham group (P = 0.0149) after the incision. (F) There was a significant decrease in inspiratory-to-expiratory duration ratio (TI:TE) from baseline after the incision in the Ipsilateral (P = 0.0004) and the Contralateral groups (P = 0.0006), but not in the Sham group (P = 0.9867). One hour after the incision, TI:TE of the Ipsilateral and the Contralateral groups were significantly lower than that of the Sham group (P = 0.0446 and P = 0.0087, respectively). Data are presented as mean ± SD. The sample size per group was: N = 7 in the Ipsilateral and Contralateral groups; N = 8 in the Sham group. **P < 0.01; ***P < 0.001; ****P < 0.0001 vs. Baseline, and †P < 0.05; ††P < 0.01 vs. Sham by two-way ANOVA with repeated measured in one factor, followed by Sidak’s multiple comparison tests.
Figure S2. Raw (non-normalized) data for the Protocol C, the effect of upper abdominal incision vs. sham incision on the ventilatory parameters. (A) Minute ventilation of the Incision group after the surgery, on POD 0 through POD 10, was significantly lower compared with baseline (POD 0: P = 0.0001; POD 1: P = 0.0006; POD 2: P = 0.0070; POD 4: P = 0.0010; POD 7: P = 0.0015; POD 10: P = 0.0003). On the other hand, there was no statistical difference in minute ventilation of the Sham group throughout the testing period. (B) Breathing frequency of the Incision group on POD 0 though POD 10 was significantly lower compared to baseline (POD 0: P < 0.0001; POD 1: P < 0.0001; POD 2: P = 0.0072; POD 4: P = 0.0019; POD 7: P = 0.0002; POD 10: P = 0.0022). The mean breathing frequency values of the Sham group were not different throughout the testing period. (C) For tidal volume, there was no significant main effect or interaction. (D) Inspiratory-to-expiratory time ratio (I:E ratio) of the Incision group was lower compared with baseline on POD 0 through POD 7 (POD 0: P < 0.0001; POD 1: P < 0.0001; POD 4: P = 0.0054; POD 7: P = 0.0017); I:E ratio of the Sham group was not significantly different throughout the testing period. (E) For expiratory flow at 50% expired volume (EF50), there was no significant main effect or interaction. (F) Body weight on POD 0 through POD 10 were significantly greater compared with baseline in both the Incision and the Sham groups. Data are presented as mean ± SD. N = 8 per group. **P < 0.01; ***P < 0.001; ****P < 0.0001 vs. Baseline, and †P < 0.05; †††P < 0.001; ††††P < 0.0001 vs. Sham by two-way ANOVA with repeated measured in one factor, followed by Sidak’s multiple comparison tests. BL = baseline.
Figure S3. Raw (non-normalized) data for the Protocol D, the effect of epidural bupivacaine (“Bupivacaine” group, N = 8) vs. PBS (“PBS” group, N = 10) on efferent phrenic nerve activity before and after the upper abdominal incision. (A) One hour after the abdominal incision (Postop), spike frequency area-under-the-curve (ACU)/respiratory cycle was significantly lower than baseline in the PBS group (P < 0.0001); on the other hand, the mean value after the incision did not show any difference compared with baseline in the Bupivacaine group (P = 0.4923). After the incision, the mean spike frequency ACU/respiratory cycle of the Bupivacaine group was significantly greater than that of the PBS group (P = 0.0002). (B) While the spike frequency AUC/minute significantly decreased from baseline after the incision in the PBS group (P < 0.0001), the mean value after the incision was not significantly different from baseline in the Bupivacaine group (P = 0.7996). After the incision, the mean spike frequency AUC/minute of the Bupivacaine group was significantly greater than that of the PBS group (P < 0.0001). (C) The integrated phrenic neurogram (∫Phr) AUC/respiratory cycle significantly decreased from baseline after the abdominal incision in the PBS group (P = 0.0026), but not in the Bupivacaine group (P = 0.4372). (D) The mean ∫Phr AUC/minute after the incision was significantly lower than the baseline in the PBS group (P < 0.0001), while the mean value after the incision was not significantly different than baseline in the Bupivacaine group (P = 0.7175). (E) Central respiratory rate after the incision was significantly lower than baseline in the PBS group (P = 0.0008); on the hand, the mean central respiratory rate after the incision was not significantly different from baseline in the Bupivacaine group (P = 0.9194). (F) There was a significant decrease in inspiratory-to-expiratory duration ratio (TI:TE) from baseline after the incision in the PBS group (P < 0.0001), but not in the Bupivacaine group (P = 0.8102). Data are presented as mean ± SD. **P < 0.01; ****P < 0.0001 vs. Baseline, §§P < 0.01; §§§§P < 0.0001 vs. Post-Epidural, and †††P < 0.001; ††††P < 0.0001 vs. PBS by two-way ANOVA with repeated measured in one factor, followed by Sidak’s multiple comparison tests. Post-Epidural = Post-epidural injection.
Figure S4. Efferent phrenic nerve activity after the upper abdominal incision in the animals with the improperly positioned epidural catheters. Two animals were excluded because methylene blue dye injected through the catheters at the end of the protocol was identified in the paraspinal muscles. One of these rats received bupivacaine [“Excluded (1)”], and the other received PBS [“Excluded (2)”] through the catheter. These 2 rats’ data are superimposed on the Figure 7. (A-F): Spike frequency area-under-the-curve (AUC)/respiratory cycle (A), spike frequency AUC/minute (B), integrated phrenic neurogram (∫Phr) AUC/respiratory cycle (C), ∫Phr AUC/minute (D), central respiratory rate (E), and inspiratory-to-expiratory duration ratio (TI:TE; F) were evaluated after injection of test drug through the catheter (Post-Drug) and the abdominal incision (Postop). Data are presented as mean ± SD in the PBS and the Bupivacaine groups, and the individual data points are plotted for the Excluded (1) and the Excluded (2). **P < 0.01; ****P < 0.0001 vs. Baseline, §§P < 0.01; §§§P < 0.001; §§§§P < 0.0001 vs. Post-Epidural, and ††††P < 0.0001 vs. PBS by two-way ANOVA with repeated measured in one factor, followed by Sidak’s multiple comparison tests. Only the “PBS” and the “Bupivacaine” groups were included in the statistical analyses.
Figure S5. Raw (non-normalized) data for the Protocol E, the effect of epidural bupivacaine vs. PBS on ventilatory parameters 1 day after the abdominal incision (POD 1). (A) There was a significant time-group interaction for minute ventilation. (B) For breathing frequency, there was a significant decrease from baseline after the abdominal incision in the PBS group (P = 0.0073). On the other hand, the mean breathing frequency of the Bupivacaine group on POD 1 was not significantly different from baseline (P = 0.8736). (C) There was no significant difference in tidal volume between the two groups. (D) The mean inspiratory-to-expiratory time ratio (I:E ratio) decreased significantly from baseline in the PBS group (P = 0.0421), but not in the Bupivacaine group (P = 0.2777). On POD 1, the mean I:E of the Bupivacaine group was significantly greater than that of the PBS group (P = 0.0074). (E) The expiratory flow at 50% expired volume (EF50) values were not significantly different between the Bupivacaine and PBS groups. (F) There was no significant difference in body weight between the groups or between before and after the incision. Data are presented as mean ± SD. N = 7 per group. *P < 0.05; **P < 0.01 vs. Baseline, and ††P < 0.01 vs. PBS by two-way ANOVA with repeated measured in one factor, followed by Sidak’s multiple comparison tests.
Figure S6. Ventilatory parameters after the upper abdominal incision in the animals with the improperly positioned epidural catheters. Three animals were excluded because methylene blue dye injected through the catheter at the end of the protocol was identified outside of the epidural space (“Excluded” group). One of these rats had intrathecal placement of the catheter and received PBS through the catheter. The other 2 rats’ catheters were identified in the paraspinal muscles, and both rats received bupivacaine through the catheter. These three rats’ data are superimposed on the modified version of Figure 8. (A-C): Ventilatory parameters, including minute ventilation (A), breathing frequency (B), and inspiratory-to-expiratory time ratio (I:E ratio; C) were measured before (Baseline) and 1 day after the abdominal incision (POD 1). On POD 1, bupivacaine or PBS was injected through the catheter 15 minutes prior to recording, as indicated by the arrows in the graphs. Data are presented as median with interquartile range. N = 7 per group in the PBS and the Bupivacaine groups, and N = 3 in the Excluded group. **P < 0.01 vs. Baseline, and ††P < 0.01; †††P < 0.001 vs. PBS by two-way ANOVA with repeated measured in one factor, followed by Sidak’s multiple comparison tests. Only the PBS and the Bupivacaine groups were included in the statistical analyses.
Figure S7. Subgroup analysis by sex: the short-term effect of the upper abdominal incision on efferent phrenic nerve activity (Protocol A). (A-F): Spike frequency area-under-the-curve (AUC)/respiratory cycle (A), spike frequency AUC/minute (B), integrated phrenic neurogram (∫Phr) AUC/respiratory cycle (C), ∫Phr AUC/minute (D), central respiratory rate (E), and inspiratory-to-expiratory duration ratio (TI:TE; F) were evaluated one hour after the upper abdominal incision (Postop). The “Ipsi” and the “Contra” group respectively represent nerve activity recorded from the phrenic nerves on the same side and the opposite side of the abdominal incision. The control group underwent the sham incision (“Sham” group). Data are presented as median with interquartile range. Sample sizes are given in (A). †P < 0.05 vs. Sham by Kruskal-Wallis test followed by post hoc Dunn’s multiple comparison tests.
Figure S8. Subgroup analysis by sex: the efferent phrenic nerve activity measured 1 day or 10 days after the upper abdominal incision (Protocol B). (A-F): Spike frequency area-under-the-curve (AUC)/respiratory cycle (A), spike frequency AUC/minute (B), integrated phrenic neurogram (∫Phr) AUC/respiratory cycle (C), ∫Phr AUC/minute (D), central respiratory rate (E), and inspiratory-to-expiratory duration ratio (TI:TE; F) was compared between the groups. The colored dots represent the individual data points, horizontal lines represent median, and error bars represent interquartile range. Sample sizes are given in (A). *P < 0.05 vs. Sham, and †P < 0.05 vs. POD 10 by Kruskal-Wallis test followed by post hoc Dunn’s multiple comparison tests. POD = postoperative day.
Figure S9. Subgroup analysis by sex: the effect of upper abdominal incision (“Incision” group) vs. sham incision (“Sham” group) on ventilatory parameters (Protocol C). (A-E): Ventilatory parameters measured using the whole-body plethysmography system included minute ventilation (B), breathing frequency (C), tidal volume (D), inspiratory-to-expiratory time ratio (I:E ratio; E), and expiratory flow at 50% expired volume (EF50; F). (G): Body weight measured throughout the experimental period. Data are presented as median with interquartile range. Sample sizes are given in (A). *P < 0.05; **P < 0.01; ***P < 0.001 vs. Baseline by Friedman test followed by post hoc Dunn’s multiple comparison tests. BL = baseline.
Figure S10. Subgroup analysis by sex: the effect of epidural bupivacaine (“Bupi” group) vs. PBS (“PBS” group) on efferent phrenic nerve activity before and after the upper abdominal incision (Protocol D). (A-F): Spike frequency area-under-the-curve (AUC)/respiratory cycle (A), spike frequency AUC/minute (B), integrated phrenic neurogram (∫Phr) AUC/respiratory cycle (C), ∫Phr AUC/minute (D), central respiratory rate (E), and inspiratory-to-expiratory duration ratio (TI:TE; F) were evaluated after epidural injection (Post-Epid) and the abdominal incision (Postop). Data are presented as median with interquartile range. Sample sizes are given in (A). *P < 0.05; **P < 0.01 vs. Baseline by Friedman test followed by post hoc Dunn’s multiple comparison tests.
Acknowledgments
The authors are grateful to Brandt D. Uitermarkt M.A. (Department of Neurology, University of Iowa, Iowa City, IA, USA) for technical assistance.
Financial support: In part supported by the Foundation of Anesthesia Education and Research to S.K. In part supported by National Institutes of Health, Bethesda, Maryland GM124055 to S.K. and T.J.B. In part supported by National Institutes of Health, Bethesda, Maryland NS090414 to G.B.R.
Footnotes
Competing Interests: The authors declare no competing interests.
References
- 1.Zahn PK, Brennan TJ: Incision-induced changes in receptive field properties of rat dorsal horn neurons. Anesthesiology 1999; 91: 772–85 [DOI] [PubMed] [Google Scholar]
- 2.Kang S, Wu C, Banik RK, Brennan TJ: Effect of capsaicin treatment on nociceptors in rat glabrous skin one day after plantar incision. Pain 2010; 148: 128–40 [DOI] [PMC free article] [PubMed] [Google Scholar]
- 3.Hamalainen MM, Gebhart GF, Brennan TJ: Acute effect of an incision on mechanosensitive afferents in the plantar rat hindpaw. J Neurophysiol 2002; 87: 712–20 [DOI] [PubMed] [Google Scholar]
- 4.Xu J, Brennan TJ: Guarding pain and spontaneous activity of nociceptors after skin versus skin plus deep tissue incision. Anesthesiology 2010; 112: 153–64 [DOI] [PMC free article] [PubMed] [Google Scholar]
- 5.Xu J, Gu H, Brennan TJ: Increased sensitivity of group III and group IV afferents from incised muscle in vitro. Pain 2010; 151: 744–55 [DOI] [PMC free article] [PubMed] [Google Scholar]
- 6.Xu J, Brennan TJ: Comparison of skin incision vs. skin plus deep tissue incision on ongoing pain and spontaneous activity in dorsal horn neurons. Pain 2009; 144: 329–39 [DOI] [PMC free article] [PubMed] [Google Scholar]
- 7.Zahn PK, Brennan TJ: Primary and secondary hyperalgesia in a rat model for human postoperative pain. Anesthesiology 1999; 90: 863–72 [DOI] [PubMed] [Google Scholar]
- 8.Ayoub J, Cohendy R, Prioux J, Ahmaidi S, Bourgeois JM, Dauzat M, Ramonatxo M, Prefaut C: Diaphragm movement before and after cholecystectomy: a sonographic study. Anesth Analg 2001; 92: 755–61 [DOI] [PubMed] [Google Scholar]
- 9.Sharma RR, Axelsson H, Oberg A, Jansson E, Clergue F, Johansson G, Reiz S: Diaphragmatic activity after laparoscopic cholecystectomy. Anesthesiology 1999; 91: 406–13 [DOI] [PubMed] [Google Scholar]
- 10.Simonneau G, Vivien A, Sartene R, Kunstlinger F, Samii K, Noviant Y, Duroux P: Diaphragm dysfunction induced by upper abdominal surgery. Role of postoperative pain. Am Rev Respir Dis 1983; 128: 899–903 [DOI] [PubMed] [Google Scholar]
- 11.Dureuil B, Viires N, Cantineau JP, Aubier M, Desmonts JM: Diaphragmatic contractility after upper abdominal surgery. J Appl Physiol 1986; 61: 1775–80 [DOI] [PubMed] [Google Scholar]
- 12.Manikian B, Cantineau JP, Bertrand M, Kieffer E, Sartene R, Viars P: Improvement of diaphragmatic function by a thoracic extradural block after upper abdominal surgery. Anesthesiology 1988; 68: 379–86 [DOI] [PubMed] [Google Scholar]
- 13.Pansard JL, Mankikian B, Bertrand M, Kieffer E, Clergue F, Viars P: Effects of thoracic extradural block on diaphragmatic electrical activity and contractility after upper abdominal surgery. Anesthesiology 1993; 78: 63–71 [DOI] [PubMed] [Google Scholar]
- 14.Sprung J, Barnas GM, Cheng EY, Rodarte JR: Changes in functional residual capacity and regional diaphragm lengths after upper abdominal surgery in anesthetized dogs. Anesth Analg 1992; 75: 977–82 [DOI] [PubMed] [Google Scholar]
- 15.Pogatzki EM, Niemeier JS, Brennan TJ: Persistent secondary hyperalgesia after gastrocnemius incision in the rat. Eur J Pain 2002; 6: 295–305 [DOI] [PubMed] [Google Scholar]
- 16.Kang S, Lee D, Theusch BE, Arpey CJ, Brennan TJ: Wound hypoxia in deep tissue after incision in rats. Wound Repair Regen 2013; 21: 730–9 [DOI] [PMC free article] [PubMed] [Google Scholar]
- 17.Drorbaugh JE, Fenn WO: A barometric method for measuring ventilation in newborn infants. Pediatrics 1955; 16: 81–7 [PubMed] [Google Scholar]
- 18.Jin HC, Keller AJ, Jung JK, Subieta A, Brennan TJ: Epidural tezampanel, an AMPA/kainate receptor antagonist, produces postoperative analgesia in rats. Anesth Analg 2007; 105: 1152–9, table of contents [DOI] [PubMed] [Google Scholar]
- 19.Pogatzki EM, Zahn PK, Brennan TJ: Lumbar catheterization of the subarachnoid space with a 32-gauge polyurethane catheter in the rat. Eur J Pain 2000; 4: 111–3 [DOI] [PubMed] [Google Scholar]
- 20.Barrett K, Boitano S, Barman S, Brooks H: Ganong’s Review of Medical Physiology 23rd Edition edition New York: MaGraw-Hill Medical; 2010 [Google Scholar]
- 21.Sant’ambrogio G, Camporesi E: Contribution of various inspiratory muscles to ventilation and the immediate and distant effect of diaphragmatic paralysis. Acta Neurobiol Exp (Wars) 1973; 33: 401–9 [PubMed] [Google Scholar]
- 22.Road JD, Burgess KR, Whitelaw WA, Ford GT: Diaphragm function and respiratory response after upper abdominal surgery in dogs. J Appl Physiol 1984; 57: 576–82 [DOI] [PubMed] [Google Scholar]
- 23.Easton PA, Fitting JW, Arnoux R, Guerraty A, Grassino AE: Recovery of diaphragm function after laparotomy and chronic sonomicrometer implantation. J Appl Physiol (1985) 1989; 66: 613–21 [DOI] [PubMed] [Google Scholar]
- 24.Dureuil B, Cantineau JP, Desmonts JM: Effects of upper or lower abdominal surgery on diaphragmatic function. Br J Anaesth 1987; 59: 1230–5 [DOI] [PubMed] [Google Scholar]
- 25.Bablekos GD, Michaelides SA, Roussou T, Charalabopoulos KA: Changes in breathing control and mechanics after laparoscopic vs open cholecystectomy. Arch Surg 2006; 141: 16–22 [DOI] [PubMed] [Google Scholar]
- 26.Erice F, Fox GS, Salib YM, Romano E, Meakins JL, Magder SA: Diaphragmatic function before and after laparoscopic cholecystectomy. Anesthesiology 1993; 79: 966–75; discussion 27A-28A [PubMed] [Google Scholar]
- 27.Beecher HK: THE MEASURED EFFECT OF LAPAROTOMY ON THE RESPIRATION. J Clin Invest 1933; 12: 639–50 [DOI] [PMC free article] [PubMed] [Google Scholar]
- 28.Chuter TA, Weissman C, Starker PM: Respiratory patterns after cholecystectomy. Effects of posture and CO2 stimulation. Chest 1991; 100: 23–7 [DOI] [PubMed] [Google Scholar]
- 29.Claridge JA, Weed AC, Enelow R, Young JS: Laparotomy potentiates cytokine release and impairs pulmonary function after hemorrhage and resuscitation in mice. J Trauma 2001; 50: 244–52 [DOI] [PubMed] [Google Scholar]
- 30.Udegbunam RI, Onuba AC, Okorie-Kanu C, Udegbunam SO, Anyanwu MU, Ifeanyi OL: Effects of two doses of tramadol on pain and some biochemical parameters in rabbits post-gastrotomy. Comp Clin Pathol 2015; 24: 783–90 [Google Scholar]
- 31.Cruz AM, Cote N, McDonell WN, Geor RJ, Wilson BA, Monteith G, Li R: Postoperative effects of anesthesia and surgery on resting energy expenditure in horses as measured by indirect calorimetry. Can J Vet Res 2006; 70: 257–62 [PMC free article] [PubMed] [Google Scholar]
- 32.Jammes Y, Bye PT, Pardy RL, Katsardis C, Esau S, Roussos C: Expiratory threshold load under extracorporeal circulation: effects of vagal afferents. J Appl Physiol Respir Environ Exerc Physiol 1983; 55: 307–15 [DOI] [PubMed] [Google Scholar]
- 33.Jammes Y, Delpierre S: Respiratory and circulatory effects of parietal pleural afferent stimulation in rabbits. J Appl Physiol 2006; 100: 1539–46 [DOI] [PubMed] [Google Scholar]
- 34.Reeve EB, Nanson EM, Rundle FF: Observations on inhibitory respiratory reflexes during abdominal surgery. Clin Sci 1951; 10: 65–87 [PubMed] [Google Scholar]
- 35.Shannon R: Intercostal and abdominal muscle afferent influence on medullary dorsal respiratory group neurons. Respir Physiol 1980; 39: 73–94 [DOI] [PubMed] [Google Scholar]
- 36.Jammes Y, Buchler B, Delpierre S, Rasidakis A, Grimaud C, Roussos C: Phrenic afferents and their role in inspiratory control. J Appl Physiol (1985) 1986; 60: 854–60 [DOI] [PubMed] [Google Scholar]
- 37.Jammes Y, Balzamo E: Changes in afferent and efferent phrenic activities with electrically induced diaphragmatic fatigue. J Appl Physiol (1985) 1992; 73: 894–902 [DOI] [PubMed] [Google Scholar]
- 38.Speck DF, Revelette WR: Attenuation of phrenic motor discharge by phrenic nerve afferents. J Appl Physiol (1985) 1987; 62: 941–5 [DOI] [PubMed] [Google Scholar]
- 39.Stella MH, Knuth SL, Bartlett D Jr.: Respiratory response to mechanical stimulation of the gallbladder. Respir Physiol Neurobiol 2002; 130: 285–92 [DOI] [PubMed] [Google Scholar]
- 40.De Troyer A, Rosso J: Reflex inhibition of the diaphragm by esophageal afferents. Neurosci Lett 1982; 30: 43–6 [DOI] [PubMed] [Google Scholar]
- 41.Prabhakar NR, Marek W, Loeschcke HH: Altered breathing pattern elicited by stimulation of abdominal visceral afferents. J Appl Physiol (1985) 1985; 58: 1755–60 [DOI] [PubMed] [Google Scholar]
- 42.Polaner DM, Kimball WR, Fratacci MD, Wain JC, Zapol WM: Thoracic epidural anesthesia increases diaphragmatic shortening after thoracotomy in the awake lamb. Anesthesiology 1993; 79: 808–16 [DOI] [PubMed] [Google Scholar]
- 43.Lazaro JJ, Franquelo C, Navarro X, Castellano B, Verdu E, Cristofol C, Arboix M: Prolongation of nerve and epidural anesthetic blockade by bupivacaine in a lipid emulsion. Anesth Analg 1999; 89: 121–7 [DOI] [PubMed] [Google Scholar]
- 44.Blomberg S, Ricksten SE: Thoracic epidural anesthesia in conscious and anaesthetized rats. Effects on central haemodynamics compared to cardiac beta adrenoceptor and ganglionic blockade. Acta Anaesthesiol Scand 1988; 32: 166–72 [DOI] [PubMed] [Google Scholar]
- 45.Durant PA, Yaksh TL: Epidural injections of bupivacaine, morphine, fentanyl, lofentanil, and DADL in chronically implanted rats: a pharmacologic and pathologic study. Anesthesiology 1986; 64: 43–53 [DOI] [PubMed] [Google Scholar]
- 46.Beaussier M, El’ayoubi H, Rollin M, Parc Y, Atchabahian A, Chanques G, Capdevila X, Lienhart A, Jaber S: Parietal analgesia decreases postoperative diaphragm dysfunction induced by abdominal surgery: a physiologic study. Reg Anesth Pain Med 2009; 34: 393–7 [DOI] [PubMed] [Google Scholar]
- 47.Bonnet F, Blery C, Zatan M, Simonet O, Brage D, Gaudy J: Effect of epidural morphine on post-operative pulmonary dysfunction. Acta Anaesthesiol Scand 1984; 28: 147–51 [DOI] [PubMed] [Google Scholar]
- 48.Ford GT, Rosenal TW, Clergue F, Whitelaw WA: Respiratory physiology in upper abdominal surgery. Clin Chest Med 1993; 14: 237–52 [PubMed] [Google Scholar]
- 49.Brooks-Brunn JA: Postoperative atelectasis and pneumonia. Heart Lung 1995; 24: 94–115 [PubMed] [Google Scholar]
- 50.Futier E, Constantin JM, Paugam-Burtz C, Pascal J, Eurin M, Neuschwander A, Marret E, Beaussier M, Gutton C, Lefrant JY, Allaouchiche B, Verzilli D, Leone M, De Jong A, Bazin JE, Pereira B, Jaber S: A trial of intraoperative low-tidal-volume ventilation in abdominal surgery. N Engl J Med 2013; 369: 428–37 [DOI] [PubMed] [Google Scholar]
- 51.Hemmes SN, Gama de Abreu M, Pelosi P, Schultz MJ: High versus low positive end-expiratory pressure during general anaesthesia for open abdominal surgery (PROVHILO trial): a multicentre randomised controlled trial. Lancet 2014; 384: 495–503 [DOI] [PMC free article] [PubMed] [Google Scholar]
- 52.Seiler CM, Deckert A, Diener MK, Knaebel HP, Weigand MA, Victor N, Buchler MW: Midline versus transverse incision in major abdominal surgery: a randomized, double-blind equivalence trial (POVATI: ISRCTN60734227). Ann Surg 2009; 249: 913–20 [DOI] [PubMed] [Google Scholar]
- 53.Treschan TA, Kaisers W, Schaefer MS, Bastin B, Schmalz U, Wania V, Eisenberger CF, Saleh A, Weiss M, Schmitz A, Kienbaum P, Sessler DI, Pannen B, Beiderlinden M: Ventilation with low tidal volumes during upper abdominal surgery does not improve postoperative lung function. Br J Anaesth 2012; 109: 263–71 [DOI] [PubMed] [Google Scholar]
Associated Data
This section collects any data citations, data availability statements, or supplementary materials included in this article.
Supplementary Materials
Figure S1. Raw (non-normalized) data for the Protocol A, the short-term effect of upper abdominal incision vs. sham incision on efferent phrenic nerve activity. (A) One hour after the upper abdominal incision (Postop), spike frequency area-under-the-curve (AUC)/respiratory cycle was significantly lower compared with baseline in the Ipsilateral (P = 0.0001) and the Contralateral groups (P = 0.0006), but not in the Sham group (P = 0.8767). (B) The spike frequency AUC/minute after the incision was significantly lower than baseline only in the Ipsilateral (P = 0.0005) and the Contralateral groups (P < 0.0001), but not in the Sham group (P > 0.9999). While there was no difference among the groups at baseline, the mean value of the Contralateral group was significantly lower than that of the Sham group (P = 0.0153) 1 hour after the incision. (C) The integrated phrenic neurogram (∫Phr) AUC/respiratory cycle after the incision was significantly lower compared with baseline in the Ipsilateral group (P = 0.0053). (D) There was a significant decrease in the ∫Phr AUC/minute from baseline after the incision in the Ipsilateral (P = 0.0007) and the Contralateral (P = 0.0038) groups, but not in the Sham group (P = 0.9716). (E) There was a significant decrease in central respiratory rate from baseline after the incision in the Contralateral group (P = 0.0008). The central respiratory rate of the Contralateral group was significantly lower than the Sham group (P = 0.0149) after the incision. (F) There was a significant decrease in inspiratory-to-expiratory duration ratio (TI:TE) from baseline after the incision in the Ipsilateral (P = 0.0004) and the Contralateral groups (P = 0.0006), but not in the Sham group (P = 0.9867). One hour after the incision, TI:TE of the Ipsilateral and the Contralateral groups were significantly lower than that of the Sham group (P = 0.0446 and P = 0.0087, respectively). Data are presented as mean ± SD. The sample size per group was: N = 7 in the Ipsilateral and Contralateral groups; N = 8 in the Sham group. **P < 0.01; ***P < 0.001; ****P < 0.0001 vs. Baseline, and †P < 0.05; ††P < 0.01 vs. Sham by two-way ANOVA with repeated measured in one factor, followed by Sidak’s multiple comparison tests.
Figure S2. Raw (non-normalized) data for the Protocol C, the effect of upper abdominal incision vs. sham incision on the ventilatory parameters. (A) Minute ventilation of the Incision group after the surgery, on POD 0 through POD 10, was significantly lower compared with baseline (POD 0: P = 0.0001; POD 1: P = 0.0006; POD 2: P = 0.0070; POD 4: P = 0.0010; POD 7: P = 0.0015; POD 10: P = 0.0003). On the other hand, there was no statistical difference in minute ventilation of the Sham group throughout the testing period. (B) Breathing frequency of the Incision group on POD 0 though POD 10 was significantly lower compared to baseline (POD 0: P < 0.0001; POD 1: P < 0.0001; POD 2: P = 0.0072; POD 4: P = 0.0019; POD 7: P = 0.0002; POD 10: P = 0.0022). The mean breathing frequency values of the Sham group were not different throughout the testing period. (C) For tidal volume, there was no significant main effect or interaction. (D) Inspiratory-to-expiratory time ratio (I:E ratio) of the Incision group was lower compared with baseline on POD 0 through POD 7 (POD 0: P < 0.0001; POD 1: P < 0.0001; POD 4: P = 0.0054; POD 7: P = 0.0017); I:E ratio of the Sham group was not significantly different throughout the testing period. (E) For expiratory flow at 50% expired volume (EF50), there was no significant main effect or interaction. (F) Body weight on POD 0 through POD 10 were significantly greater compared with baseline in both the Incision and the Sham groups. Data are presented as mean ± SD. N = 8 per group. **P < 0.01; ***P < 0.001; ****P < 0.0001 vs. Baseline, and †P < 0.05; †††P < 0.001; ††††P < 0.0001 vs. Sham by two-way ANOVA with repeated measured in one factor, followed by Sidak’s multiple comparison tests. BL = baseline.
Figure S3. Raw (non-normalized) data for the Protocol D, the effect of epidural bupivacaine (“Bupivacaine” group, N = 8) vs. PBS (“PBS” group, N = 10) on efferent phrenic nerve activity before and after the upper abdominal incision. (A) One hour after the abdominal incision (Postop), spike frequency area-under-the-curve (ACU)/respiratory cycle was significantly lower than baseline in the PBS group (P < 0.0001); on the other hand, the mean value after the incision did not show any difference compared with baseline in the Bupivacaine group (P = 0.4923). After the incision, the mean spike frequency ACU/respiratory cycle of the Bupivacaine group was significantly greater than that of the PBS group (P = 0.0002). (B) While the spike frequency AUC/minute significantly decreased from baseline after the incision in the PBS group (P < 0.0001), the mean value after the incision was not significantly different from baseline in the Bupivacaine group (P = 0.7996). After the incision, the mean spike frequency AUC/minute of the Bupivacaine group was significantly greater than that of the PBS group (P < 0.0001). (C) The integrated phrenic neurogram (∫Phr) AUC/respiratory cycle significantly decreased from baseline after the abdominal incision in the PBS group (P = 0.0026), but not in the Bupivacaine group (P = 0.4372). (D) The mean ∫Phr AUC/minute after the incision was significantly lower than the baseline in the PBS group (P < 0.0001), while the mean value after the incision was not significantly different than baseline in the Bupivacaine group (P = 0.7175). (E) Central respiratory rate after the incision was significantly lower than baseline in the PBS group (P = 0.0008); on the hand, the mean central respiratory rate after the incision was not significantly different from baseline in the Bupivacaine group (P = 0.9194). (F) There was a significant decrease in inspiratory-to-expiratory duration ratio (TI:TE) from baseline after the incision in the PBS group (P < 0.0001), but not in the Bupivacaine group (P = 0.8102). Data are presented as mean ± SD. **P < 0.01; ****P < 0.0001 vs. Baseline, §§P < 0.01; §§§§P < 0.0001 vs. Post-Epidural, and †††P < 0.001; ††††P < 0.0001 vs. PBS by two-way ANOVA with repeated measured in one factor, followed by Sidak’s multiple comparison tests. Post-Epidural = Post-epidural injection.
Figure S4. Efferent phrenic nerve activity after the upper abdominal incision in the animals with the improperly positioned epidural catheters. Two animals were excluded because methylene blue dye injected through the catheters at the end of the protocol was identified in the paraspinal muscles. One of these rats received bupivacaine [“Excluded (1)”], and the other received PBS [“Excluded (2)”] through the catheter. These 2 rats’ data are superimposed on the Figure 7. (A-F): Spike frequency area-under-the-curve (AUC)/respiratory cycle (A), spike frequency AUC/minute (B), integrated phrenic neurogram (∫Phr) AUC/respiratory cycle (C), ∫Phr AUC/minute (D), central respiratory rate (E), and inspiratory-to-expiratory duration ratio (TI:TE; F) were evaluated after injection of test drug through the catheter (Post-Drug) and the abdominal incision (Postop). Data are presented as mean ± SD in the PBS and the Bupivacaine groups, and the individual data points are plotted for the Excluded (1) and the Excluded (2). **P < 0.01; ****P < 0.0001 vs. Baseline, §§P < 0.01; §§§P < 0.001; §§§§P < 0.0001 vs. Post-Epidural, and ††††P < 0.0001 vs. PBS by two-way ANOVA with repeated measured in one factor, followed by Sidak’s multiple comparison tests. Only the “PBS” and the “Bupivacaine” groups were included in the statistical analyses.
Figure S5. Raw (non-normalized) data for the Protocol E, the effect of epidural bupivacaine vs. PBS on ventilatory parameters 1 day after the abdominal incision (POD 1). (A) There was a significant time-group interaction for minute ventilation. (B) For breathing frequency, there was a significant decrease from baseline after the abdominal incision in the PBS group (P = 0.0073). On the other hand, the mean breathing frequency of the Bupivacaine group on POD 1 was not significantly different from baseline (P = 0.8736). (C) There was no significant difference in tidal volume between the two groups. (D) The mean inspiratory-to-expiratory time ratio (I:E ratio) decreased significantly from baseline in the PBS group (P = 0.0421), but not in the Bupivacaine group (P = 0.2777). On POD 1, the mean I:E of the Bupivacaine group was significantly greater than that of the PBS group (P = 0.0074). (E) The expiratory flow at 50% expired volume (EF50) values were not significantly different between the Bupivacaine and PBS groups. (F) There was no significant difference in body weight between the groups or between before and after the incision. Data are presented as mean ± SD. N = 7 per group. *P < 0.05; **P < 0.01 vs. Baseline, and ††P < 0.01 vs. PBS by two-way ANOVA with repeated measured in one factor, followed by Sidak’s multiple comparison tests.
Figure S6. Ventilatory parameters after the upper abdominal incision in the animals with the improperly positioned epidural catheters. Three animals were excluded because methylene blue dye injected through the catheter at the end of the protocol was identified outside of the epidural space (“Excluded” group). One of these rats had intrathecal placement of the catheter and received PBS through the catheter. The other 2 rats’ catheters were identified in the paraspinal muscles, and both rats received bupivacaine through the catheter. These three rats’ data are superimposed on the modified version of Figure 8. (A-C): Ventilatory parameters, including minute ventilation (A), breathing frequency (B), and inspiratory-to-expiratory time ratio (I:E ratio; C) were measured before (Baseline) and 1 day after the abdominal incision (POD 1). On POD 1, bupivacaine or PBS was injected through the catheter 15 minutes prior to recording, as indicated by the arrows in the graphs. Data are presented as median with interquartile range. N = 7 per group in the PBS and the Bupivacaine groups, and N = 3 in the Excluded group. **P < 0.01 vs. Baseline, and ††P < 0.01; †††P < 0.001 vs. PBS by two-way ANOVA with repeated measured in one factor, followed by Sidak’s multiple comparison tests. Only the PBS and the Bupivacaine groups were included in the statistical analyses.
Figure S7. Subgroup analysis by sex: the short-term effect of the upper abdominal incision on efferent phrenic nerve activity (Protocol A). (A-F): Spike frequency area-under-the-curve (AUC)/respiratory cycle (A), spike frequency AUC/minute (B), integrated phrenic neurogram (∫Phr) AUC/respiratory cycle (C), ∫Phr AUC/minute (D), central respiratory rate (E), and inspiratory-to-expiratory duration ratio (TI:TE; F) were evaluated one hour after the upper abdominal incision (Postop). The “Ipsi” and the “Contra” group respectively represent nerve activity recorded from the phrenic nerves on the same side and the opposite side of the abdominal incision. The control group underwent the sham incision (“Sham” group). Data are presented as median with interquartile range. Sample sizes are given in (A). †P < 0.05 vs. Sham by Kruskal-Wallis test followed by post hoc Dunn’s multiple comparison tests.
Figure S8. Subgroup analysis by sex: the efferent phrenic nerve activity measured 1 day or 10 days after the upper abdominal incision (Protocol B). (A-F): Spike frequency area-under-the-curve (AUC)/respiratory cycle (A), spike frequency AUC/minute (B), integrated phrenic neurogram (∫Phr) AUC/respiratory cycle (C), ∫Phr AUC/minute (D), central respiratory rate (E), and inspiratory-to-expiratory duration ratio (TI:TE; F) was compared between the groups. The colored dots represent the individual data points, horizontal lines represent median, and error bars represent interquartile range. Sample sizes are given in (A). *P < 0.05 vs. Sham, and †P < 0.05 vs. POD 10 by Kruskal-Wallis test followed by post hoc Dunn’s multiple comparison tests. POD = postoperative day.
Figure S9. Subgroup analysis by sex: the effect of upper abdominal incision (“Incision” group) vs. sham incision (“Sham” group) on ventilatory parameters (Protocol C). (A-E): Ventilatory parameters measured using the whole-body plethysmography system included minute ventilation (B), breathing frequency (C), tidal volume (D), inspiratory-to-expiratory time ratio (I:E ratio; E), and expiratory flow at 50% expired volume (EF50; F). (G): Body weight measured throughout the experimental period. Data are presented as median with interquartile range. Sample sizes are given in (A). *P < 0.05; **P < 0.01; ***P < 0.001 vs. Baseline by Friedman test followed by post hoc Dunn’s multiple comparison tests. BL = baseline.
Figure S10. Subgroup analysis by sex: the effect of epidural bupivacaine (“Bupi” group) vs. PBS (“PBS” group) on efferent phrenic nerve activity before and after the upper abdominal incision (Protocol D). (A-F): Spike frequency area-under-the-curve (AUC)/respiratory cycle (A), spike frequency AUC/minute (B), integrated phrenic neurogram (∫Phr) AUC/respiratory cycle (C), ∫Phr AUC/minute (D), central respiratory rate (E), and inspiratory-to-expiratory duration ratio (TI:TE; F) were evaluated after epidural injection (Post-Epid) and the abdominal incision (Postop). Data are presented as median with interquartile range. Sample sizes are given in (A). *P < 0.05; **P < 0.01 vs. Baseline by Friedman test followed by post hoc Dunn’s multiple comparison tests.