

Abstract
The structure–activity relationships of 31 xanthones were analyzed by using the ferric reducing antioxidant power (FRAP) assay to determine their electron‐transfer (ET) potential. It was proven that the ET potential of xanthones was dominated by four moieties (i.e. hydroquinone moiety, 5,6‐catechol moiety, 6,7‐catechol moiety, and 7,8‐catechol moiety) and was only slightly affected by other structural features, including a single phenolic OH group, the resorcinol moiety, the transannular dihydroxy moiety, a methoxy group, a sugar residue, an isoprenyl group, a cyclized isoprenyl group, and an isopentanol group. The results could be used to predict the ET potentials of other antioxidant xanthones.
Keywords: antioxidants, electron transfer, fused-ring systems, structure–activity relationships, xanthones
1. Introduction
Xanthones and flavonoids are two series of phenolic compounds that may include very strong antioxidants. Presently, at least 300 xanthones and thousands of flavonoids have already been isolated from various plants, especially Chinese herbal medicines.1, 2 Although xanthones and flavonoids have even been simultaneously isolated from a single plant (e.g. Polygala japonica),3 the attention they have received is not the same. Whereas some studies have analyzed the structure–activity relationships of antioxidant flavonoids,4, 5, 6, 7, 8, 9, 10, 11, 12, 13, 14, 15, 16, 17, 18, 19, 20, 21 there are none that have focused on the structure–activity relationships of antioxidant xanthones.
Herein, we chose 31 antioxidant xanthones as reference compounds (Table 1) that cover all of the structural features emerging in antioxidant xanthones, including the 5,8‐dihydroxy moiety, 5,6‐catechol moiety, 6,7‐catechol moiety, 7,8‐catechol moiety, a single phenolic OH group, resorcinol moiety, transannular dihydroxy moiety, methoxy group, sugar residue, isoprenyl group, cyclized isoprenyl group, and isopentanol group. Essentially, the 5,8‐dihydroxy moiety belongs to the para‐dihydroxy (hydroquinone) moiety.22, 23 The hydroquinone moiety, however, is very rare in other phenolic antioxidants. For example, among the thousands of documented flavonoids, there are only a few flavonoids with a hydroquinone moiety, and they include rhodionin,24 5,8‐dihydroxy‐3,6,7‐trimethoxyflavone,25 5,8‐dihydroxy‐6,7‐dimethoxyflavone,25 5,8‐dihydroxy‐6,7,4′‐trimethoxyflavone, 5,8‐dihydroxy‐6,7,3′,4′,5′‐pentamethoxyflavone,1 and isothymusin.26 This hydroquinone moiety is hardly found in other phenolics.4, 5, 6, 7, 8, 9, 10, 11, 12, 13, 14, 15, 16, 17 As a result, its antioxidant role has not yet been explored. The isoprenyl group, however, seldom occurs in other phenolics but widely occurs in xanthones. In fact, half of the xanthones have either an isoprenyl or a cyclized isoprenyl group and an isopentanol group. The investigation of the antioxidant roles of the hydroquinone moiety and the isoprenyl group makes the present study novel and characteristic.
Table 1.
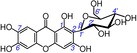
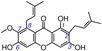
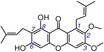
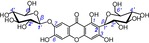
Structures, IC50 values, and TEAC values of xanthone references 1–31.[a]
| Compd | Name, IC50 value, TEAC | Structure | Compd | Name, IC50 value, TEAC | Structure |
|---|---|---|---|---|---|
| 1 | norathyriol IC50=44.3±1.5 μm TEAC 0.9481 |

|
16 | euxanthone IC50=2078.6±559.1 μm TEAC=0.0202 |

|
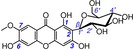
| 2 | mangiferin IC50=45.8±0.9 μm TEAC=0.9170 |
|
17 | 1,5‐dihydroxyxanthone IC50=2177.5±250.9 μm TEAC=0.0193 |

|
| 3 | isomangiferin IC50=50.5±1.9 μm TEAC=0.8317 |

|
18 | α‐mangostin IC50=4127.9±9.6 μm TEAC=0.0101 |
|
| 4 | 1,3,5,8‐tetrahydroxyxanthone IC50=51.0±1.3 μm TEAC=0.8264 |

|
19 | cowaxanthone B IC50=4223.9±207.8 μm TEAC=0.0099 |
|
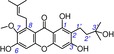
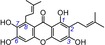
| 5 | gartanin IC50=56.2±2.7 μm TEAC=0.7463 |

|
20 | 2‐hydroxyxanthone IC50=4534.6±474.2 μm TEAC=0.0092 |

|
| 6 | 1,3,5,6‐tetrahydroxyxanthone IC50=62.8±0.5 μm TEAC=0.6688 |

|
21 | garcinone D IC50=5269.3±331.6 μm TEAC=0.0080 |

|
| 7 | 1,2,5‐trihydroxyxanthone IC50=70.6±3.8 μm TEAC=0.5949 |

|
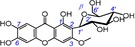
22 | neomangiferin IC50=5432.6±345.4 μm TEAC=0.0077 |
|
| 8 | subelliptenone G IC50=71.9±1.6 μm TEAC=0.5841 |

|
23 | 8‐desoxygartanin IC50=5434.8±334.2 μm TEAC=0.0077 |

|
| 9 | 1,6,7‐Trihydroxyxanthone IC50=71.9±1.8 μm TEAC=0.5841 |

|
24 | 5‐Hydroxy‐1‐methoxyxanthone IC50=5685.1±19.3 μm TEAC=0.0074 |

|
| 10 | 1,5,6‐trihydroxyxanthone IC50=85.3±4.6 μm TEAC=0.4941 |

|
25 | 7‐O‐methylmangiferin IC50=5881.7±315.3 μm TEAC=0.0071 |
|
| 11 | isojacareubin IC50=86.8±5.8 μm TEAC=0.4839 |

|
26 | cratoxylone IC50=6046.3±112.8 μm TEAC=0.0069 |
|
| 12 | bellidifolin IC50=90.8±3.9 μm TEAC=0.4626 |

|
27 | 3‐isomangostin IC50=6427.9±935.6 μm TEAC=0.0065 |
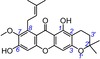
|
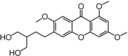
| 13 | 1,5,8‐trihydroxy‐3‐methoxy‐2‐prenylxanthone IC50=95.8±1.8 μm TEAC=0.4384 |

|
28 | β‐mangostin IC50=16938.7±2493.4 μm TEAC=0.0025 |
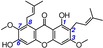
|
| 14 | γ‐mangostin IC50=101.2±4.7 μm TEAC=0.4149 |
|
29 | lancerin IC50=19504.2±1113.8 μm TEAC=0.0022 |

|
| 15 | garcinone C IC50=104.8±3.5 μm TEAC=0.4000 |
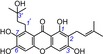
|
30 | fuscaxanthone C IC50=51998.6±1958.8 μm TEAC=0.0008 |

|
| 31 | 1,2,3,7‐tetramethoxyxanthone IC50=107427.6±20119.3 μm TEAC=0.0004 |

|
[a] TEAC value is defined as the Trolox‐equivalent antioxidant potential and is calculated as: IC50,Trolox/IC50,xanthone. IC50(Trolox)=42.0±1.6 μm; the IC50 value is expressed as mean±SD (n=3) and was obtained from the FRAP assay dose–response curves, as shown in Suppl. 2 in the Supporting Information. Xanthones 1–31 were all ranked and then numbered, in line with their TEAC values.
Antioxidant action, however, has been reported to include several different mechanisms, such as single‐electron transfer (SET), electron transfer–proton transfer (ET‐PT), hydrogen‐atom transfer (HAT), proton coupled with electron transfer (PCET), and sequential proton loss electron transfer (SPLET).27 Essentially, all of these mechanisms involve electron transfer (ET).28 The xanthones family, however, has been suggested to possess ET potential by theoretical studies.29 Experimentally, the common method to evaluate the ET potential is the ferric reducing antioxidant power (FRAP),30 which is conducted at pH 3.6. Such acidity effectively suppresses H+ transfer from the phenolic antioxidant.31, 32, 33 In fact, the FRAP assay has been successfully used to evaluate the ET potential of 18 natural flavonoids and 3 known antioxidants (i.e. resveratrol, Trolox, and uric acid).20 In this study, the selected xanthones account for about 1/10 of the current xanthones. Thus, this study systematically outlines the structure–activity relationships of the ET potential of antioxidant xanthones.
It is well known that the xanthone core is built by one planar γ‐pyrone ring that is symmetrically fused by two planar benzo rings at each side. Symmetry and planarity considerably simplify the antioxidant structure–activity relationship. Thus, a systematic structure–activity relationship analysis may provide the possibility to predict easily the ET potential of other xanthones.
2. Results and Discussion
To avoid any systematic errors from the experimental conditions, Trolox‐equivalent antioxidant capacity (TEAC) values are introduced in this study.34 As shown in Table 1, among the 31 xanthones, there were significant differences in the TEAC values: the highest TEAC value was 0.9481, whereas the lowest TEAC value was 0.0002. These differences are proposed to be associated with several of the aforementioned structural factors, including various forms of the phenolic OH group, methoxy group, sugar residue, isoprenyl group, cyclized isoprenyl group, and isopentanol group.
To quantify the effect of the total number of phenolic OH groups towards the ET potential, a correlation graph was plotted between the TEAC values and the amount of phenolic OH groups. As shown in Figure S1 in the Supporting Information, the correlation coefficient (R value) was 0.62325, and consequently, the ET potentials of the xanthones are related to the total phenolic OH groups to a certain degree. Therefore, 1,2,3,7‐tetramethoxyxanthone (31) without any phenolic OH groups exhibited the lowest TEAC value (0.0004). Norathyriol (1, TEAC=0.9481) with 1,3,6,7‐tetrahydroxy groups possessed a higher TEAC value than 1,6,7‐trihydroxyxanthone (9, TEAC=0.5841), whereas 1,3,5,6‐tetrahydroxyxanthone (6, TEAC=0.6688) exhibited a higher TEAC value than 1,5,6‐trihydroxyxanthone (10, TEAC=0.4941). This also agrees with the previous observation that phenolic OH groups were the source of the antioxidant potential of phenolic compounds.35, 36
However, an R value of 0.62325 is not very high, which suggested that the ET potentials of the antioxidant xanthones may also be affected by other factors, such as the distribution of the phenolic OH groups. As shown in Table 1, the distribution of the phenolic OH groups can be grouped into five classes, that is, single phenolic OH group, ortho‐dihydroxy moiety (catechol moiety), para‐dihydroxy moiety (hydroquinone moiety), meta‐dihydroxy moiety (resorcinol moiety), and transannular dihydroxy moiety.2, 22, 23
A typical single phenolic OH xanthone is 2‐hydroxyxanthone (20), which showed a very low TEAC value (0.0092, Table 1). Two other xanthones with a single phenolic OH group also possessed very low TEAC values, namely, 5‐hydroxy‐1‐methoxyxanthone (24, TEAC=0.0074) and fuscaxanthone C (30, TEAC=0.0008). These data demonstrate that a single phenolic OH group is not able to achieve high ET potentials, despite the fact that this group plays an essential role in the ET potential.
Besides a single phenolic OH group, two phenolic OH groups can also be found in xanthones.22, 23 The two phenolic OH groups, however, can be further divided into three classes, namely, hydroquinone, catechol, and resorcinol moieties. The hydroquinone moiety has only one form, that is, the 5,8‐dihydroxy moiety (sometimes numbered as the 1,4‐dihydroxy moiety) (Table 1).22, 23 In this study, gartanin (5, TEAC=0.7463), a xanthone with a hydroquinone moiety, was observed to possess a TEAC value that was 97 times higher (0.7463/0.0077) than that of its analogue 8‐desoxygartanin (23, TEAC=0.0077), which lacks an 8‐OH group to form the hydroquinone moiety. Similarly, the TEAC value of subelliptenone G (8, TEAC=0.5841) was found to be 30.3 times higher (0.5841/0.0193) than that of its analogue 1,5‐dihydroxyxanthone (17, TEAC=0.0193). These large differences indicate that the formation of the hydroquinone moiety could markedly improve the ET potential and that the hydroquinone moiety plays a critical role during the ET process in xanthones. This is further supported by data from another three xanthones with a hydroquinone moiety, including 1,3,5,8‐tetrahydroxyxanthone (4, TEAC=0.8264), bellidifolin (12, TEAC=0.4626), and 1,5,8‐trihydroxy‐3‐methoxy‐2‐prenylxanthone (13, TEAC=0.4384).
Previously, several studies reported that the catechol moiety played a critical role in phenolic antioxidants.4, 5, 6, 7, 8, 9, 10, 11, 12, 13, 14, 15, 16, 17, 18, 20, 37, 38, 39 However, Woodman insisted on a minor role of the catechol moiety.40 In the present study, ten catecholic xanthones were found to exhibit very high TEAC values, including norathyriol (1, TEAC=0.9481), mangiferin (2, TEAC=0.9170), isomangiferin (3, TEAC=0.8317), 1,3,5,6‐tetrahydroxyxanthone (6, TEAC=0.6688), 1,2,5‐trihydroxyxanthone (7, TEAC=0.5949), 1,6,7‐trihydroxyxanthone (9, TEAC=0.5841), 1,5,6‐trihydroxyxanthone (10, TEAC=0.4941), isojacareubin (11, TEAC=0.4839), γ‐mangostin (14, TEAC=0.4149), and garcinone C (15, TEAC=0.4000) (Table 1). By comparison, some xanthones without enough OH groups to construct the catechol moiety always exhibited very low TEAC values. For example, the ET potential of lancerin (29, TEAC=0.0022), lacking a 6‐OH group, was 378 times lower (0.8317/0.0022) than that of catecholic isomangiferin (3, TEAC=0.8317), and the ET potential of 1,5‐dihydroxyxanthone (17, TEAC=0.0193), without a 6‐OH group, was roughly 25 times lower (0.4941/0.0193) than that of catecholic 1,5,6‐trihydroxyxanthone (10, TEAC=0.4941). These comparisons strongly suggest that if a phenolic OH group is added to the xanthone to construct a catechol moiety, the ET potential is greatly enhanced. Clearly, our study supports the mainstream views and contradicts the opinion of Woodman.40
The catechol moiety, however, can be further classified into a 5,6‐catechol moiety, 6,7‐catechol moiety, and 7,8‐catechol moiety (sometimes numbered as 1,2‐catechol moiety).22, 23, 41 As seen in Table 1, the median inhibitory concentration (IC50) values of the 1,2‐catecholic xanthone 1,2,5‐trihydroxyxanthone (7, IC50=70.6±3.8 μm), 6,7‐catecholic xanthone 1,6,7‐trihydroxyxanthone (9, IC50=71.9±1.8 μm), and 5,6‐catecholic xanthone 1,5,6‐trihydroxyxanthone (10, IC50=85.3±4.6 μm) are not significantly different (p>0.05). Thus, the ET potential of the catechol moiety is deduced to have no positional effect. As Table 1 shows, the xanthones with a hydroquinone moiety are alternatively ranked with xanthones having a 5,6‐catechol moiety, 6,7‐catechol moiety, or 7,8‐catechol moiety. This implies that the four moieties (hydroquinone, 5,6‐catechol, 6,7‐catechol, and 7,8‐catechol moieties) are generally identical to each other with respect to their effects on the ET potential.
The resorcinol moiety can also be found in xanthones. In this study, a typical resorcinolic xanthone, cowaxanthone B (19), was observed to possess a low TEAC value (0.0099, Table 1). Even with the addition of a phenolic OH group, resorcinolic xanthones, such as α‐mangostin (18, TEAC=0.0101), garcinone D (21, TEAC=0.0080), neomangiferin (22, TEAC=0.0077), 8‐desoxygartanin (23, TEAC=0.0077), 7‐O‐methylmangiferin (25, TEAC=0.0071), cratoxylone (26, TEAC=0.0069), and lancerin (29, TEAC=0.0022), still gave low TEAC values. This clearly indicated a minor role of the resorcinol moiety during the ET process of the antioxidant xanthones.
Taken together, the hydroquinone moiety and catechol moiety (including the 5,6‐catechol, 6,7‐catechol, and 7,8‐catechol moieties) dominate the ET potential, whereas the resorcinol moiety plays a negligible role. Thus, there is a clear boundary between the TEAC values of xanthones 1–15 (TEAC=0.9481–0.4000) having either a hydroquinone moiety or a catechol moiety and xanthones 16–31 (TEAC=0.0202–0.0004) lacking a hydroquinone moiety or a catechol moiety. Across the boundary, the TEAC values suddenly decrease from 0.4000 to 0.0202 (Table 1).
The last form of the phenolic dihydroxy moiety is the transannular dihydroxy moiety. As seen in euxanthone (16, Table 1), two phenolic OH groups (i.e. 1‐OH and 7‐OH) sit at two benzo rings. The two phenolic OH groups may remotely interact with each other and construct a transannular dihydroxy moiety. Such a moiety can also be found in 1,5‐dihydroxyxanthone (17). As seen in Table 1, two xanthones (16, TEAC=0.0202; 17, TEAC=0.0193) displayed much lower TEAC values than xanthones with a catechol or hydroquinone moiety (1–15, TEAC=0.9481–0.4000). Consequently, the transannular dihydroxy moiety plays an insignificant role in the ET potential relative to the role played by the catechol or hydroquinone moiety. Nevertheless, the transannular dihydroxy moiety is superior to a single phenolic OH group; hence, euxanthone (16, TEAC=0.0202) had a higher TEAC value than 2‐hydroxyxanthone (20, TEAC=0.0092).
In the above discussion, we studied seven phenolic OH structures, including the hydroquinone moiety, 6,7‐catechol moiety, 5,6‐catechol moiety, 7,8‐catechol moiety, single phenolic OH moiety, resorcinol moiety, and transannular dihydroxy moiety. The ET potentials of the former four were much higher than those of the latter three. The difference can be attributed to the degree of stability of their oxidized products after the ET reaction.
It was reported that a hydroquinone molecule could be transformed into a para‐benzoquinone.42 Due to the stability of para‐benzoquinone, the hydroquinone molecule itself exhibits a high ET potential. The catechol moiety, however, was suggested to be oxidized to ortho‐benzoquinone by Fe3+ under acidic conditions.43 According to relevant literature,27, 42, 43, 44 the Fe3+‐reducing reactions of the above four moieties can be described as shown in Figure 1, in which gartanin (5), mangiferin (2), 1,2,5‐trihydroxyxanthone (7), and 1,5,6‐trihydroxyxanthone (10) are used as references. However, in the FRAP assay, the strong acidic conditions (pH 3.6) may make benzoquinone combine with H+ to yield protonated benzoquinone, a salt similar to an oxonium ion. The situation is quite different from that under neutral conditions or physiological conditions (pH 7.4). A theoretical study indicated that, in physiological (or neutral) aqueous solution, xanthones may undergo deprotonation (i.e. proton transfer, PT) instead of ET.29 Thus, in physiological (or neutral) aqueous solution, ET and PT are usually inseparable. However, the topic concerning PT is out of the scope of the present study.
Figure 1.
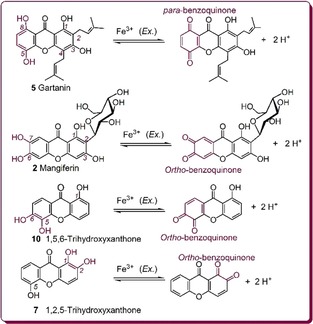
Proposed Fe3+‐reducing reactions of hydroquinone xanthone gartanin (5), 6,7‐catecholic xanthone mangiferin (2), 1,2‐catecholic xanthone 1,2,5‐trihydroxyxanthone (7), and 5,6‐catecholic xanthone 1,5,6‐trihydroxyxanthone (10).
The reaction of the FRAP assay can also explain the weak ET potentials of xanthones containing a single phenolic OH group, a resorcinol moiety, and a transannular dihydroxy moiety. A single phenolic OH group can generate a semiquinone moiety after it is oxidized by free radicals or oxidants.45 Due to the instability of the semiquinone moiety,46 xanthones (and other phenolics) with a single phenolic OH group usually present lower ET potentials. The reason why the resorcinol moiety is also weak is that the oxidized product, meta‐benzoquinone, is transient and unstable under normal conditions.47, 48 The weakness of the transannular dihydroxy moiety, however, may be attributed to the nonaromaticity of the γ‐pyrone ring, which blocks π–π conjugation between two aromatic benzo rings. Even if the transannular dihydroxy moiety is oxidized, it is impossible to form a stable transannular quinone (similar to 2,6‐naphthaquinone).
Methylation is a physiological process catalyzed by O‐methyltransferases in plants. Methylation of the phenolic OH group can yield a methoxy group, which is able to form a methyl ether.49, 50 Clearly, such methylation reduces the amount of phenolic OH groups, which thereby reduces the ET potential of the xanthone. This effect was observed in several pairs of xanthones in this study, for example, 1,3,5,8‐tetrahydroxyxanthone (4, TEAC=0.8264) and its methyl ether bellidifolin (12, TEAC=0.4626), γ‐mangostin (14, TEAC=0.4149) and its methyl ether α‐mangostin (18, TEAC=0.0101), and cowaxanthone B (19, TEAC=0.0099) and its methyl ether fuscaxanthone C (30, TEAC=0.0008).
If methylation were to destroy the catechol moiety (or hydroquinone moiety), the TEAC value would be considerably reduced. A typical example is the pair of mangiferin (2, TEAC=0.9170) and 7‐O‐methylmangiferin (25, TEAC=0.0071). As seen in Table 1, 7‐methylation destroyed the 6,7‐catechol moiety of mangiferin, which thereby reduced the TEAC value by a factor of about 129 (0.9170/0.0071). Multiple methylations are presumed to destroy the catechol or hydroquinone moiety. Therefore, multiple methylations could also markedly decrease the ET potential. For example, after two methylations, γ‐mangostin (14, TEAC=0.4149) was transformed into β‐mangostin (28, TEAC=0.0025), and its TEAC value was reduced by a factor of 166 (0.4149/0.0025).
The effect of the sugar residue was observed by comparing norathyriol (1, TEAC=0.9481) with its 2‐C‐glycoside mangiferin (2, TEAC=0.9170) and by comparing norathyriol with its 4‐C‐glycoside isomangiferin (3, TEAC=0.8317). Both comparisons indicated that the C‐glycoside slightly decreased the ET potential. The comparison between mangiferin (2) and isomangiferin (3), however, further suggested that the site of the C‐glycoside only slightly affected the ET potential.
The isoprenyl moiety occasionally occurs in other phenolic antioxidants, such as flavonoids,51 lignanoids, coumarins, and stilbenes.1, 14, 37, 51, 52, 53, 54 However, until now there have not been any systematic reviews mentioning its role in antioxidant (especially ET) potential.55 In the present study, the isoprenyl group was shown to decrease slightly the ET potential. For example, the isoprenylated xanthone gartanin (5, TEAC=0.7643) displayed a lower TEAC value than its parent norathyriol (1, TEAC=0.9481). A similar effect was observed in the pair consisting of bellidifolin (12, TEAC=0.4626) and its isoprenylation derivative 1,5,8‐trihydroxy‐3‐methoxy‐2‐prenylxanthone (13, TEAC=0.4384).
Similar to isoprenyl, the isopentanol moiety was also found to have a minor effect. In fact, the ET potential of α‐mangostin (18, TEAC=0.0101) was similar to that of garcinone D (21, TEAC=0.0080), and γ‐mangostin (14, TEAC=0.4149) and its analogue garcinone C (15, TEAC=0.4000) also had similar ET potentials.
The isoprenyl group in plants can be cyclized under enzyme catalysis.56 As seen in Table 1, 3‐isomangostin (27, TEAC=0.0065) can be considered as an isoprenyl‐cyclized product of α‐mangostin (18, TEAC=0.0101). Through isoprenyl cyclization, α‐mangostin loses the 3‐OH group; thus, the resorcinol moiety was transformed into a transannular dihydroxy moiety. Correspondingly, the TEAC value was lowered from 0.0101 to 0.0065.
To summarize, a sugar residue, the isoprenyl group, the isopentanol group, and a cyclized isoprenyl moiety can slightly decrease the ET potential. Compared with the dominant role of the hydroquinone or catechol moiety, their roles may be negligible. From a fundamental organic chemistry perspective, these effects might be due to electron and steric effects.57 Of course, detailed mechanisms are to be elucidated in future work. Notably, if the sugar residue is linked to the O atom of the hydroquinone or catechol moiety, it may break the moiety and result in a significantly decreased ET potential. For example, upon glycosidation of mangiferin (2, TEAC=0.9170) to 7‐O‐glycoside neomangiferin (22, TEAC=0.0077), the ET potential decreased by a factor of 119 (0.9170/0.0077).
The above findings (especially the dominant role of the hydroquinone or catechol moiety) provide the possibility to predict easily the ET potential of xanthones. As seen in Table 2, our predictions of 32–35 generally follow the values from the literature. This can be attributed to the simplicity of the xanthone core.
Table 2.
Predictions of xanthones 32–36.
| Compd | Xanthone | Prediction | Literature evidence[a] |
|---|---|---|---|
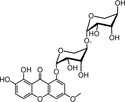
| 32 |

|
strong, similar to 7 | TEAC=0.33958 |
| 33 |
|
strong, similar to 7 | TEAC=0.579358 |
| 34 |

|
weak, similar to 30 | TEAC=0.071858 |
| 35 |
|
weak, similar to 31 | TEAC=0.000759 |
| 36 |
|
strong, similar to 15 | no data available |
[a] TEAC values were obtained by converting the data in the references, such as butylated hydroxytoluene (BHT). IC50(BHT)=502.8±4.9 μm, TEAC=0.0836.
Unlike the xanthone core, the flavonoid core is very complex. There are several subtypes: flavone, isoflavone, flavonol, isoflavonol, dihydroflavone, dihydroisoflavone, and so on. Moreover, all subtypes are composed of a dihedral angle between the B ring and the A/C fused rings. Thus, it is difficult to predict the ET (or antioxidant) potential of flavonoids, regardless of the amount of antioxidant structure–activity relationship studies.4, 5, 6, 7, 8, 9, 10, 11, 12, 13, 14, 15, 16, 17, 18, 19, 20, 40
3. Conclusions
The electron‐transfer potential of xanthones was found to be dominated by any of four moieties, namely, the hydroquinone, 5,6‐catechol, 6,7‐catechol, and 7,8‐catechol moieties. Other structures were found to play minor roles, including a single phenolic OH group, the resorcinol moiety, the transannular dihydroxy moiety, a methoxy group, a sugar residue, an isoprenyl group, a cyclized isoprenyl moiety, and an isopentanol group. On this basis, the electron‐transfer potential of xanthones could be easily predicted.
Experimental Section
General Methods
(±)‐6‐Hydroxyl‐2,5,7,8‐tetramethlychromane‐2‐carboxylic acid (Trolox) and 2,4,6‐tripyridyltriazine (TPTZ) were purchased from Sigma–Aldrich Shanghai Trading Co. (Shanghai, China). Norathyriol (CAS 3542‐72‐1, C13H8O6, MW=260.2, purity 98 %, Suppl. 3 in the Supporting Information) was purchased from BioBioPha Co., Ltd. (Kunming, China). Mangiferin (CAS 4773‐96‐0, C19H18O11, MW=422.3, 99 %, Suppl. 4), isomangiferin (CAS 24699‐16‐9, C19H18O11, MW=422.3, 99 %, Suppl. 5), 1,3,5,8‐tetrahydroxyxanthone (CAS 2980‐32‐7, C13H8O6, MW=260.2, 99 %, Suppl. 6), and gartanin (CAS 33390‐42‐0, C23H24O6, MW=396.4, 90 %, Suppl. 7) were purchased from Chengdu Biopurify Phytochemicals Ltd. (Chengdu, China). 1,3,5,6‐Tetrahydroxyxanthone (CAS 5084‐31‐1, C13H8O6, MW=260.2, purity 98 %, Suppl. 8), 1,5,8‐trihydroxy‐3‐methoxy‐2‐prenylxanthone (CAS 110187‐11‐6, C19H18O6, MW=342.3, 98 %, Suppl. 9), 1,2,5‐trihydroxyxanthone (CAS 156640‐23‐2, C13H8O5, MW=244.2, purity 98 %, Suppl. 10), subelliptenone G (CAS 162473‐22‐5, C13H8O5, MW=244.2, purity 97 %, Suppl. 11), 1,6,7‐trihydroxyxanthone (CAS 25577‐04‐2, C13H8O5, MW=244.2, purity 98 %, Suppl. 12), 1,5,6‐trihydroxyxanthone (CAS 5042‐03‐5, C13H8O5, MW=244.2, purity 98 %, Suppl. 13), and isojacareubin (CAS 50597‐93‐8, C18H14O6, MW=326.3, purity 97 %, Suppl. 14) were purchased from BioBioPha Co., Ltd. (Kunming, China). γ‐Mangostin (CAS 31271‐07‐5, C23H24O6, MW=396.4, 98 %, Suppl. 15), bellidifolin (CAS 2798‐25‐6, C14H10O6, MW=274.2, 99 %, Suppl. 16), and garcinone C (CAS 76996‐27‐5, C23H26O7, MW=414.5, 99 %, Suppl. 17) were purchased from Chengdu Biopurify Phytochemicals Ltd. (Chengdu, China). Euxanthone (CAS 529‐61‐3, C13H8O4, MW=228.2, purity 98 %, Suppl. 18) and 1,5‐dihydroxyxanthone (CAS 14686‐65‐8, C13H8O4, MW=228.2, purity 98 %, Suppl. 19) were from BioBioPha Co., Ltd. (Kunming, China). α‐Mangostin (CAS 6147‐11‐1, C24H26O6, MW=410.5, purity 98 %, Suppl. 20) and cowaxanthone B (CAS 212842‐64‐3, C25H28O6, MW=424.5, purity 97 %, Suppl. 21) were purchased from Chengdu Biopurify Phytochemicals Ltd. (Chengdu, China). 2‐Hydroxyxanthone (CAS 1915‐98‐6, C13H8O3, MW=212.2, purity 98 %, Suppl. 22) was purchased from BioBioPha Co., Ltd. (Kunming, China). Garcinone D (CAS 107390‐08–9, C24H28O7, MW=428.5, purity 98 %, Suppl. 23) was purchased from Chengdu Biopurify Phytochemicals Ltd. (Chengdu, China). Neomangiferin (CAS 64809‐67‐2, C25H28O16, MW=584.5, purity 99 %, Suppl. 24) and 8‐desoxygartanin (CAS 33390‐41‐9, C23H24O5, MW=380.4, purity 99 %, Suppl. 25) were purchased from Chengdu Biopurify Phytochemicals Ltd. (Chengdu, China). 5‐Hydroxy‐1‐methoxyxanthone (CAS 27770‐13‐4, C14H10O4, MW=242.2, purity 98 %, Suppl. 26) was purchased from BioBioPha Co., Ltd. (Kunming, China). 7‐O‐Methylmangiferin (CAS 31002‐12‐7, C20H20O11, MW=436.4, purity 99 %, Suppl. 27), 3‐isomangostin (CAS 19275‐46‐8, C24H26O6, MW=410.5, purity 98 %, Suppl. 28), cratoxylone (CAS 149155‐01‐1, C24H28O7, MW=428.5, 97 %, Suppl. 29), β‐mangostin (CAS 20931‐37‐7, C25H28O6, MW=424.5, purity 97 %, powder, Suppl. 30), lancerin (CAS 81991‐99‐3, C19H18O10, MW=406.3, purity 99 %, Suppl. 31), fuscaxanthone C (CAS 15404‐76‐9, C26H30O6, MW=438.5, 99 %, Suppl. 32), and 1,2,3,7‐tetramethoxyxanthone (CAS 22804‐52‐0, C17H16O6, MW=316.3, 99 %, Suppl. 33) were purchased from Chengdu Biopurify Phytochemicals Ltd. (Chengdu, China); FeCl3 and other reagents were of analytical grade.
Biological Assays
The FRAP assay was initially established by Benzie and Strain.30 However, the experimental protocol was modified based on a previous report.60 Briefly, the FRAP reagent was prepared freshly by mixing 10 mm TPTZ, 20 mm FeCl3, and 0.29 m acetate–sodium acetate buffer (pH 3.6) in a ratio of 1:1:10. The test sample was added to 95 % methanol followed by the FRAP reagent. After a 1 h incubation at ambient temperature, the mixture was measured at λ=595 nm by using a microplate reader (Multiskan FC, Thermo Scientific, Shanghai, China). The relative reducing power of the sample was calculated by using the following formula [Eq. (1)]:
| (1) |
in which A max is the maximum value in the whole experiment (observed as 1.288 in this study), A min is the minimum absorbance in the test (observed as 0.002 in this study), and A is the absorbance of the sample.
Each experiment was performed in triplicate, and the data are recorded as mean±SD (standard deviation). The dose–response curves were plotted by using Origin 6.0 professional software (OriginLab, Northampton, MA, USA). Statistical comparisons were made by one‐way ANOVA to detect significant difference by using SPSS 13.0 (SPSS Inc., Chicago, IL) for windows. p<0.05 was considered to be statistically significant.
Conflict of interest
The authors declare no conflict of interest.
Supporting information
As a service to our authors and readers, this journal provides supporting information supplied by the authors. Such materials are peer reviewed and may be re‐organized for online delivery, but are not copy‐edited or typeset. Technical support issues arising from supporting information (other than missing files) should be addressed to the authors.
Supplementary
Acknowledgements
This work was supported by the National Nature Science Foundation of China (81573558), Guangdong Science and Technology Project (2017A030312009, 2017A050506043), and Guangdong Provincial Education Office Science and Technology Project (2017KCXTD007).
X. Li, Q. Jiang, B. Chen, X. Luo, D. Chen, ChemistryOpen 2018, 7, 730.
Contributor Information
Prof. Xican Li, Email: lixc@gzucm.edu.cn.
Prof. Dongfeng Chen, Email: chen888@gzucm.edu.cn
References
- 1. Qin H. L., Yu D. Q., 1 H-NMR Spectroscopic Databook of Natural Products, 1st ed., Chemical Industry Press, Beijing, 2011, pp. 881–1080. [Google Scholar]
- 2. Yang J. S., 13 C-NMR Spectroscopic Databook of Natural Products, Chemical Industry Press, Beijing, 2011, pp. 1630–1883. [Google Scholar]
- 3. Li T. Z., Zhang W. D., Yang G. J., Liu W. Y., Liu R. H., Zhang C., Chen H. S., J. Asian Nat. Prod. Res. 2006, 8, 401–409. [DOI] [PubMed] [Google Scholar]
- 4. Heim K. E., Tagliaferro A. R., Bobilya D. J., J. Nutr. Biochem. 2002, 13, 572–584. [DOI] [PubMed] [Google Scholar]
- 5. Durand A. C., Farce A., Carato P., Dilly S., Yous S., Berthelot P., Chavatte P., J. Enzyme Inhib. Med. Chem. 2007, 22, 556–562. [DOI] [PubMed] [Google Scholar]
- 6. Rice-Evans C. A., Miller N. J., Paganga G., Free Radical Biol. Med. 1996, 20, 933–956. [DOI] [PubMed] [Google Scholar]
- 7. Zuvela P., David J., Wong M. W., J. Comput. Chem. 2018, 39, 953–963. [DOI] [PubMed] [Google Scholar]
- 8. Cherrak S. A., Mokhtari-Soulimane N., Berroukeche F., Bensenane B., Cherbonnel A., Merzouk H., Elhabiri M., PLoS One 2016, 11, e0165575. [DOI] [PMC free article] [PubMed] [Google Scholar]
- 9. Choi J., Chung H. Y., Kang S. S., Jung M. J., Kim J. W., No J. K., Jung H. A., Phytother. Res. 2002, 16, 232–235. [DOI] [PubMed] [Google Scholar]
- 10. Cos P., Ying L., Calomme M., Hu J. P., Cimanga K., Poel B. V., Pieters L., Vlietinck A. J., Berghe D. V., J. Nat. Prod. 1998, 61, 71–76. [DOI] [PubMed] [Google Scholar]
- 11. Rahman M. M., Ichiyanagi T., Komiyama T., Hatano Y., Konishi T., Free Radical Res. 2006, 40, 993–1002. [DOI] [PubMed] [Google Scholar]
- 12. Xie H., Li X., Ren Z., Qiu W., Chen J., Jiang Q., Chen B., Chen D., Molecules 2018, 23, 179. [DOI] [PMC free article] [PubMed] [Google Scholar]
- 13. Tournaire C., Croux S., Maurette M. T., Beck I., Hocquaux M., Braun A. M., Oliveros E., J. Photochem. Photobiol. B 1993, 19, 205–215. [DOI] [PubMed] [Google Scholar]
- 14. Ali H. M., Almagribi W., Al-Rashidi M. N., Food Chem. 2016, 194, 1275–1282. [DOI] [PubMed] [Google Scholar]
- 15. Singh M., Kaur M., Silakari O., Eur. J. Med. Chem. 2014, 84, 206–239. [DOI] [PubMed] [Google Scholar]
- 16. Mendes A. P., Borges R. S., Neto A. M., de Macedo L. G., da Silva A. B., J. Mol. Model. 2012, 18, 4073–4080. [DOI] [PubMed] [Google Scholar]
- 17. Hu J. P., Calomme M., Lasure A., De Bruyne T., Pieters L., Vlietinck A., Vanden Berghe D. A., Biol. Trace Elem. Res. 1995, 47, 327–331. [DOI] [PubMed] [Google Scholar]
- 18. Cao G., Sofic E., Prior R. L., Free Radical Biol. Med. 1997, 22, 749–760. [DOI] [PubMed] [Google Scholar]
- 19. Seyoum A., Asres K., Elfiky F. K., Phytochemistry 2006, 67, 2058–2070. [DOI] [PubMed] [Google Scholar]
- 20. Firuzi O., Lacanna A., Petrucci R., Marrosu G., Saso L., Biochimica. et Biophysica. Acta. 2005, 1721, 174–184. [DOI] [PubMed] [Google Scholar]
- 21. Panda S. S., Chand M., Sakhuja R., Jain S. C., Curr. Med. Chem. 2013, 20, 4481–4507. [DOI] [PubMed] [Google Scholar]
- 22. Qin H. L., Yu D. Q., 1 H-NMR Spectroscopic Databook of Natural Products, 1st ed., Chemical Industry Press, Beijing, 2011, pp. 1061–1078. [Google Scholar]
- 23. Yang J. S., 13 C-NMR Spectroscopic Databook of Natural Products, Chemical Industry Press, Beijing, 2011, pp. 1807–1838. [Google Scholar]
- 24. Li T., Zhang H., Chem. Pharm. Bull. 2008, 56, 807–814. [DOI] [PubMed] [Google Scholar]
- 25. Guerreiro E., Kavka J., Giordano O. S., Phytochemistry 1982, 21, 2601–2602. [Google Scholar]
- 26. Suksamrarn A., Poomsing P., Aroonrerk N., Punjanon T., Suksamrarn S., Kongkun S., Arch. Pharmacal Res. 2003, 26, 816–820. [DOI] [PubMed] [Google Scholar]
- 27. Li X., Gao Y., Li F., Liang A., Xu Z., Bai Y., Mai W., Han L., Chen D., Chem.-Biol. Interact. 2014, 219, 221–228. [DOI] [PubMed] [Google Scholar]
- 28. Apak R., Ozyurek M., Guclu K., Capanoglu E., J. Agric. Food Chem. 2016, 64, 997–1027. [DOI] [PubMed] [Google Scholar]
- 29. Martínez A., Hernández-Marin E., Galano A., Food Funct. 2012, 3, 442–450. [DOI] [PubMed] [Google Scholar]
- 30. Benzie I. F. F., Strain J. J., Anal. Biochem. 1996, 239, 70–76. [DOI] [PubMed] [Google Scholar]
- 31. Gülçin I., Methods Mol. Biol. 2015, 1208, 233–246. [DOI] [PubMed] [Google Scholar]
- 32. Huang D., Ou B., Prior R. L., J. Agric. Food Chem. 2005, 53, 1841–1856. [DOI] [PubMed] [Google Scholar]
- 33. Gulcin I., Arch. Toxicol. 2012, 86, 345–391. [DOI] [PubMed] [Google Scholar]
- 34. Arts M. J., Haenen G. R., Voss H. P., Bast A., Food Chem. Toxicol. 2004, 42, 45–49. [DOI] [PubMed] [Google Scholar]
- 35. Li X., Chen D., Mai Y., Wen B., Wang X., Nat. Prod. Res. 2012, 26, 1050–1053. [DOI] [PubMed] [Google Scholar]
- 36. Mohamed G. A., Ibrahim S. R., Shaaban M. I., Ross S. A., Fitoterapia 2014, 98, 215–221. [DOI] [PubMed] [Google Scholar]
- 37. Li X., Li K., Xie H., Xie Y., Li Y., Zhao X., Jiang X., Chen D., Molecules 2018, 23, 222. [DOI] [PMC free article] [PubMed] [Google Scholar]
- 38. De La Cruz J. P., Ruiz-Moreno M. I., Guerrero A., Lopez-Villodres J. A., Reyes J. J., Espartero J. L., Labajos M. T., Gonzalez-Correa J. A., J. Nutr. Biochem. 2015, 26, 549–555. [DOI] [PubMed] [Google Scholar]
- 39. Liu J., Li X., Lin J., Li Y., Wang T., Jiang Q., Chen D., BMC Complementary Altern. Med. 2016, 16, 423. [DOI] [PMC free article] [PubMed] [Google Scholar]
- 40. Woodman O., Meeker W., Boujaoude M., J. Cardiovasc. Pharmacol. 2005, 46, 302–309. [DOI] [PubMed] [Google Scholar]
- 41. Li X., Jiang Q., Wang T., Liu J., Chen D., Molecules 2016, 21, 1246. [DOI] [PMC free article] [PubMed] [Google Scholar]
- 42. Yamaguchi L. F., Lago J. H., Tanizaki T. M., Mascio P. D., Kato M. J., Phytochemistry 2006, 67, 1838–1843. [DOI] [PubMed] [Google Scholar]
- 43. Fullenkamp D. E., Barrett D. G., Miller D. R., Kurutz J. W., Messersmith P. B., RSC Adv. 2014, 4, 25127–25134. [DOI] [PMC free article] [PubMed] [Google Scholar]
- 44. Ali H. M., Ali I. H., Food Chem. 2018, 243, 145–150. [DOI] [PubMed] [Google Scholar]
- 45. Li X., Han L., Li Y., Zhang J., Chen J., Lu W., Zhao X., Lai Y., Chen D., Wei G., Chem. Pharm. Bull. 2016, 64, 319–325. [DOI] [PubMed] [Google Scholar]
- 46. van Maanen J. M., Verkerk U. H., Broersen J., Lafleur M. V., De Vries J., Retel J., Pinedo H. M., Free Radical Res. Commun. 1988, 4, 371–384. [DOI] [PubMed] [Google Scholar]
- 47. Chen B., Hrovat D. A., Deng S. H., Zhang J., Wang X. B., Borden W. T., J. Am. Chem. Soc. 2014, 136, 3589–3596. [DOI] [PubMed] [Google Scholar]
- 48. Roithová J., Schroder D., Schwarz H., Angew. Chem. Int. Ed. 2005, 44, 3092–3096; [DOI] [PubMed] [Google Scholar]; Angew. Chem. 2005, 117, 3152–3156. [Google Scholar]
- 49. Zhou J. M., Gold N. D., Martin V. J., Wollenweber E., Ibrahim R. K., Biochim. Biophys. Acta. 2006, 1760, 1115–1124. [DOI] [PubMed] [Google Scholar]
- 50. Berim A., Hyatt D. C., Gang D. R., Plant Physiol. 2012, 160, 1052–1069. [DOI] [PMC free article] [PubMed] [Google Scholar]
- 51. Chen X., Mukwaya E., Wong M. S., Zhang Y., Pharm. Biol. 2014, 52, 655–660. [DOI] [PubMed] [Google Scholar]
- 52. Chen D. F., Li X., Xu Z., Liu X., Du S. H., Li H., Zhou J. H., Zeng H. P., Hua Z. C., J. Med. Food 2010, 13, 967–975. [DOI] [PubMed] [Google Scholar]
- 53. Li X., Lin J., Chen L., Lu W., Chen X., Han L., Chen D., Bull. Korean Chem. Soc. 2014, 35, 1633–1638. [Google Scholar]
- 54. Li X., Liu J., Zhao Z., Wang T., Lin J., Chen D., Chem. Lett. 2016, 45, 743–745. [Google Scholar]
- 55. Marin M., Manez S., Curr. Med. Chem. 2013, 20, 272–279. [DOI] [PubMed] [Google Scholar]
- 56. Ozaki T., Zhao P., Shinada T., Nishiyama M., Kuzuyama T., J. Am. Chem. Soc. 2014, 136, 4837–4840. [DOI] [PubMed] [Google Scholar]
- 57. Graham S., T. W., Fryhle B. C., Organic Chemistry, 8th ed., Chemical Industry Press, Beijing, 2004, pp. 1015–1016. [Google Scholar]
- 58. Mahendran G., Manoj M., Prasad K. J. R., Bai V. N., Food Sci. Hum. Wellness 2015, 4, 169–179. [Google Scholar]
- 59. Ahmad A., Singh D. K., Fatima K., Tandon S., Luqman S., Ind. Crops Prod. 2014, 58, 125–132. [Google Scholar]
- 60. Li X., Xie H., Jiang Q., Wei G., Lin L., Li C., Ou X., Yang L., Xie Y., Fu Z., Liu Y., Chen D., Cell. Mol. Biol. Lett. 2017, 22, 31. [DOI] [PMC free article] [PubMed] [Google Scholar]
Associated Data
This section collects any data citations, data availability statements, or supplementary materials included in this article.
Supplementary Materials
As a service to our authors and readers, this journal provides supporting information supplied by the authors. Such materials are peer reviewed and may be re‐organized for online delivery, but are not copy‐edited or typeset. Technical support issues arising from supporting information (other than missing files) should be addressed to the authors.
Supplementary