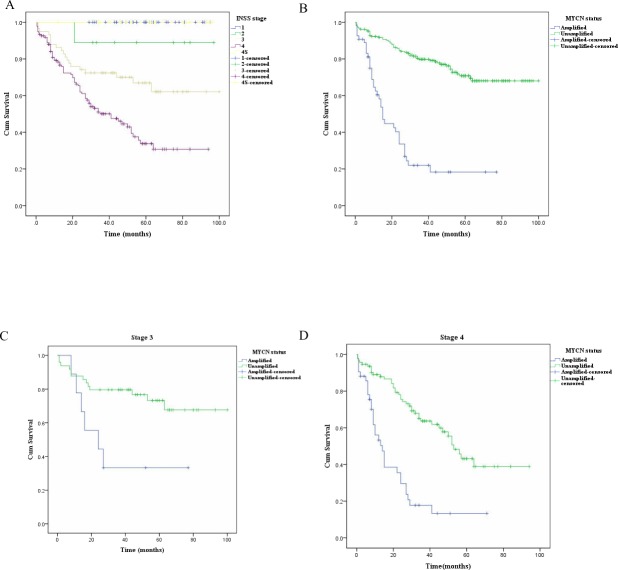
Figure 2. The Kaplan–Meier survival curves for NB patients (n = 262) with different stages and different MYCN status, stage 3 patients (n = 58) with different MYCN status, and stage 4 patients (n = 135) with different MYCN status.
(A–B) The differences in Kaplan–Meier survival curves for NB patients (n = 262) with different stages (A) and different MYCN status (B) showed statistical significance (both P < .001 by log-rank test). (C–D) The comparison of Kaplan-Meier survival curves for different MYCN status groups at stage 3 (C, n = 58) and 4 (D, n = 135) had statistical significance (P = .012 and P < .001 by log-rank test, respectively).

