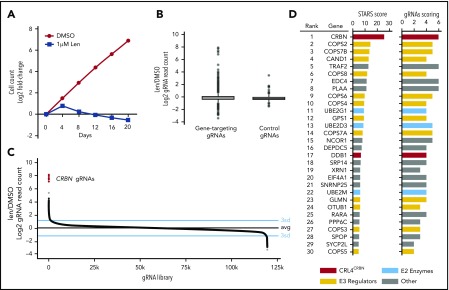
Figure 1.
Genome-scale CRISPR-Cas9 screen in a lenalidomide-treated myeloma cell line identifies genes required for lenalidomide’s antimyeloma effects. (A) Cell number over the 20-day assay (DMSO; 1 replicate, 1 μM lenalidomide [Len]; average of 3 technical replicates). (B) Log2 fold-enrichment (lenalidomide/DMSO) of read counts for gene-targeting gRNAs and 1000 control gRNAs (average of 3 technical replicates) at day 20. Upper and lower bounds of box correspond to the 75% and 25% quantiles, respectively, central line indicates the median, whiskers extend to 1.5× the interquartile range, datapoints beyond 1.5× the interquartile range are displayed individually. (C) gRNA library ranked according to the lenalidomide/DMSO fold-change in read count (average of 3 technical replicates). Blue lines indicate 3 standard deviations above and below the mean; black line is average of all gRNAs. (D) Results of the STARS algorithm analysis. Genes displayed met a FDR threshold of <0.05. “gRNAs scoring” refers to the number of gRNAs (of 6) whose ranks were considered by the algorithm to have generated the lowest P value and were therefore used to generate the score for that gene.

