The fatty acid kinase, FakA, of Staphylococcus aureus plays several important roles in the cell. FakA is important for the activation of the SaeRS two-component system and secreted virulence factors like α-hemolysin. However, the contribution of FakA to cellular metabolism has not been explored. Here, we highlight the metabolic consequence of removal of FakA from the cell. The absence of FakA leads to altered acetate metabolism and altered redox balance, as well as a change in intracellular amino acids. Additionally, the use of environmental amino acid sources is affected by FakA. Together, these results demonstrate for the first time that FakA provides a link between the pathways for exogenous fatty acid use, virulence factor regulation, and other metabolic processes.
KEYWORDS: FakA, metabolism, acetate metabolism, metabolomics, Staphylococcus
ABSTRACT
Staphylococcus aureus is capable of phosphorylating exogenous fatty acids for incorporation into the bacterium's membrane via the fatty acid kinase, FakA. Additionally, FakA plays a significant role in virulence factor regulation and skin infections. We previously showed that a fakA mutant displays altered growth kinetics in vitro, observed during the late-exponential phase of growth. Here, we demonstrate that the absence of FakA leads to key metabolic changes. First, the fakA mutant has an altered acetate metabolism, with acetate being consumed at an increased rate than in the wild-type strain. Moreover, the growth benefit was diminished with inactivation of the acetate-generating enzyme AckA. Using a mass spectrometry-based approach, we identified altered concentrations of tricarboxylic acid (TCA) cycle intermediates and both intracellular and extracellular amino acids. Together, these data demonstrate a change in carbohydrate carbon utilization and altered amino acid metabolism in the fakA mutant. Energy status analysis revealed the mutant had a similar ADP/ATP ratio to that of the wild type, but a reduced adenylate energy charge. The inactivation of fakA changed the NAD+/NADH and NADP+/NADPH ratios, indicating a more oxidized cellular environment. Evidence points to the global metabolic regulatory proteins CcpA and CodY being important contributors to the altered growth in a fakA mutant. Indeed, it was found that directing amino acids from the urea cycle into the TCA cycle via glutamate dehydrogenase was an essential component of S. aureus growth after glucose depletion. Together, these data identify a previously unidentified role of FakA in the global physiology of S. aureus, linking external fatty acid utilization and central metabolism.
IMPORTANCE The fatty acid kinase, FakA, of Staphylococcus aureus plays several important roles in the cell. FakA is important for the activation of the SaeRS two-component system and secreted virulence factors like α-hemolysin. However, the contribution of FakA to cellular metabolism has not been explored. Here, we highlight the metabolic consequence of removal of FakA from the cell. The absence of FakA leads to altered acetate metabolism and altered redox balance, as well as a change in intracellular amino acids. Additionally, the use of environmental amino acid sources is affected by FakA. Together, these results demonstrate for the first time that FakA provides a link between the pathways for exogenous fatty acid use, virulence factor regulation, and other metabolic processes.
INTRODUCTION
The facultatively anaerobic Gram-positive bacterium Staphylococcus aureus is a common colonizer of the human nares but is also a potent human pathogen. While primarily causing skin infections, S. aureus is capable of establishing infection in a multitude of anatomical sites in the human body, leading to life-threatening diseases (1). These different niches have a wide variety of nutrients, necessitating S. aureus to have an adaptable metabolism. Perhaps, not surprisingly, virulence factor production and metabolism are linked as S. aureus adapts to its environment (2, 3).
S. aureus possesses complete central metabolic pathways, including glycolysis, the pentose phosphate pathway, and the tricarboxylic acid (TCA) cycle. These metabolic pathways, as well as virulence factor production, are under the control of global regulators (3–6). Carbon catabolite protein A, or CcpA, is a DNA-binding protein and has been shown to regulate multiple branches of metabolism. Importantly, CcpA represses the TCA cycle in the presence of glucose or other glycolytic carbohydrates that generate fructose-1,6-bisphosphate (7–11). In addition, CcpA controls the expression of genes encoding key enzymes in amino acid metabolism (5, 12, 13). CodY is a global transcriptional regulator that directly monitors the intracellular concentrations of branch-chained amino acids (BCAAs), as well as levels of cellular GTP (14, 15). Accordingly, CodY has been shown to regulate BCAA biosynthesis pathways and control a multitude of virulence factors, from repressing toxins to activating microbial surface components recognizing adhesive matrix molecules (MSCRAMMs) (4, 16–18). Deletion of ccpA from Staphylococcus aureus impacts the transcription of virulence factors, such as the downregulation of the global effector molecule of the Agr system, RNAIII (19). CodY has also been shown to alter transcription of the agr locus and thus expression of virulence factors such as α-hemolysin (4, 20, 21). More recently, CodY binding motifs were identified upstream of the P1 promoter of the saePQRS operon (22), suggesting a direct role for CodY regulating secreted virulence factors. As a consequence of these two key regulatory proteins, both the availability of carbohydrates and amino acids can induce metabolic changes as well as altering virulence factor production.
The details of carbon flow, particularly from glucose, through central metabolism have been a topic of significant study. In the presence of a preferred carbohydrate, such as glucose, S. aureus uses glycolysis to produce pyruvate, which can be converted into multiple metabolites depending on the environment. Under aerobic conditions and in the presence of glucose, the TCA cycle is repressed by CcpA (11), and much of the pyruvate is converted to acetyl coenzyme A (acetyl-CoA) and then acetate, with ATP created by substrate-level phosphorylation by the phosphotransacetylase-acetate kinase (Pta-AckA) pathway (23, 24). Once glucose and glycolytic intermediates (fructose-1,6-bisphosphate) are depleted from the environment, CcpA repression of the TCA cycle is relieved and acetate is reassimilated to acetyl-CoA (25) and subsequently processed through the TCA cycle. This switch from acetate production to acetate consumption is known as the “acetate switch” (26), the timing of which is presumably controlled by CcpA both directly and indirectly.
Recently, fakA (originally named vfrB) was characterized in Staphylococcus aureus (27). This gene encodes a fatty acid kinase, which is responsible for phosphorylating exogenous fatty acids and incorporating them into the S. aureus phospholipid bilayer (28). FakA has been shown to regulate virulence factor production, such as that of α-hemolysin and several proteases (27), as well as impacting the type VII secretion system (29). We have shown that FakA mediates at least some of these effects through the activation of the SaeRS two-component system (30). In addition, FakA influences biofilm formation (31) by an unknown mechanism. Previously, we showed that deletion of the fakA gene led to altered growth kinetics (27). Here, we demonstrate that a fakA mutant displays an altered acetate switch as well as an apparent altered amino acid metabolism.
RESULTS
A fakA mutant displays altered growth and acetate kinetics.
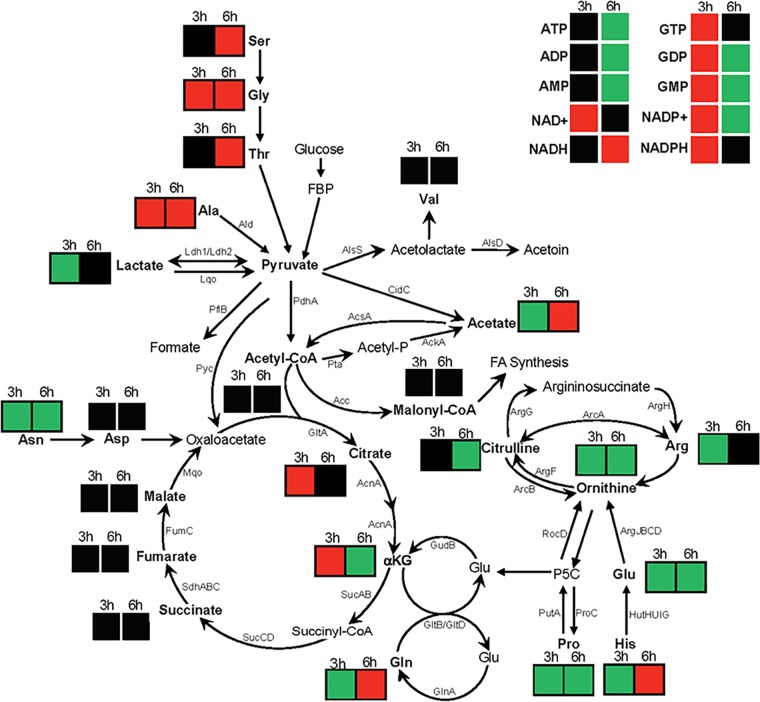
Previously, we showed that a fakA mutant has an extended exponential phase of growth, resulting in higher growth yield (27) and suggesting an altered metabolism in the fakA mutant. For a summary of metabolic pathways and changes observed in the fakA mutant, see Fig. 10. To determine the effect that FakA has on the growth of S. aureus, the wild type, the fakA mutant, and the fakA complemented strain were grown in tryptic soy broth (TSB) supplemented with 14 mM glucose. In agreement with our previous results, we observed enhanced late-exponential-phase growth in the fakA mutant, which could be restored to wild-type levels when fakA was provided on a plasmid (Fig. 1A). Under aerobic growth in the presence of glucose, S. aureus produces acetate as a by-product, which leads to decreased medium pH, followed by consumption of acetate and a rise in pH (24, 32, 33). Interestingly, altered growth kinetics of the fakA mutant correlated with an increased culture pH (Fig. 1B), consistent with decreased production or enhanced utilization of acetate in the fakA mutant. Growing the fakA mutant under decreased flask-to-medium ratios resulted in no significant growth advantage compared to the wild-type strain (see Fig. S1A in the supplemental material). Furthermore, the growth advantage observed in the fakA mutant was diminished during the exponential phase of growth when grown in TSB lacking glucose, with growth returning to wild-type levels (Fig. S1B). To determine if the growth advantage was due to altered acidification of the medium, the wild type, the fakA mutant, and the complemented strain were grown in TSB buffered to a pH of 7.2 with 50 mM morpholinepropanesulfonic acid (MOPS) (Fig. S1C). All strains grew similarly to those grown in unbuffered media, indicating that this growth phenotype is not the result of medium pH changes. Taken together, these data suggest that FakA alters bacterial growth at the exponential phase of growth in a glucose- and oxygen-dependent manner indicative of changes in the acetate switch.
FIG 10.
Relative change in intracellular concentrations of metabolites and their location in metabolism. Colors indicate either an increase (green box), decrease (red box), or no significant change (black box) at 3 or 6 h in the fakA mutant compared to in the wild type.
FIG 1.
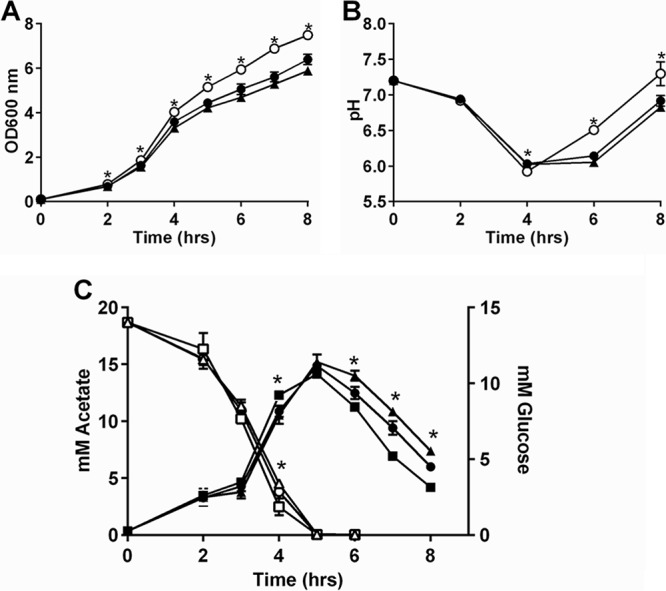
(A) Growth of wild-type (closed circle), fakA mutant (open circle), and fakA complement (triangle) strains in TSB plus 14 mM glucose at a 1:10 medium-to-flask ratio. (B) pH of culture from panel A. Data are the averages (n = 3) with standard deviations from representative experiments. All points have error bars, which may be smaller than symbols. (C) Extracellular acetate (closed symbols) and glucose (open symbols) were determined for wild-type (circles), fakA mutant (squares), and complement strains (triangles). Data are averages (n = 6) with standard deviations. An asterisk denotes significance (t test, P < 0.05) compared to the wild type.
Altered acetate production and the timing of the growth divergence between the wild-type and fakA mutant strains correlates with previous studies showing the switch from glucose to acetate utilization in S. aureus (32, 33). To directly examine whether glucose to acetate conversion and subsequent acetate consumption are altered in the fakA mutant, both acetate and glucose concentrations were determined (Fig. 1C). In agreement with previous work (33), glucose was consumed in the early exponential phase, with a corresponding increase in acetate levels until glucose was depleted. The fakA mutant consumed more glucose by hour 4, which corresponded with a slight increase in acetate production and to the start of the growth divergence. During the course of enhanced growth of the fakA mutant, decreased levels of acetate were present in the medium, correlating to the observations of increased pH shown in Fig. 1B. The changes in glucose and acetate utilization were both restored when fakA was provided on a plasmid. Together, these results demonstrate that glucose and acetate metabolism is different in the fakA mutant, and their timing suggests an altered acetate switch.
Altered growth of the fakA mutant is dependent on AckA.
Along with the observation of altered acetate levels in the fakA mutant compared to those in the wild type, we predicted that the altered growth of a fakA mutant would involve the Pta-AckA and AcsA pathways, which are the primary mechanism to produce (33) and consume (25) acetate, respectively. Not surprisingly, the ackA and fakA ackA mutant strains grew poorly compared to both the wild type and the fakA mutant (Fig. 2A). This agrees with previous studies that highlighted the importance of the production of energy from the Pta-AckA pathway in S. aureus (13, 32, 34). However, the growth (Fig. 2A) was similar in the fakA ackA mutant compared to that of the ackA mutant, indicating that the enhanced growth of the fakA mutant during the exponential phase of growth is reliant on AckA. The fakA ackA mutant did have modest increased growth compared to the ackA mutant at several time points. First, a slightly enhanced growth was observed at 4 and 5 h of growth, similar to that seen with the fakA mutant compared to the wild type in the absence of glucose (Fig. S1B), as well as at the latest time points examined. As seen in a previous report (33), the ackA mutants did produce some acetate (Fig. 2C). There was no difference in acetate between the ackA and fakA ackA mutant at either 3 or 6 h of growth, although the fakA ackA mutant consumed more acetate by 12 h. This could be responsible for the increased growth observed in the fakA ackA mutant compared to that in the ackA mutant (Fig. 2). Current models suggest AcsA as the means to assimilate acetate for redirection into the TCA cycle (24, 25), although experimental confirmation is lacking. Surprisingly, acsA and fakA acsA mutants resembled the wild type and the fakA mutant, respectively, during most of growth (see Fig. S2 in the supplemental material). AcsA had a modest effect in both strains after 8 h, well past the point of glucose exhaustion from the media. Interestingly, the acsA mutant depleted approximately 75% of produced acetate (Fig. S2; compare ascA at 3 and 12 h). Much like the parent strains, the fakA acsA mutant had less acetate in the medium compared to the acsA mutant. These data demonstrate a role for acetate produced via AckA in the enhanced growth of the fakA mutant, but, in contrast to most models, the majority of acetate is being depleted via another mechanism rather than by the AcsA pathway.
FIG 2.
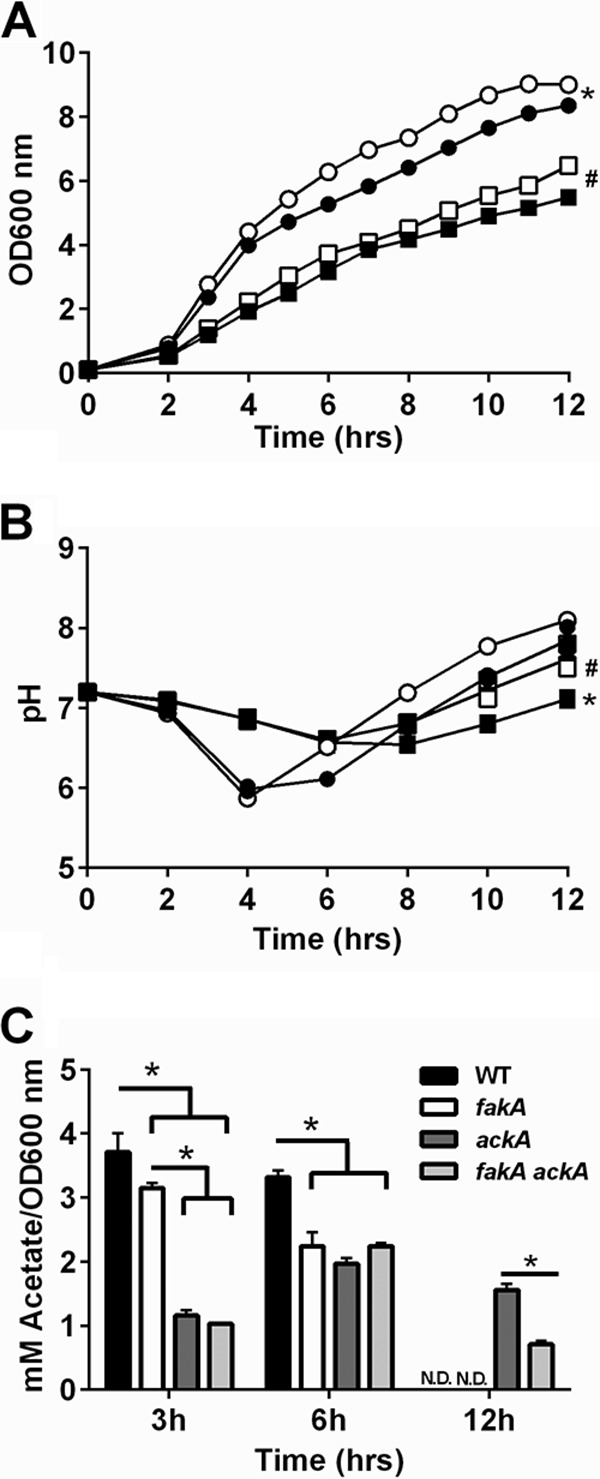
(A) Growth of wild-type (closed circle), fakA mutant (open circles), ackA mutant (closed square), and fakA ackA mutant (open square) strains. An asterisk denotes a significant difference (P < 0.05) for all points after 2 h for wild type (WT) versus the fakA mutant, while # indicates significance for hours 4, 5, and 9 to 12 for the ackA mutant versus the fakA ackA mutant. (B) pH of culture media from panel A. An asterisk denotes a significant difference (P < 0.05) for all points after 2 h for WT versus the ackA mutant, while # identifies differences (P < 0.05) for all points after 2 h, except for the ackA mutant versus the fakA ackA mutant (6 h). (C) Quantification of acetate in the culture media at indicated time points. An asterisk denotes a significant difference (P < 0.05). N.D., none detected. For all panels, data are the averages (n = 3) with standard deviations from representative experiments. All points have error bars, which may be smaller than symbols.
The fakA mutant has altered central metabolites, while maintaining acetyl-CoA levels.
Alterations in carbon flow through acetate metabolism would likely change additional metabolic processes. To assess other metabolic changes in the fakA mutant, we used liquid chromatography-tandem mass spectrometry (LC-MS/MS) to quantify key metabolic intermediates at 3 or 6 h of growth. Pyruvate levels were below the limit of detection (∼1 nM mg−1 protein) for both the wild-type and fakA mutant strains at either time point (data not shown). Acetyl-CoA was readily detected, and there was no significant difference between the strains (Fig. 3A), demonstrating that despite differences in growth kinetics and altered acetate metabolism, acetyl-CoA levels are maintained. Since acetate levels, but not those of acetyl-CoA, were altered in the fakA mutant, we suspected that carbon was being shuttled to alternative metabolites. We found that the fakA mutant had a 38.3% increase in intracellular lactate compared to that in the wild type at 3 h of growth but showed no difference at 6 h (Fig. 3B). Although not statistically significant, we also identified increased lactate in the supernatants of the fakA mutant compared to those of the wild-type strain (see Table S1 in the supplemental material). However, lactate production was not a major contributing factor to growth, as the growth and pH of ldh1, fakA ldh1, ldh2, and fakA ldh2 mutants showed no significant differences (see Fig. S3 in the supplemental material). In addition, mutation of alsS, which produces acetoin from pyruvate, did not alter growth of the wild type or the fakA mutant (Fig. S3).
FIG 3.
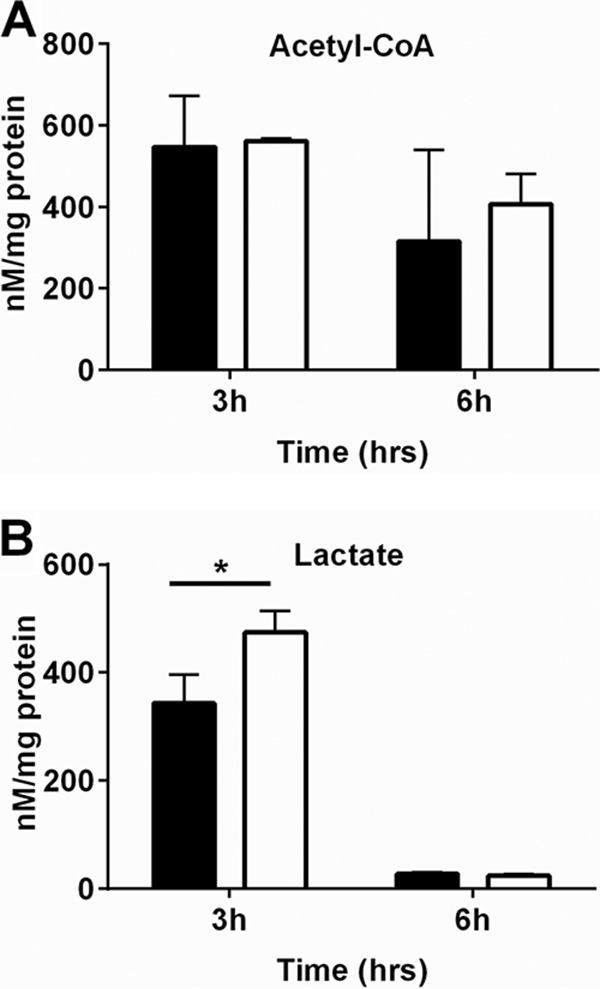
Quantification of intracellular levels of acetyl-CoA (A) and lactate (B) after 3 and 6 h of growth for wild-type (black bars) and fakA mutant (white bars) strains. Data are averages (n = 4) with standard deviations and are normalized to protein concentration. An asterisk denotes a significant difference (t test, P < 0.05) compared to the wild type.
Since FakA is necessary for exogenous fatty acid use, we tested whether the endogenous fatty acid synthesis system was altered. This is also one direction in which acetyl-CoA is diverted. We found no difference in levels of malonyl-CoA, the intermediate that feeds into fatty acid biosynthesis, between the wild-type and fakA mutant strains (Fig. 4A). We also determined the transcription levels for fabH, which encodes a key enzyme in fatty acid synthesis (35, 36). In agreement with unaltered malonyl-CoA, fabH expression was not significantly changed in the absence of fakA (Fig. 4B), indicating that the absence of fakA does not affect the endogenous fatty acid synthesis pathway.
FIG 4.
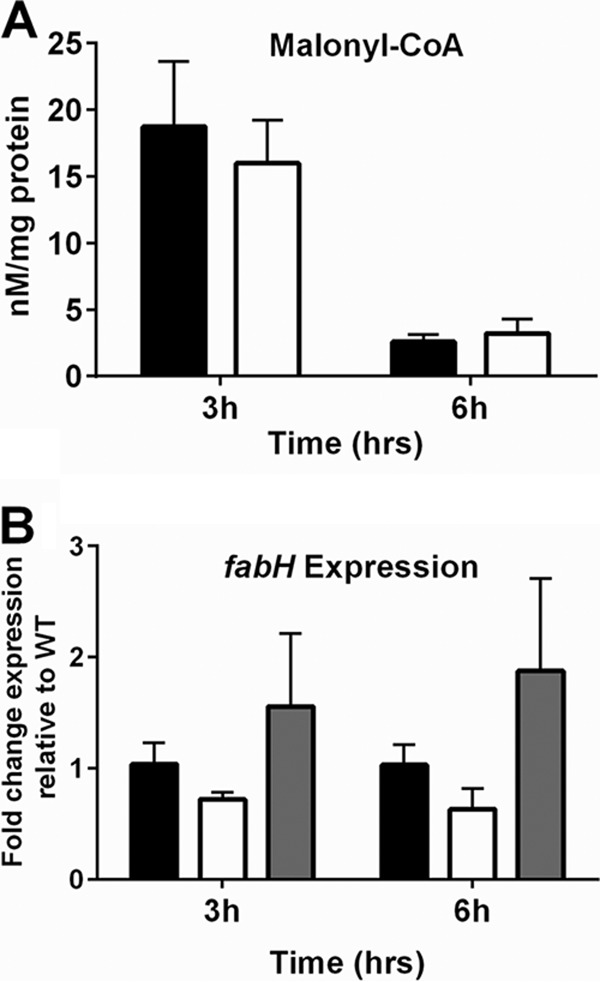
(A) Quantification of intracellular levels of malonyl-CoA after 3 and 6 h of growth for wild-type (black bars) and fakA mutant (white bars) strains. Data are averages (n = 4) with standard deviations and are normalized to protein concentration. *, P < 0.05. (B) fabH transcript levels at 3 and 6 h of growth in wild-type (black bars), fakA mutant (white bars), and fakA complement (gray bars) strains. Data are average (n = 3) fold changes relative to wild-type, with standard errors of the mean.
One major fate for acetyl-CoA is the TCA cycle. Indeed, when glucose from the environment is exhausted, acetate is converted to acetyl-CoA for use in the TCA cycle. Therefore, we examined the concentrations of several key TCA cycle intermediates. Succinate, fumarate, and malate levels were not significantly different between the wild type and the fakA mutant after 3 or 6 h of growth (Table S1). Compared to the wild type, the fakA mutant had decreased intracellular citrate and α-ketoglutarate early in growth, but significantly increased levels during the enhanced growth (6 hours). For the full list of quantified organic acids, see Table S1.
The fakA mutant has a modified redox state.
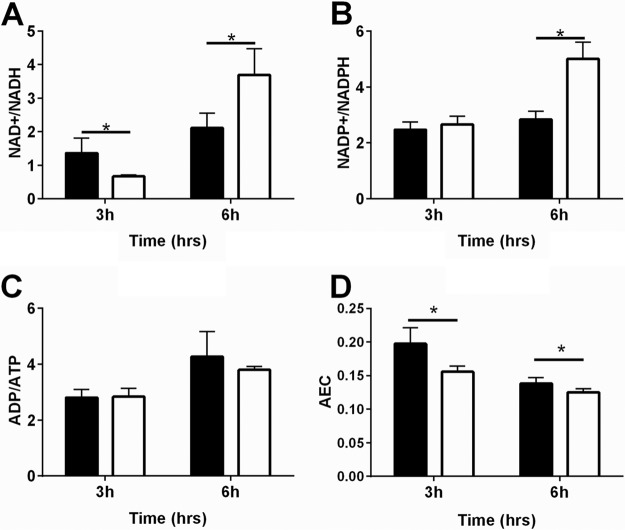
During growth utilizing glucose, wild-type cells make most of their ATP through substrate phosphorylation via acetate production. Following glucose exhaustion, generation of ATP then shifts to the TCA cycle and electron transport chain. Given that acetyl-CoA levels were unaltered in the fakA mutant compared to those of the wild type, we examined the redox and energy state of the cells using LC-MS/MS. After 3 h of growth, the fakA mutant displayed a significant decrease in the NAD+/NADH ratio compared to that of the wild type (Fig. 5A), which transitioned to a significantly increased ratio during enhanced growth (6 h) (Fig. 5A). While no difference was observed for NADP+/NADPH at 3 h of growth, at 6 h, this ratio was increased in the fakA mutant compared to that in the wild type (Fig. 5B), and this is attributed to increased NADP+ at this time. Interestingly, at 6 h of growth, the fakA mutant had increased levels of both ADP and ATP (see Table S2 in the supplemental material), yet the ADP/ATP ratio was similar to that of the parent strain (Fig. 5C). Additionally, AMP levels were significantly increased in the fakA mutant (Table S2). We also used the ATP, ADP, and AMP results to calculate the adenylate energy charge (AEC), as described by Atkinson et al. (37). Using this analysis, the fakA mutant was found to have a decreased AEC at both time points examined (Fig. 5D). Together, these data indicate that during enhanced growth, the fakA mutant has a more oxidized cellular environment than that of the wild-type strain and has an overall moderately decreased cellular energy status. For the full list of quantified nucleotides, see Table S2.
FIG 5.
Cellular ratios of NAD+/NADH (A), NADP+/NADPH (B), and ADP/ATP (C) and adenylate energy charge (AEC) (D) determined by LC-MS/MS after 3 and 6 h of growth for wild-type (black bars) and fakA mutant (white bars) strains. Data are the average ratios (n = 4) with standard deviations after normalization to protein concentration. An asterisk denotes a significant difference (on t test, P < 0.05) compared to the wild type.
FakA modulates amino acid metabolism.
Recently, Halsey et al. (13) reported that different amino acids play unique roles for bacterial growth in the absence of glucose. For example, the amino acids glutamate, glutamine, proline, arginine, asparagine, and aspartate were shown to provide the organism with TCA cycle intermediates like α-ketoglutarate and oxaloacetate. The amino acids alanine, glycine, and threonine are converted to pyruvate and acetate via the Pta-AckA pathway (13). We sought to determine the amino acid profiles of both wild-type and the fakA mutant strains, as they may reflect the altered metabolism observed in the mutant strain. When analyzing cellular amino acids at either 3 or 6 h of growth, we identified significant changes in 15 out of 22 amino acids tested at one or both time points, demonstrating significant changes to amino acid metabolism in the fakA mutant (Fig. 6).
FIG 6.
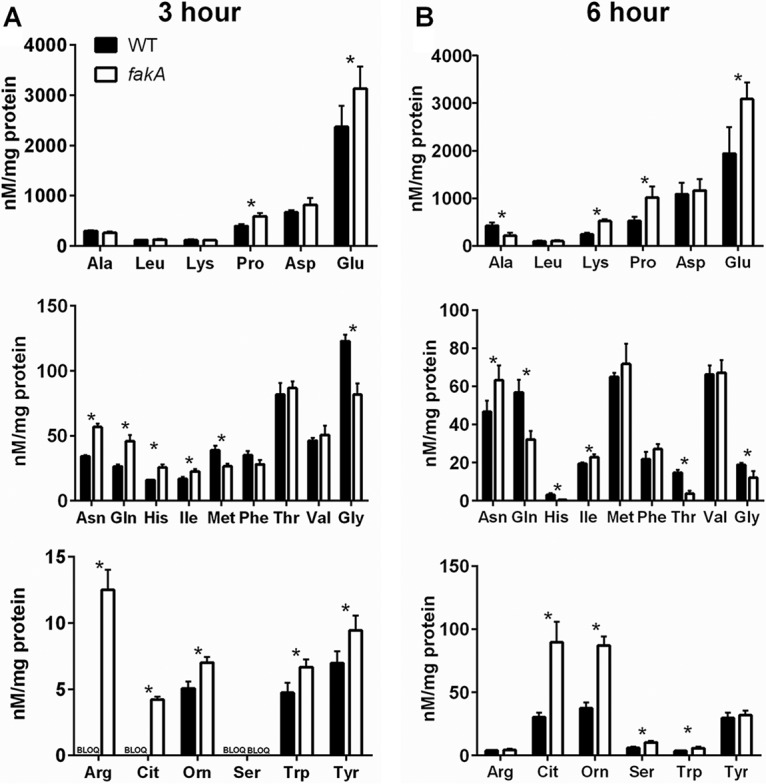
Quantification of intracellular amino acids from wild-type (WT) and fakA mutant strains grown for 3 (A) or 6 h (B). Concentrations were normalized to protein concentration. Data are averages (n = 4) with standard deviations from representative experiments. An asterisk denotes a significant difference (t test, P < 0.05) compared to the wild type. BLOQ, concentration below the limit of quantification.
Amino acids that can be converted to pyruvate were less abundant in fakA mutant cells. Specifically, threonine, glycine, and alanine were all at reduced levels at 6 h in the fakA mutant (Fig. 6). These same amino acids were consumed from the media at a greater rate when the starting levels in the media were compared to those of the supernatants. We also observed significant changes in amino acids that are involved in the urea cycle. Intracellular arginine, histidine, proline, and glutamate levels (Fig. 6) were all increased in the fakA mutant after 3 h of growth compared to those in the wild type. At 6 h, arginine levels were similar in the wild type and the fakA mutant, while histidine levels were lower. At this same time, proline and glutamate levels were increased in the mutant.
Two nonproteinogenic amino acids were also examined. Citrulline and ornithine are amino acids involved in the urea cycle, which is a key pathway in amino acid catabolism and allows available carbon to enter the TCA cycle via α-ketoglutarate. After three and 6 h of growth, citrulline and ornithine levels were significantly increased in the fakA mutant compared to those in the wild type (Fig. 6), suggesting altered urea cycle activity. Therefore, we hypothesized that urease activity would be impacted. The urea cycle connects glutamate and amino acids producing glutamate to the TCA cycle and is subjected to carbon catabolite regulation independently of the presence of glucose (11, 12). Urease activity was determined after 3 and 6 h of growth. The activity of urease was increased in the fakA mutant compared to that in the wild type at both time points (Fig. 7A). This is likely due to increased urease levels, since in the fakA mutant we observed increased expression of a β-galactosidase-based reporter of the urease promoter (Fig. 7B). Despite this increase in urease activity, inactivation of urease in both wild-type and fakA mutant strains did not alter growth under our conditions (data not shown).
FIG 7.
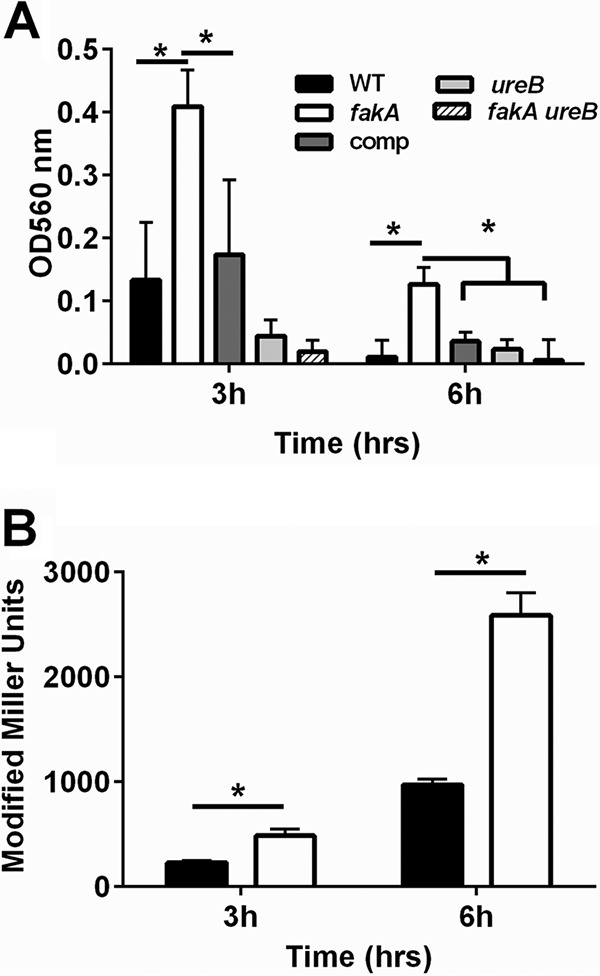
(A) Urease activity was determined via absorbance at 560 nm for indicated strains grown for 3 or 6 h. (B) β-Galactosidase activity from a Pure-lacZ reporter measured in wild-type (black bars) and fakA mutant (white bars) strains grown for 3 or 6 h. All data are the averages (n = 3) with standard deviations from representative experiments. An asterisk denotes a significant difference (t test, P < 0.05).
Global regulators CcpA and CodY alter growth of the fakA mutant.
The altered growth of the fakA mutant is observed as glucose is depleted from the medium. Since CcpA carries out its regulation in a glucose-dependent manner, we reasoned that CcpA may have a role in the fakA mutant's altered growth. Therefore, growth was monitored in the absence of ccpA. After glucose depletion from the media, the ccpA and fakA ccpA mutants grew similarly to the fakA mutant and better than the wild-type strain (Fig. 8A). One indicator of CcpA activity is expression of gltA, which is repressed by CcpA (11). To assess potential alterations in CcpA activity, gltA mRNA levels were assessed after 3 and 6 h of growth. Interestingly, while glucose was present, transcription of gltA was increased 2-fold in the fakA mutant compared to that in the wild type, but it decreased upon glucose exhaustion (6 h), similarly to that in a ccpA mutant (Fig. 8B). This result indicates that CcpA activity may be altered in the fakA mutant.
FIG 8.
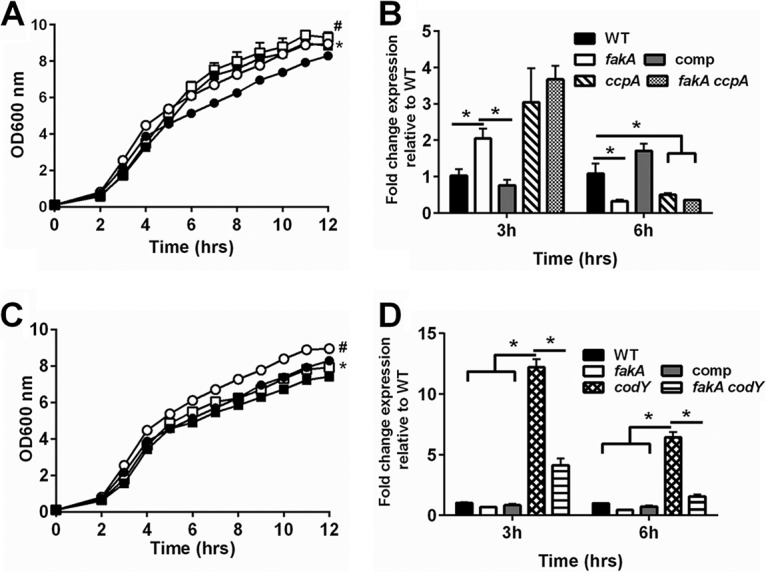
(A) Growth of wild-type (closed circle), fakA mutant (open circle), ccpA mutant (closed square), and fakA ccpA mutant (open square) strains. All data points are the averages (n = 3) with standard deviations from representative experiments. An asterisk indicates a significant difference (P < 0.05) between the WT and ccpA mutant for all time points except 5 h, and # indicates significant difference between the fakA and fakA ccpA mutants at hours 2 to 4 and 11 only. (B) Transcript levels of gltA determined via quantitative real-time PCR (qRT-PCR) after 3 or 6 h of growth. Data are the average (n = 3) fold changes relative to the wild type (wild type = 1) with standard errors of the mean. An asterisk denotes a significant difference (t test, P < 0.05). (C) Growth of wild-type (closed circle), fakA mutant (open circle), codY mutant (closed square), and fakA codY mutant (open square) strains. Data are the averages (n = 3) with standard deviations from representative experiments. An asterisk indicates significance (P < 0.05) between WT and codY mutant at hours 2, 3, 9, 10, and 12 only, while # identifies difference between the fakA and fakA codY mutants at all time points. (D) Transcript levels of ilvD determined via qRT-PCR at 3 or 6 h of growth. Data are the average (n = 3) fold changes relative to the wild type (wild type = 1) with standard errors of the mean. An asterisk denotes a significant difference (t test, P < 0.05).
We observed differences in amino acid metabolism (see Table S3 in the supplemental material) and guanine-based nucleotides (Table S2), both of which alter CodY activity. In addition, amino acids are abundant in TSB, and it was possible that enhanced growth was due in part to amino acid utilization. Due to the role of CodY in regulating amino acid metabolism, we hypothesized that it may affect growth of the fakA mutant. Indeed, inactivation of codY in the fakA mutant diminished the growth of the fakA mutant to near wild-type levels, whereas the single codY mutant displayed no altered growth (Fig. 8C). CodY is known to repress expression of ilvD (38); we therefore used this transcript as an indicator of CodY activity. After 3 h, ilvD expression was not significantly altered in the fakA mutant compared to that in the wild type (Fig. 8D). Surprisingly, ilvD expression was reduced in the absence of codY and fakA together compared to that in the codY mutant alone.
GudB is necessary for growth post-glucose consumption.
Glutamate dehydrogenase, encoded by gudB, produces α-ketoglutarate from glutamate, linking the urea cycle amino acids to central metabolism (13). Since we observed altered urease activity and amino acids levels associated with the urea cycle in the fakA mutant, we hypothesized that directing carbon from these pathways into central metabolism would be important for the growth of the fakA mutant. This is also suggested by the increased α-ketoglutarate levels observed in the fakA mutant (Table S1). Indeed, mutation of gudB hindered growth of both the wild-type and fakA mutant strains (Fig. 9A). Likewise, the pH of the media was not different between the gudB and fakA gudB mutants (Fig. 9B). This highlights the importance of the production of α-ketoglutarate via glutamate and amino acids that can be converted to glutamate as an important provider of carbon in complex media upon glucose consumption that is necessary for growth of both wild-type and the fakA mutant strains.
FIG 9.
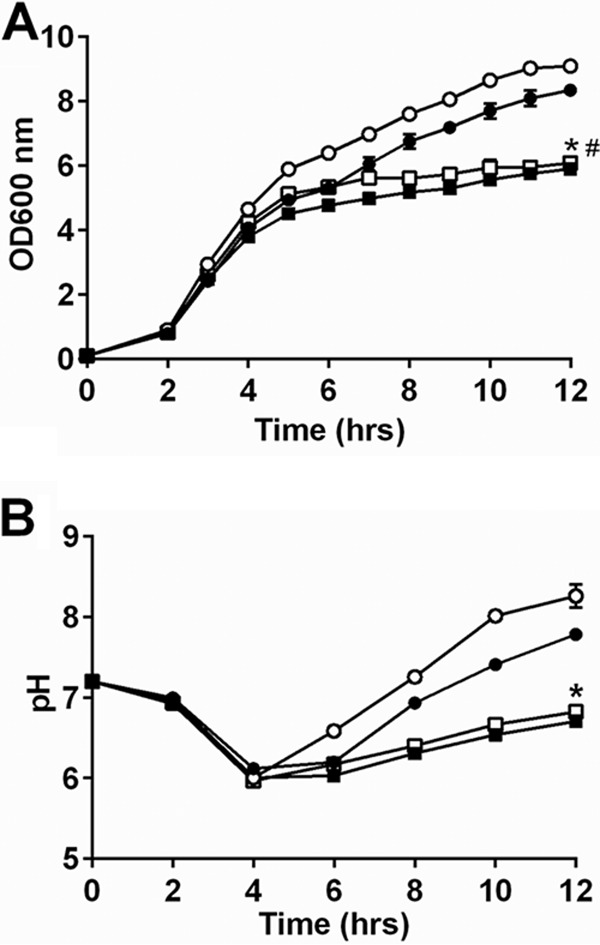
(A) Growth of wild-type (closed circle), fakA mutant (open circle), gudB mutant (closed square), and fakA gudB mutant (open square) strains. An asterisk denotes a significant difference (P < 0.05) for the wild type versus the gudB mutant at all points after 4 h, and # identifies difference for the fakA mutant versus the fakA gudB mutant for all time points after 2 h. (B) pH of culture media from panel A. Data are the averages (n = 3) with standard deviations from representative experiments. An asterisk denotes a significant difference (t test, P < 0.05) at all points for gudB mutants versus parent strains. All points have error bars, which may be smaller than symbols.
DISCUSSION
While FakA is involved in the utilization of exogenous fatty acids, we provide data that the function of FakA extends into maintaining metabolic homeostasis (Fig. 10). In the absence of FakA, we observed an altered acetate switch, redox state, and changes in key metabolites, as well as intracellular amino acid pools when grown in complex laboratory media, providing a snapshot of the metabolic state of the cell during growth. The apparent shift in global metabolism observed in the fakA mutant results in an increased NAD+/NADH ratio inside the cell. We also provide evidence supporting the FakA-dependent activity of CcpA, as shown through the altered transcription of gltA observed in the fakA mutant. It should be noted that we have recently reported that FakA is an activator of the SaeRS two-component system (30), while another group demonstrated that CodY binds to the sae P1 promoter (39). Thus, it was reasonable to postulate that Sae would be important for the growth phenotype observed in the fakA mutant. However, in our previous study we did not note a growth difference between the fakA mutant and the fakA sae combination mutant. We reexamined this under the growth conditions here and again observed no contribution of sae to the enhanced growth of the fakA mutant (data not shown), demonstrating the ability of FakA to affect multiple cellular networks.
The details of glucose/acetate metabolism have been well described for S. aureus, with acetate reassimilated post-glucose consumption. Acetate is primarily generated by the Pta-AckA pathway, and acetate consumption is thought to be mediated by AscA, which converts acetate to acetyl-CoA. In support of this, both wild-type and the fakA mutant strains generated acetate until glucose exhaustion, at which point acetate was consumed, with the mutant depleting acetate at a higher rate (Fig. 1). Both strains depleted acetate by 12 h (Fig. 2C). As expected, we observed diminished levels of acetate in the ackA mutants, indicating that the Pta-AckA pathway is the predominate pathway for acetate production in both strains. Contrary to the model, we observed the depletion of approximately 75% of the acetate produced in the absence of acsA (Fig. S2). Similarly to the wild type versus the fakA mutant, the deletion of fakA in the acsA mutant led to increased acetate consumption. While these data do not directly measure acetate conversion to acetyl-CoA, removal of acetate from the media clearly requires enzymes besides AscA. Together, these data provide evidence for an enzyme capable of compensating for the lack of AcsA. The identity of this enzyme is unknown; however, there is a putative AMP-binding enzyme (SAUSA300_2542, EC 6.2.1.1) that may be redundant with that of acsA. In addition, there is evidence in Escherichia coli that AckA can work in reverse (24, 25, 40), but the kinetics are not favorable at the concentrations produced by S. aureus. Also, acetate levels did not decrease in the ackA mutant (Fig. 2C), suggesting that this is not the case. The identification of the enzyme(s) responsible for acetate consumption in S. aureus and determination of whether AckA can act to consume acetate await further investigation.
Acetate is often thought to be a primary source of carbon for S. aureus post-glucose depletion, yet even strains that do not completely use acetate grow well. Another abundant nutrient source in TSB is peptides and amino acids, some of which can be shuttled into the TCA cycle due to GudB; therefore, the result that mutation of gudB alters growth post-glucose consumption is not surprising. Halsey et al. (13) recently showed that in chemically defined media, amino acids that can be converted to glutamate are an important source of carbon (13). This seems to be the case in complex media, such as TSB, as well. Indeed, the gudB and fakA gudB mutants entered stationary phase once glucose was consumed, demonstrating the importance of amino acids for S. aureus growth post-glucose consumption. This result highlights the importance of shuttling amino acids into the TCA cycle for growth of S. aureus despite an alternate energy source such as acetate. Furthermore, we hypothesize that the activity of glutamate dehydrogenase and the concomitant production of ammonia are necessary for the increased pH observed during the growth of wild-type and fakA strains.
We provide data suggesting a FakA-mediated effect on CcpA activity by using the expression of gltA (citrate synthase) as readout of CcpA activity. While gltA has been used as a marker for CcpA activity, the expression of this gene is dependent on more than just CcpA. Thus, one limitation for this experiment is that fakA alters gltA through other means. Furthermore, CcpA is activated by Hpr kinase, which is in turn activated by fructose-1,6-bisphosphate (FBP) (8). While we show that CcpA activity is affected by the lack of fakA, we did not measure levels of FBP in the fakA mutant. Thus, a change in steady-state FBP levels in fakA could be responsible for the altered CcpA activity suggested. Furthermore, Hpr is linked to the glucose phosphotransferase system (PTS), and changes in transport could affect Hpr, and subsequently CcpA, activity (8). More directed studies of the activity of CcpA in the context of FakA are needed to further characterize this relationship.
While regulation of ilvD is complex, it is used as an indicator mRNA for CodY activity. As expected, inactivation of codY increased transcription of ilvD, whereas no difference was observed in the fakA mutant alone. However, we observed decreased ilvD transcription in the fakA codY mutant compared to that in the codY mutant (Fig. 8D), indicating that in the absence of the repressor CodY, an additional activator is necessary for ilvD expression. Moreover, this proposed activator has reduced activity in the absence of FakA, and ilvD expression cannot be fully induced. The gene products gcp and yeaZ have been shown to repress ilv-leu transcription; however, the mechanism has not been identified (41, 42). Since these proteins repress ilvD expression, it is unlikely that they are the proteins by which FakA acts in the absence of CodY. It is possible that the decrease in ilvD expression in the fakA codY mutant compared to that in the codY mutant is not transcriptional and is the result of early transcription termination or mRNA stability. Recently, a report identified an attenuator peptide and termination loop structure, which is dependent on amino acid levels, in the 5′ untranslated region (UTR) of ilvD (39). The change in the concentration of amino acids could have effects on regulatory factors such as this attenuator peptide. However, the identification of the regulatory factor uncovered by our data remains to be elucidated.
Fatty acid biosynthesis begins with the conversion of acetyl-CoA to malonyl-CoA, which is then eventually converted to phospholipids for membrane incorporation (36). Due to its role in utilizing exogenous fatty acids, it was possible that fatty acid biosynthesis would be upregulated in the absence of fakA. We observed no difference in either intracellular malonyl-CoA levels or in the transcription of fatty acid biosynthesis genes, indicating that in complex media, the absence of fakA does not result in increased de novo fatty acid biosynthesis. This was not surprising, since it has been shown that exposure of S. aureus to a fatty acid-rich environment does not alter expression of the fatty acid biosynthesis pathway (43) and that exogenous fatty acids do not alter cellular malonyl-CoA levels (44). In support of this, our data demonstrate that the ability to use environmental fatty acids does not influence the endogenous synthesis pathway.
In this study, we have demonstrated a rewiring of S. aureus metabolism in response to the presence or absence of the fatty acid kinase. This alteration of metabolism involves changes in central metabolism, as well as pathways for amino acid utilization. Furthermore, these results, when combined with work previously done in our lab and by other groups, demonstrate an important link between fatty acid metabolism, central metabolism, and virulence factor regulation.
MATERIALS AND METHODS
Bacterial strains, plasmids, and growth conditions.
The bacterial strains and plasmids used in this study are presented in Table 1. Escherichia coli strains were grown in lysogeny broth (LB) or on LB agar (15% [wt/vol]) supplemented with ampicillin (100 μg ml−1) for antibiotic selection when necessary. S. aureus was grown in TSB supplemented with chloramphenicol (10 μg ml−1) or erythromycin (5 μg ml−1) when necessary. For analyzing bacterial growth, S. aureus overnight cultures were initially inoculated to an optical density at 600 nm of 0.1 in TSB without dextrose, which was supplemented with 14 mM glucose and filter sterilized. Unless otherwise stated, cultures were incubated at 37°C with shaking at 250 rpm in a flask-to-medium ratio of 10:1. Growth was measured using optical density at 600 nm readings or by assessing the number of CFU per milliliter on TSB with 15% (wt/vol) agar.
TABLE 1.
Strains, plasmids, and oligonucleotides
| Strain, plasmid, or oligonucleotide | Relevant characteristic(s)a | Source or reference |
|---|---|---|
| Strains | ||
| RN4220 | Highly transformable S. aureus | 52 |
| AH1263 | USA300 CA-MRSA strain LAC without LAC-p03 | 53 |
| JLB2 | AH1263 ΔfakA | 27 |
| JLB113 | AH1263 ccpA::tetL | 12 |
| JLB114 | AH1263 ΔfakA ccpA::tetL | This study |
| JLB127 | AH1263 ackA::ΝΣ | This study |
| JLB128 | AH1263 ΔfakA ackA::ΝΣ | This study |
| JLB132 | AH1263 ureB::ΝΣ | This study |
| JLB133 | AH1263 ΔfakA ureB::ΝΣ | This study |
| JLB158 | AH1263 gudB::ΝΣ | This study |
| JLB159 | AH1263 ΔfakA gudB::ΝΣ | This study |
| NE385 | Source of acsA::ΝΣ | 54 |
| NE1397 | Source of alsS::ΝΣ | 54 |
| NE1642 | Source of ureB::ΝΣ | 54 |
| KB8007 | JE2-ΔackA::ermB; Emr | 33 |
| JLB165 | AH1263 codY::ΝΣ | This study |
| JLB166 | AH1263 ΔfakA codY::ΝΣ | This study |
| NE1518 | Source of gudB::ΝΣ | 54 |
| NE1555 | Source of codY::ΝΣ | 54 |
| NE1670 | Source of ccpA::ΝΣ | 54 |
| NE1923 | Source of ldh1::ΝΣ | 54 |
| NE1816 | Source of ldh2::ΝΣ | 54 |
| JLB115 | AH1263 saeR::ΝΣ | 30 |
| JLB116 | AH1263 ΔfakA saeR::ΝΣ | 30 |
| JLB115 | AH1263 acsA::ΝΣ | This study |
| JLB116 | AH1263 ΔfakA acsA::ΝΣ | This study |
| JLB188 | AH1263 ldh1::ΝΣ | This study |
| JLB189 | AH1263 ΔfakA ldh1::ΝΣ | This study |
| JLB196 | AH1263 ldh2::ΝΣ | This study |
| JLB197 | AH1263 ΔfakA ldh2::ΝΣ | This study |
| JLB135 | AH1263 alsS::ΝΣ | This study |
| JLB136 | AH1263 ΔfakA alsS::ΝΣ | This study |
| Plasmids | ||
| pJB185 | Promoterless codon-optimized lacZ, Amp/Cmr | 30 |
| pJB165 | fakA complement, Amp/Cmr | 27 |
| pZD3 | Pure-lacZ reporter, Amp/Cmr | This study |
| Oligonucleotides | ||
| RT_ilvD_F | GGACCAGGTATGCCTGAAAT | This study |
| RT_ilvD_R | GGGGAAATATGACCAACTGC | This study |
| RT_gltA_F | TGGAAAAACGTATGGCAGAA | This study |
| RT_gltA_R | CCATCCTGCAGAACGACTTA | This study |
| RT-sigA-F | AACTGAATCCAAGTGATCTTAGTG | 55 |
| RT-sigA-R | TCATCACCTTGTTCAATACGTTTG | 55 |
| Purease-F2 | aatgaattcGATGATGCTACCTACAATAGCCGCTA | This study |
| Purease-R2 | ggacgtcgacCCAATTTCATATTAGATACAATTTACAAAATT | This study |
| CNK61 | GATATGCCATTTCCAACTGTCG | This study |
| CNK63 | GCTGCAAGTTGATCCATAGAGG | This study |
Antibiotic resistance abbreviations used: Amp/Cmr, ampicillin and chloramphenicol resistant; Emr, erythromycin resistant; tetL, tetracycline resistance gene. Oligonucleotide sequences are provided in the 5′-to-3′ orientation. Lowercase indicates nonhomologous sequences added for cloning purposes. CA-MRSA, community-associated methicillin-resistant Staphylococcus aureus.
Measurement of glucose and acetate concentrations in the culture medium.
Aliquots of bacterial cultures (1.0 ml) were pelleted at 21,130 × g for 5 min. Supernatants were decanted and stored at −20°C until analysis was performed. Acetate and glucose was quantified using kits purchased from R-Biopharm (Washington, MO) according to the manufacturer's protocol.
Measurement of urease activity.
Urease activity was determined according to the method of Onal Okyay et al. (45), with minor adjustments. Briefly, overnight cultures were inoculated to an optical density at 600 nm of 0.5 in Stuart's broth (46). The suspensions were incubated at 37°C with shaking at 250 rpm for 24 h. Following incubation, the suspensions were centrifuged at 3,160 × g for 10 min and the supernatants were removed and scanned. Optical density scans ranging from 400 nm to 600 nm were performed at time of inoculation and after 3, 6, and 24 h of growth using a Spark 10M plate reader (Tecan Group Ltd., Mannedorf, Switzerland). Optical density values at a wavelength of 560 nm as a measure of urease activity were compared using a medium blank.
Production of S. aureus mutants.
S. aureus transposon mutants are listed in Table 1 and were obtained from BEI Resources. Bacteriophage ϕ11 were propagated on mutants containing the desired transposon by combining 5 ml of TSB with 5 ml phage buffer (in 500 ml water, as follows: 6.47 g glycerol-2-phosphate, disodium salt, 0.06 g MgSO4, 2.4 g NaCl, and 0.5 g gelatin), 100 μl ϕ11 (∼1 × 10¹⁰ bacteriophage), and 100 μl of overnight donor strain, mixed by inversion, and incubated statically at room temperature overnight. The resulting ϕ11 bacteriophage was then filter sterilized using a 0.45-μm filter syringe and stored at 4°C until use. Transductions were performed as described previously (47). Genotypes were confirmed in transductants via PCR.
Analysis of β-galactosidase activity.
To construct pZD3, primers Purease-F2 (aatgaattcGATGATGCTACCTACAATAGCCGCTA) and Purease-R2 (ggacgtcgacCCAATTTCATATTAGATACAATTTACAAAATT) were used to amplify the promoter region of ureA from the AH1263 chromosome. The resulting PCR fragment was digested with EcoRI and SalI and ligated into the same sites of pJB185 to produce pZD3. β-Galactosidase activity was determined as previously described (30). Briefly, 1 ml of bacterial culture was collected after 3 or 6 h of growth. Cells were pelleted, resuspended in 1.2 ml Z-buffer (60 mM Na2HPO4, 40 mM NaH2PO4, 10 mM KCl, 1 mM MgSO4, and 3.4 ml β-mercaptoethanol) and lysed using a FastPrep-24 5G homogenizer (MP Biomedicals), according to the manufacturer's recommended settings for S. aureus cells. β-Galactosidase activity was determined by adding 140 μl of ortho-nitrophenyl-β-galactosidase (ONPG) (4 mg ml−1 [wt/vol]) to 700 μl of cell lysates and allowing reaction to turn slightly yellow at an absorbance at 420 nm of less than 1.0 at 37°C. The reaction was stopped with 200 μl of 1 M sodium bicarbonate, and then absorbance was measured at 420 nm. β-Galactosidase activity was determined based on protein concentration using a Bradford assay with Bio-Rad protein concentration reagent and reported as modified Miller units.
Reverse transcription-quantitative real-time PCR.
RNA was extracted using an RNeasy minikit (Qiagen) after 3 and 6 h of growth in TSB plus 14 mM glucose. The isolated RNA was treated with a DNA-free kit (Ambion) to remove DNA contamination. RNA samples were quantified using a NanoDrop One instrument (Thermo Fisher Scientific). RNA was standardized to 500 ng and used for cDNA synthesis using a QuantiTect reverse transcription kit (Qiagen). cDNA was diluted 1:10 and used as the template DNA for quantitative PCR, using FastStart essential DNA Green master mix in a LightCycler 96 system (Roche). Data were calculated and analyzed according to Livak et al. (48). Data are the average from biological triplicates each run as technical duplicates. Primers CNK61 (GATATGCCATTTCCAACTGTCG) and CNK63 (GCTGCAAGTTGATCCATAGAGG) were used to amplify fabH, RT-ilvD-F (GGACCAGGTATGCCTGAAAT) and RT-ilvD-R (GGGGAAATATGACCAACTGC) were used to amplify ilvD, and RT-gltA-F (TGGAAAAACGTATGGCAGAA) and RT-gltA-R (CCATCCTGCAGAACGACTTA) were used to amplify gltA. Data were standardized to sigA (rpoD) using primers RT-sigA-F (AACTGAATCCAAGTGATCTTAGTG) and RT-sigA-R (TCATCACCTTGTTCAATACGTTTG), as this has been shown to be a good calibrator previously (49, 50), and we typically observed less than one threshold cycle (CT) difference between strains.
Cell collection and metabolite sample preparation for metabolite analysis.
All glassware was triple washed with high-performance liquid chromatography (HPLC)-grade water, then three times with HPLC-grade acetone, and, finally, three times more with water. Overnight cultures of AH1263 and JLB2 were diluted to an optical density at 600 nm (OD600) of 0.1 in TSB with 14 mM glucose at a 1:10 medium-to-flask ratio and incubated at 37°C with shaking at 250 rpm. Four biological replicates were examined. Samples were removed at 3 or 6 h postinoculation and centrifuged to pellet the cells. After centrifugation, supernatants were separated into 1-ml aliquots and frozen by submersion in liquid nitrogen. The cell pellets were washed in cold phosphate-buffered saline (PBS), aliquoted, and recentrifuged and had PBS removed, with immediate submersion in liquid nitrogen. All samples were stored at −80°C until analyzed. For cell pellets, an additional tube was used for cell quantification and protein content determination using a Bradford assay with Bio-Rad protein concentration reagent. Samples were processed using LC-MS/MS, as previously described (51). The adenylate energy charge was calculated as (ATP + 0.5ADP)/(AMP + ATP + ADP), as previously described (37). Data were analyzed using a paired Student t test, where P < 0.05 was considered statistically significant.
Statistical analyses.
All statistical analyses were performed using Prism, version 6 (GraphPad). Statistical significance was determined using an unpaired t test with the Holm-Sidak method for multiple comparisons, where P < 0.05 was considered statistically significant unless otherwise stated. As stated above, mass spectrometry statistics were analyzed by the Southeast Center for Integrated Metabolomics (SECIM) Core using a t test in Microsoft Excel and revalidated using Prism.
Supplementary Material
ACKNOWLEDGMENTS
We thank Paul Fey at the University of Nebraska Medical Center for providing strains and Kelly Rice at the University of Florida for thoughtful discussion. In addition, we are grateful for the work of Christopher Petucci, along with that of members of the Southeast Center for Integrated Metabolomics, for mass spectrometry analysis.
Research reported in this publication was supported by the National Institute of Allergy and Infectious Diseases under award number R01AI121073 (to J.L.B.).
Footnotes
Supplemental material for this article may be found at https://doi.org/10.1128/JB.00345-18.
REFERENCES
- 1.Lowy FD. 1998. Staphylococcus aureus infections. N Engl J Med 339:520–532. doi: 10.1056/NEJM199808203390806. [DOI] [PubMed] [Google Scholar]
- 2.Somerville GA. 2009. At the crossroads of bacterial metabolism and virulence factor synthesis in staphylocci. Microbiol Mol Biol Rev 73:233–248. doi: 10.1128/MMBR.00005-09. [DOI] [PMC free article] [PubMed] [Google Scholar]
- 3.Richardson AR, Somerville GA, Sonenshein AL. 2015. Regulating the intersection of metabolism and pathogenesis in Gram-positive bacteria. Microbiol Spectr 3. doi: 10.1128/microbiolspec.MBP-0004-2014. [DOI] [PMC free article] [PubMed] [Google Scholar]
- 4.Pohl K, Francois P, Stenz L, Schlink F, Geiger T, Herbert S, Goerke C, Schrenzel J, Wolz C. 2009. CodY in Staphylococcus aureus: a regulatory link between metabolism and virulence gene expression. J Bacteriol 191:2953–2963. doi: 10.1128/JB.01492-08. [DOI] [PMC free article] [PubMed] [Google Scholar]
- 5.Görke B, Stulke J. 2008. Carbon catabolite repression in bacteria: many ways to make the most out of nutrients. Nat Rev Microbiol 6:613–624. doi: 10.1038/nrmicro1932. [DOI] [PubMed] [Google Scholar]
- 6.Sonenshein AL. 2007. Control of key metabolic intersections in Bacillus subtilis. Nat Rev Microbiol 5:917–927. doi: 10.1038/nrmicro1772. [DOI] [PubMed] [Google Scholar]
- 7.Deutscher J, Kuster E, Bergstedt U, Charrier V, Hillen W. 1995. Protein kinase-dependent HPr/CcpA interaction links glycolytic activity to carbon catabolite repression in gram-positive bacteria. Mol Microbiol 15:1049–1053. doi: 10.1111/j.1365-2958.1995.tb02280.x. [DOI] [PubMed] [Google Scholar]
- 8.Deutscher J, Herro R, Bourand A, Mijakovic I, Poncet S. 2005. P-Ser-HPr—a link between carbon metabolism and the virulence of some pathogenic bacteria. Biochim Biophys Acta 1754:118–125. doi: 10.1016/j.bbapap.2005.07.029. [DOI] [PubMed] [Google Scholar]
- 9.Sadykov MR, Hartmann T, Mattes TA, Hiatt M, Jann NJ, Zhu Y, Ledala N, Landmann R, Herrmann M, Rohde H, Bischoff M, Somerville GA. 2011. CcpA coordinates central metabolism and biofilm formation in Staphylococcus epidermidis. Microbiology 157:3458–3468. doi: 10.1099/mic.0.051243-0. [DOI] [PMC free article] [PubMed] [Google Scholar]
- 10.Lopez JM, Thoms B. 1977. Role of sugar uptake and metabolic intermediates on catabolite repression in Bacillus subtilis. J Bacteriol 129:217–224. [DOI] [PMC free article] [PubMed] [Google Scholar]
- 11.Seidl K, Muller S, Francois P, Kriebitzsch C, Schrenzel J, Engelmann S, Bischoff M, Berger-Bachi B. 2009. Effect of a glucose impulse on the CcpA regulon in Staphylococcus aureus. BMC Microbiol 9:95. doi: 10.1186/1471-2180-9-95. [DOI] [PMC free article] [PubMed] [Google Scholar]
- 12.Nuxoll AS, Halouska SM, Sadykov MR, Hanke ML, Bayles KW, Kielian T, Powers R, Fey PD. 2012. CcpA regulates arginine biosynthesis in Staphylococcus aureus through repression of proline catabolism. PLoS Pathog 8:e1003033. doi: 10.1371/journal.ppat.1003033. [DOI] [PMC free article] [PubMed] [Google Scholar]
- 13.Halsey CR, Lei S, Wax JK, Lehman MK, Nuxoll AS, Steinke L, Sadykov M, Powers R, Fey PD. 2017. Amino acid catabolism in Staphylococcus aureus and the function of carbon catabolite repression. mBio 8:e01434-16. doi: 10.1128/mBio.01434-16. [DOI] [PMC free article] [PubMed] [Google Scholar]
- 14.Ratnayake-Lecamwasam M, Serror P, Wong KW, Sonenshein AL. 2001. Bacillus subtilis CodY represses early-stationary-phase genes by sensing GTP levels. Genes Dev 15:1093–1103. doi: 10.1101/gad.874201. [DOI] [PMC free article] [PubMed] [Google Scholar]
- 15.Brinsmade SR, Kleijn RJ, Sauer U, Sonenshein AL. 2010. Regulation of CodY activity through modulation of intracellular branched-chain amino acid pools. J Bacteriol 192:6357–6368. doi: 10.1128/JB.00937-10. [DOI] [PMC free article] [PubMed] [Google Scholar]
- 16.Brinsmade SR. 2017. CodY, a master integrator of metabolism and virulence in Gram-positive bacteria. Curr Genet 63:417–425. doi: 10.1007/s00294-016-0656-5. [DOI] [PubMed] [Google Scholar]
- 17.Roux A, Todd DA, Velazquez JV, Cech NB, Sonenshein AL. 2014. CodY-mediated regulation of the Staphylococcus aureus Agr system integrates nutritional and population density signals. J Bacteriol 196:1184–1196. doi: 10.1128/JB.00128-13. [DOI] [PMC free article] [PubMed] [Google Scholar]
- 18.Montgomery CP, Boyle-Vavra S, Roux A, Ebine K, Sonenshein AL, Daum RS. 2012. CodY deletion enhances in vivo virulence of community-associated methicillin-resistant Staphylococcus aureus clone USA300. Infect Immun 80:2382–2389. doi: 10.1128/IAI.06172-11. [DOI] [PMC free article] [PubMed] [Google Scholar]
- 19.Seidl K, Stucki M, Ruegg M, Goerke C, Wolz C, Harris L, Berger-Bachi B, Bischoff M. 2006. Staphylococcus aureus CcpA affects virulence determinant production and antibiotic resistance. Antimicrob Agents Chemother 50:1183–1194. doi: 10.1128/AAC.50.4.1183-1194.2006. [DOI] [PMC free article] [PubMed] [Google Scholar]
- 20.Majerczyk CD, Sadykov MR, Luong TT, Lee C, Somerville GA, Sonenshein AL. 2008. Staphylococcus aureus CodY negatively regulates virulence gene expression. J Bacteriol 190:2257–2265. doi: 10.1128/JB.01545-07. [DOI] [PMC free article] [PubMed] [Google Scholar]
- 21.Majerczyk CD, Dunman PM, Luong TT, Lee CY, Sadykov MR, Somerville GA, Bodi K, Sonenshein AL. 2010. Direct targets of CodY in Staphylococcus aureus. J Bacteriol 192:2861–2877. doi: 10.1128/JB.00220-10. [DOI] [PMC free article] [PubMed] [Google Scholar]
- 22.Mlynek KD, Sause WE, Moormeier DE, Sadykov MR, Hill KR, Torres VJ, Bayles KW, Brinsmade SR. 2018. Nutritional regulation of the Sae two-component system by CodY in Staphylococcus aureus. J Bacteriol 200:e00012-18. doi: 10.1128/JB.00012-18. [DOI] [PMC free article] [PubMed] [Google Scholar]
- 23.Rose IA, Grunberg-Manago M, Korey SR, Ochoa S. 1954. Enzymatic phosphorylation of acetate. J Biol Chem 211:737–756. [PubMed] [Google Scholar]
- 24.Brown TD, Jones-Mortimer MC, Kornberg HL. 1977. The enzymic interconversion of acetate and acetyl-coenzyme A in Escherichia coli. J Gen Microbiol 102:327–336. doi: 10.1099/00221287-102-2-327. [DOI] [PubMed] [Google Scholar]
- 25.Starai VJ, Escalante-Semerena JC. 2004. Acetyl-coenzyme A synthetase (AMP forming). Cell Mol Life Sci 61:2020–2030. doi: 10.1007/s00018-004-3448-x. [DOI] [PMC free article] [PubMed] [Google Scholar]
- 26.Wolfe AJ. 2005. The acetate switch. Microbiol Mol Biol Rev 69:12–50. doi: 10.1128/MMBR.69.1.12-50.2005. [DOI] [PMC free article] [PubMed] [Google Scholar]
- 27.Bose JL, Daly SM, Hall PR, Bayles KW. 2014. Identification of the Staphylococcus aureus vfrAB operon, a novel virulence factor regulatory locus. Infect Immun 82:1813–1822. doi: 10.1128/IAI.01655-13. [DOI] [PMC free article] [PubMed] [Google Scholar]
- 28.Parsons JB, Broussard TC, Bose JL, Rosch JW, Jackson P, Subramanian C, Rock CO. 2014. Identification of a two-component fatty acid kinase responsible for host fatty acid incorporation by Staphylococcus aureus. Proc Natl Acad Sci U S A 111:10532–10537. doi: 10.1073/pnas.1408797111. [DOI] [PMC free article] [PubMed] [Google Scholar]
- 29.Lopez MS, Tan IS, Yan D, Kang J, McCreary M, Modrusan Z, Austin CD, Xu M, Brown EJ. 2017. Host-derived fatty acids activate type VII secretion in Staphylococcus aureus. Proc Natl Acad Sci U S A 114:11223–11228. doi: 10.1073/pnas.1700627114. [DOI] [PMC free article] [PubMed] [Google Scholar]
- 30.Krute CN, Rice KC, Bose JL. 2017. VfrB is a key activator of the Staphylococcus aureus SaeRS two-component system. J Bacteriol 199:e00828-16. [DOI] [PMC free article] [PubMed] [Google Scholar]
- 31.Sabirova JS, Hernalsteens JP, De Backer S, Xavier BB, Moons P, Turlej-Rogacka A, De Greve H, Goossens H, Malhotra-Kumar S. 2015. Fatty acid kinase A is an important determinant of biofilm formation in Staphylococcus aureus USA300. BMC Genomics 16:861. doi: 10.1186/s12864-015-1956-8. [DOI] [PMC free article] [PubMed] [Google Scholar]
- 32.Thomas VC, Sadykov MR, Chaudhari SS, Jones J, Endres JL, Widhelm TJ, Ahn JS, Jawa RS, Zimmerman MC, Bayles KW. 2014. A central role for carbon-overflow pathways in the modulation of bacterial cell death. PLoS Pathog 10:e1004205. doi: 10.1371/journal.ppat.1004205. [DOI] [PMC free article] [PubMed] [Google Scholar]
- 33.Sadykov MR, Thomas VC, Marshall DD, Wenstrom CJ, Moormeier DE, Widhelm TJ, Nuxoll AS, Powers R, Bayles KW. 2013. Inactivation of the Pta-AckA pathway causes cell death in Staphylococcus aureus. J Bacteriol 195:3035–3044. doi: 10.1128/JB.00042-13. [DOI] [PMC free article] [PubMed] [Google Scholar]
- 34.Somerville GA, Said-Salim B, Wickman JM, Raffel SJ, Kreiswirth BN, Musser JM. 2003. Correlation of acetate catabolism and growth yield in Staphylococcus aureus: implications for host-pathogen interactions. Infect Immun 71:4724–4732. doi: 10.1128/IAI.71.8.4724-4732.2003. [DOI] [PMC free article] [PubMed] [Google Scholar]
- 35.Heath RJ, White SW, Rock CO. 2001. Lipid biosynthesis as a target for antibacterial agents. Prog Lipid Res 40:467–497. doi: 10.1016/S0163-7827(01)00012-1. [DOI] [PubMed] [Google Scholar]
- 36.Parsons JB, Rock CO. 2013. Bacterial lipids: metabolism and membrane homeostasis. Prog Lipid Res 52:249–276. doi: 10.1016/j.plipres.2013.02.002. [DOI] [PMC free article] [PubMed] [Google Scholar]
- 37.Atkinson DE, Walton GM. 1967. Adenosine triphosphate conservation in metabolic regulation. Rat liver citrate cleavage enzyme. J Biol Chem 242:3239–3241. [PubMed] [Google Scholar]
- 38.Sonenshein AL. 2005. CodY, a global regulator of stationary phase and virulence in Gram-positive bacteria. Curr Opin Microbiol 8:203–207. doi: 10.1016/j.mib.2005.01.001. [DOI] [PubMed] [Google Scholar]
- 39.Kaiser JC, King AN, Grigg JC, Sheldon JR, Edgell DR, Murphy MEP, Brinsmade SR, Heinrichs DE. 2018. Repression of branched-chain amino acid synthesis in Staphylococcus aureus is mediated by isoleucine via CodY, and by a leucine-rich attenuator peptide. PLoS Genet 14:e1007159. doi: 10.1371/journal.pgen.1007159. [DOI] [PMC free article] [PubMed] [Google Scholar]
- 40.Enjalbert B, Millard P, Dinclaux M, Portais JC, Letisse F. 2017. Acetate fluxes in Escherichia coli are determined by the thermodynamic control of the Pta-AckA pathway. Sci Rep 7:42135. doi: 10.1038/srep42135. [DOI] [PMC free article] [PubMed] [Google Scholar]
- 41.Lei T, Yang J, Ji Y. 2015. Determination of essentiality and regulatory function of staphylococcal YeaZ in branched-chain amino acid biosynthesis. Virulence 6:75–84. doi: 10.4161/21505594.2014.986415. [DOI] [PMC free article] [PubMed] [Google Scholar]
- 42.Lei T, Yang J, Zheng L, Markowski T, Witthuhn BA, Ji Y. 2012. The essentiality of staphylococcal Gcp is independent of its repression of branched-chain amino acids biosynthesis. PLoS One 7:e46836. doi: 10.1371/journal.pone.0046836. [DOI] [PMC free article] [PubMed] [Google Scholar]
- 43.Balemans W, Lounis N, Gilissen R, Guillemont J, Simmen K, Andries K, Koul A. 2010. Essentiality of FASII pathway for Staphylococcus aureus. Nature 463:E3; discussion E4. doi: 10.1038/nature08667. [DOI] [PubMed] [Google Scholar]
- 44.Parsons JB, Frank MW, Subramanian C, Saenkham P, Rock CO. 2011. Metabolic basis for the differential susceptibility of Gram-positive pathogens to fatty acid synthesis inhibitors. Proc Natl Acad Sci U S A 108:15378–15383. doi: 10.1073/pnas.1109208108. [DOI] [PMC free article] [PubMed] [Google Scholar]
- 45.Onal Okyay T, Frigi Rodrigues D. 2013. High throughput colorimetric assay for rapid urease activity quantification. J Microbiol Methods 95:324–326. doi: 10.1016/j.mimet.2013.09.018. [DOI] [PubMed] [Google Scholar]
- 46.Stuart CA, Vanstratum E, Rustigian R. 1945. Further studies on urease production by Proteus and related organisms. J Bacteriol 49:437–444. [DOI] [PMC free article] [PubMed] [Google Scholar]
- 47.Krausz KL, Bose JL. 2016. Bacteriophage transduction in Staphylococcus aureus: broth-based method. Methods Mol Biol 1373:63–68. doi: 10.1007/7651_2014_185. [DOI] [PubMed] [Google Scholar]
- 48.Livak KJ, Schmittgen TD. 2001. Analysis of relative gene expression data using real-time quantitative PCR and the 2(−delta delta C(T)) method. Methods 25:402–408. doi: 10.1006/meth.2001.1262. [DOI] [PubMed] [Google Scholar]
- 49.Lewis AM, Rice KC. 2016. Quantitative real-time PCR (qPCR) workflow for analyzing Staphylococcus aureus gene expression. Methods Mol Biol 1373:143–154. doi: 10.1007/7651_2014_193. [DOI] [PubMed] [Google Scholar]
- 50.Moormeier DE, Endres JL, Mann EE, Sadykov MR, Horswill AR, Rice KC, Fey PD, Bayles KW. 2013. Use of microfluidic technology to analyze gene expr. during Staphylococcus aureus biofilm formation reveals distinct physiological niches. Appl Environ Microbiol 79:3413–3424. doi: 10.1128/AEM.00395-13. [DOI] [PMC free article] [PubMed] [Google Scholar]
- 51.Mogen AB, Carroll RK, James KL, Lima G, Silva D, Culver JA, Petucci C, Shaw LN, Rice KC. 2017. Staphylococcus aureus nitric oxide synthase (saNOS) modulates aerobic respiratory metabolism and cell physiology. Mol Microbiol 105:139–157. doi: 10.1111/mmi.13693. [DOI] [PMC free article] [PubMed] [Google Scholar]
- 52.Kreiswirth BN, Löfdahl S, Betley MJ, O'Reilly M, Schlievert PM, Bergdoll MS, Novick RP. 1983. The toxic shock syndrome exotoxin structural gene is not detectably transmitted by a prophage. Nature 305:709–712. doi: 10.1038/305709a0. [DOI] [PubMed] [Google Scholar]
- 53.Boles BR, Thoendel M, Roth AJ, Horswill AR. 2010. Identification of genes involved in polysaccharide-independent Staphylococcus aureus biofilm formation. PLoS One 5:e10146. doi: 10.1371/journal.pone.0010146. [DOI] [PMC free article] [PubMed] [Google Scholar]
- 54.Fey PD, Endres JL, Yajjala VK, Widhelm TJ, Boissy RJ, Bose JL, Bayles KW. 2013. A genetic resource for rapid and comprehensive phenotype screening of nonessential Staphylococcus aureus genes. mBio 4:e00537-12. doi: 10.1128/mBio.00537-12. [DOI] [PMC free article] [PubMed] [Google Scholar]
- 55.Lehman MK, Bose JL, Sharma-Kuinkel BK, Moormeier DE, Endres JL, Sadykov MR, Biswas I, Bayles KW. 2015. Identification of the amino acids essential for LytSR-mediated signal transduction in Staphylococcus aureus and their roles in biofilm-specific gene expression. Mol Microbiol 95:723–737. doi: 10.1111/mmi.12902. [DOI] [PMC free article] [PubMed] [Google Scholar]
Associated Data
This section collects any data citations, data availability statements, or supplementary materials included in this article.


