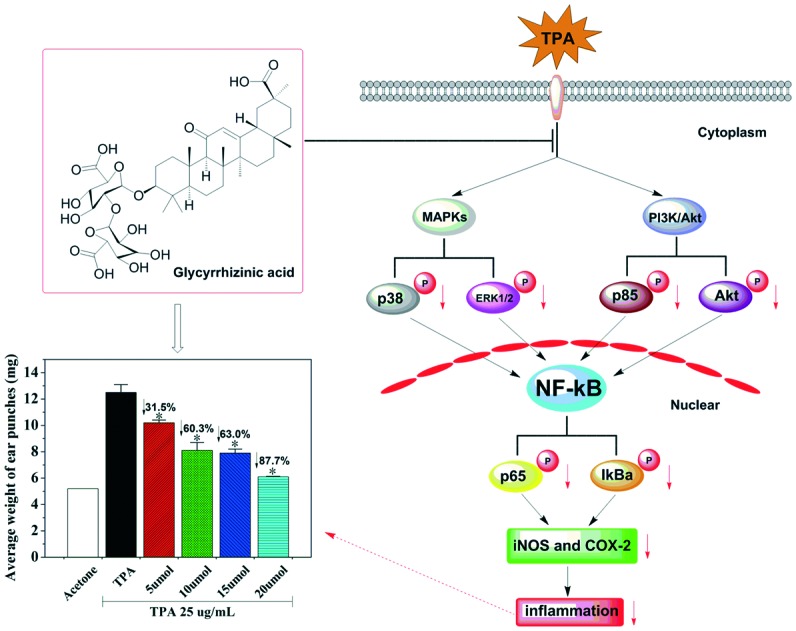
 Glycyrrhizinic acid (GA), a principal component derived from licorice, is attracting considerable attention because of its broad range of bioactivities.
Abstract
Glycyrrhizinic acid (GA), a principal component derived from licorice which is used extensively as a natural sweetener and traditional folk herbal medicine, is attracting considerable attention because of its broad range of bioactivities. However, the anti-inflammatory mechanism of GA on 12-O-tetradecanoylphorbol-13-acetate (TPA)-mediated skin inflammation has not been elucidated. Herein, we investigated the anti-inflammatory activity of GA by using a TPA-induced mouse ear model. It was indicated that GA, applied topically onto mouse ears, effectively inhibited the TPA-mediated expressions of inducible nitric oxide synthase (iNOS) and cyclooxygenase-2 (COX-2) in a dose-dependent manner, respectively. Mechanistic investigations demonstrated that GA down-regulated the expressions of IκBα and p65 and blocked the phosphorylation of IκBα and p65 in TPA-induced mouse skin. Moreover, GA significantly inhibited the TPA-mediated activation of extracellular signal-regulated kinase (ERK1/2), p38 mitogen-activated protein kinase (MAPK), and phosphatidylinositol 3-kinase (PI3K)/Akt, which are upstream of nuclear factor-kB (NF-κB). Taken together, these results indicated that GA, being of natural origin, may be a potential agent for preventing inflammatory diseases.
Introduction
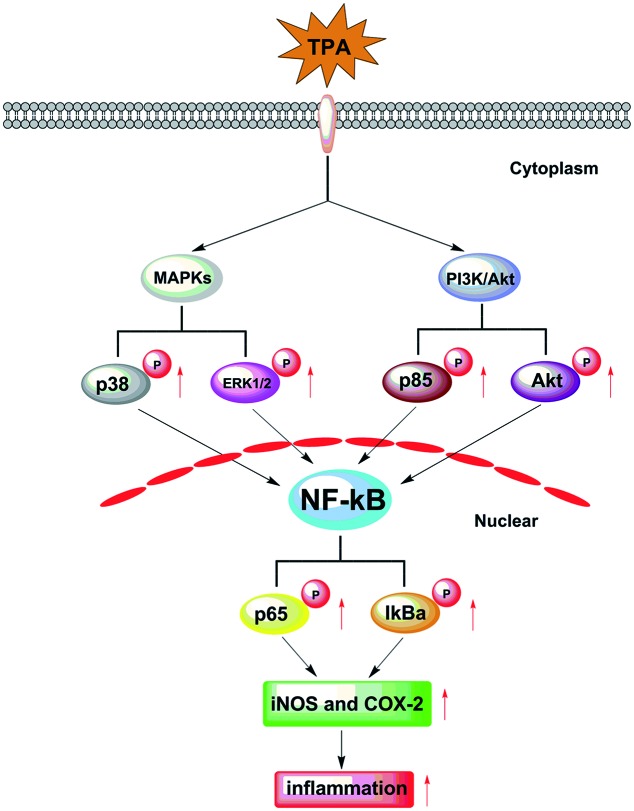
Inflammation in response to various activating stimuli1 is implicated in the pathogenesis of a variety of diseases, including arthritis,2 neurodegenerative diseases,3 and even several types of cancers.4 It was demonstrated that nuclear factor-kB (NF-κB) plays a critical role in the inflammatory response through the release of various inducible inflammatory cytokines, such as inducible nitric oxide synthase (iNOS) and cyclooxygenase-2 (COX-2), which results in inflammation.5 Moreover, the cytokine function in the induction of NF-κB activity through extracellular signal-regulated kinase (ERK1/2), p38 mitogen-activated protein kinase (MAPK) and phosphatidylinositol 3-kinase (PI3K)/Akt pathways was indicated (Fig. 1).6,7 Currently, bioactive components, derived from natural products, have contributed greatly to the discovery and development of new therapeutic drugs in chemoprevention of inflammatory diseases.8,9 Epidemiological studies indicated that the clinical applications of medical plants are novel trends in medicinal research.10–12 Considering these, efforts focusing on finding bioactive components from traditional folk herbal medicines that show anti-inflammatory properties are urgently required.
Fig. 1. The TPA-induced over-expression of iNOS and COX-2 which results in skin inflammation by targeting the MAPK/NF-kB and PI3K/Akt/NF-kB pathways.
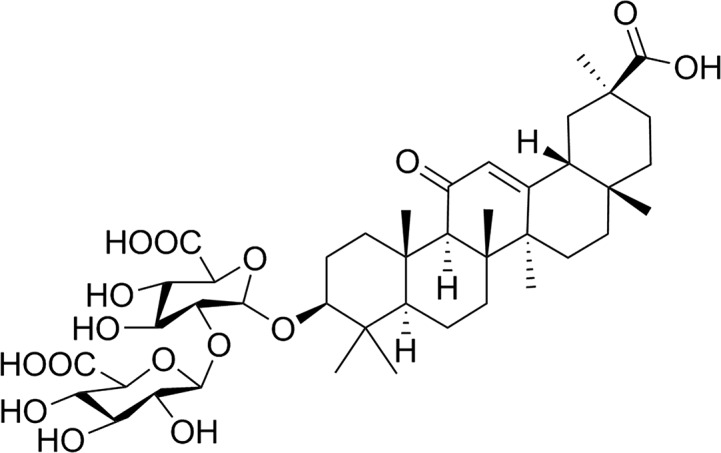
Licorice, distributed in Asia and Europe,13 contains a variety of active constituents which show a wide range of biological activities, such as anti-inflammatory,14 anti-cancer,15 neuro-protective16 and hepatoprotective activities.17 The fresh leaves of licorice are traditionally used for wounds.18 The roots of licorice have been used as a traditional drug for the treatment of cough and stomachache.19 Moreover, the stems of licorice have been widely used to treat diabetes.20 In addition, it has been confirmed that glycyrrhizic acid (GA, Fig. 2), one of the principal components of licorice, is responsible for licorice's bioactivities, including anti-inflammatory activity.21 Previous studies demonstrated that GA effectively inhibited inflammatory responses by suppression of NF-κB in a lipopolysaccharide (LPS)-stimulated macrophage model.22 Furthermore, GA was reported to attenuate the over-expressions of tumor necrosis factor-α (TNF-α), COX-2 and iNOS in neuronal cells in the mouse hippocampus.23 However, studies addressing the effects of GA on TPA-induced skin inflammation and the anti-inflammatory mechanisms of action for GA on skin inflammation are still lacking.
Fig. 2. Chemical structure of GA.
Here, our study aims to elucidate the molecular mechanism responsible for the anti-inflammatory effects of GA. Hence, we firstly designed to investigate the effects of GA on skin inflammation in a TPA-induced mouse ear edema model. Secondly, we identified the dose-dependent inhibitory effects of GA on inflammatory mediators (iNOS and COX-2). Moreover, further immunohistochemical analysis of the mechanism demonstrated that GA effectively suppressed the TPA-induced expression of NF-κB activation by inhibiting the MAPK and PI3K/Akt signaling pathways. Consequently, GA may be a naturally occurring anti-inflammatory agent for the prevention of inflammatory skin diseases.
Experimental procedures
Materials
GA (purity ≥98%) was supplied by J&K Scientific Co. (Shanghai, China). GA at different concentrations was dissolved in a 100 μL vehicle (DMSO : methylene chloride = 20 : 80). TPA (purity >99.9%) was obtained from Qcbio Science & Technologies Co., Ltd (Shanghai, China). TPA was dissolved in acetone at 25 μg mL–1 (w.t. = 616.84). Prednisolone was used as a reference compound. DMSO, dichloromethane and other chemicals were used in the purest form available commercially. iNOS (bs-2072R), COX-2 (bs-0732R) and primary antibodies against p65 (bs-0465R), p-p65 (Ser536, bs-0982R), ERK1/2 (bs-2637R), p-ERK1/2 (Thr202+Tyr204, bs-3016R), p38 (bs-0637R), p-p38 (Tyr323, bs-5477R), Akt (bs-0115R), p-Akt (Ser473, bs-0876R), p85 (bs-0128R), p-p85 (Tyr467+Tyr199, bs-3332R) and p-IκB-α (Ser32, bs-18128R) were obtained from Bioss Biotechnology Co. (Beijing, China). Antibodies against IκB-α (AI096) were purchased from Beyotime Biotechnology Co. (Beijing, China).
Animals
Female BALB/c mice at 4 or 5 weeks old (approval documents: SCXK/20160041), purchased, maintained, and handled using protocols approved by the Center of Animal Test of Southern Medical University and Nanfang Hospital (Guangzhou, China), were randomly divided into six groups (n = 3). All the animals were group housed (25 ± 1 °C at 50% relative humidity) and provided with standard laboratory diet and water. All the experiments were performed in compliance with the National Institute of Health's Guide for the Care and Use of Laboratory Animals (the 7th edition, USA). For the mouse ear edema model, which was described in the research of Kim,24 both ears of the mice were topically treated with a total of 30 μL of GA solution at doses of 50 mM, 100 mM, 150 mM and 200 mM, respectively, 15 min prior to topical application of a total of 30 μL of TPA solution (25 μg mL–1). The mice were then euthanized after 6 h. Two ear punches (6 mm in diameter) from both ears were taken and weighed.
Control group
The animals of this group were given topical application of acetone following vehicle (DMSO : methylene chloride = 20 : 80) treatment.
TPA group
The mouse ears were treated with the topical application of only TPA following vehicle treatment.
GA group
The mouse ears of the GA group were given pre-treatment of GA at four different concentrations in a 0.1 ml vehicle, 15 min before TPA application.
Subsequently, the pharmacological experiments using the different administration methods were performed at a dose of 200 mM. The BALB/c mice were randomly divided into six groups, comprising three kinds of administration methods and their respective contrast groups (n = 3). Administration to the mice was performed using topical application (TOPIC), oral administration (ORAL) and intraperitoneal injection (INTER). GA at 200 mM was administered to the mice by the three methods and prednisolone at 5 mM (contrast groups) was applied topically onto the mouse ears, respectively, 15 min prior to TPA treatment. The mice were then euthanized after different times (3 h, 6 h, 12 h, 24 h and 48 h). Two ear punches (6 mm in diameter) from both ears were taken and weighed. Moreover, at different time (3 h, 6 h, 12 h, 24 h and 48 h) intervals, the ear thickness was measured using a dial thickness gauge (Lux Scientific Instrument, USA), and the increase in thickness in the control group was regarded as edematous inflammation. Epidermal hyperplasia and dense dermal leucocyte infiltration were observed as indicators of histological changes with a microscope (Olympus, Japan) at least in five different regions.
Histological assessment of tissue alterations
The female BALB/c mice were all sacrificed after 6 hours. Both ears were removed in toto, fixed in 4% paraformaldehyde (PFA), decalcified in EDTA buffer, subjected in a series progression of dehydration, and then embedded in paraffin. The samples were serially sectioned at 4 μm and processed routinely for hematoxylin and eosin (H&E) staining. The histological changes were observed under a microscope.
MicroPET-CT imaging of mouse ears
After 24 hours of GA application, microPET-CT was conducted to evaluate the effect of GA on glucose uptake in mouse ears from all the groups. Food was removed from the mouse cage 12 h before the study. The animals were anesthetized with 7% chloral hydrate and then intraperitoneally injected with 18F-fluorodeoxyglucose (18F-FDG). Sixty minutes after 18F-FDG injection, the mice were scanned by using an Inveon Micro-PET/CT system (Siemens Healthineers, Munich, Germany). After PET acquisition, the microPET-CT images were reconstructed using the microPET-CT manager (Siemens Medical Solutions USA, Inc.). This produced mouse ear images of the mice for analysis. The region-of-interest was drawn guided by the CT images and the tracer uptake was measured using the software Inveon Research Workplace. Quantification of the 18F-FDG uptake in mouse ears was conducted to obtain the maximum standardized uptake value (SUVmax) and mean standardized uptake value (SUVmean).25
Determination of iNOS and COX-2
After sacrifice, both ears of the female BALB/c mice were removed and the deparaffinized skin sections (4 μm) were incubated with 1.2% H2O2 in PBS to quench the endogenous peroxidase activity. The primary antibody of proliferating cell nuclear antigen was diluted 100 times and then applied to each section overnight at 4 °C. After washing with PBS, the sections were incubated with a biotin-conjugated horseradish peroxidase antibody (1 : 200) for 1 h at room temperature. Finally, the peroxidase was detected using the 3,3-diaminobenzidine tetrahydrochloride reaction, which produced the brown spots in the epidermal tissue. The numbers of positive staining cells were counted in five different fields at both ends as well as in the middle for each section.
Assays of p65, phospho-p65, IκBa, phospho-IκBa, ERK1/2, phospho-ERK1/2, p38, phospho-p38, Akt, phospho-Akt, p85, and phospho-p85
The NF-κB activity and MAPK and PI3K/Akt signaling pathways were measured by immunohistochemical analysis, respectively. Firstly, the mouse ears of the female BALB/c mice were removed in toto, fixed in 4% PFA, decalcified in EDTA buffer, subjected in a series progression of dehydration, and then embedded in paraffin. Secondly, the samples prepared completely were serially sectioned at 4 μm and processed routinely for staining. Thirdly, the p65, phospho-p65, IκBa, phospho-IκBa, ERK1/2, phospho-ERK1/2, p38, phospho-p38, Akt, phospho-Akt, p85, and phospho-p85 rabbit antibodies (1 : 400; IHC Preferred) were incubated after heat-induced epitope retrieval (HIER) with citrate buffer (pH 6.0) and steam pretreatment for 30 minutes, and the samples were then incubated with a rabbit antibody followed by a secondary antibody, biotinylated goat anti-rabbit IgG (bs-0295G; 1 : 200). Finally, the histological changes were examined under a microscope.
Scoring the expression of biomarkers
For each mouse ear, ≥5 ducts per histologic type of TPA-induced ductal lesion were scored independently by two experienced investigators not aware of the identity of the specimens (×200). For iNOS, COX-2, p65, p-p65, IκBa, p-IκBa, ERK1/2, p-ERK1/2, p38, p-p38, Akt, p-Akt, p85 and p-p85, we used the following semi-quantitative scoring system. The intensity of staining was scored as follows: 0, no staining; 1+, faint; 2+, moderate; 3+, strong. 1+, 2+, and 3+ were recorded as 1, 2, and 3 points, respectively. The extent of staining was graded as follows: 0, no staining; 1+, ≤25% of cells positive; 2+, 26% to 50% of cells positive; 3+, ≥51% of cells positive.26
Statistical analysis
The results are presented as the mean ± SE. The data are presented as the mean ± S.D. Comparison of more than two groups was made with one-way analysis of variance ANOVA followed by Dunnett's t-test. *P values less than 0.05 (*P < 0.05) were considered indicative of significance.
Results and discussion
Inhibitory effects of GA on mouse ear edema stimulated by TPA
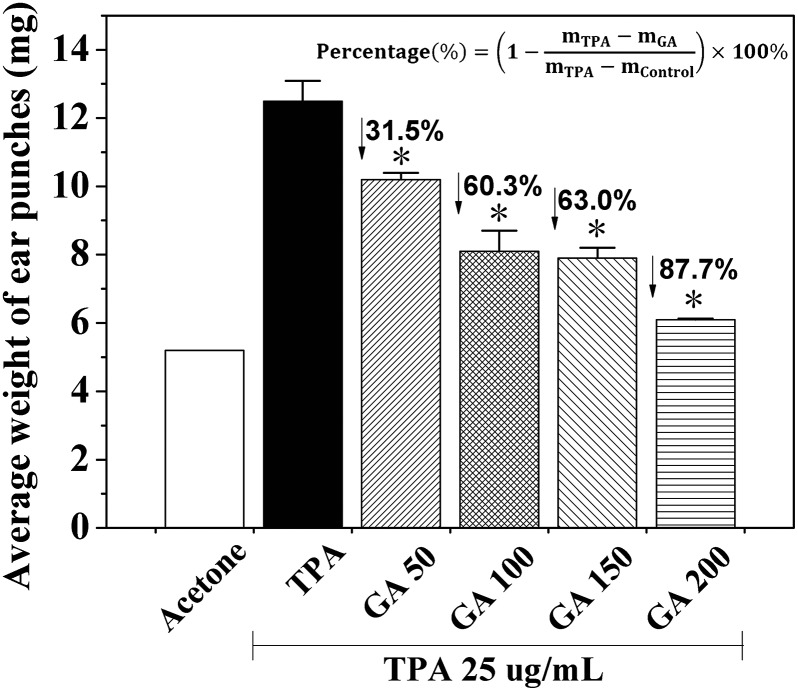
It is well-known that TPA is a promoter of skin tumorigenesis.5 Thus, to examine whether GA has any inhibitory effect on skin inflammation, we determined the effects of GA at four different concentrations by using a TPA-induced mouse ear edema model. When TPA was applied topically onto the mouse ears of the female BALB/c mice, the average weight of the ear punches (d = 6 mm) increased drastically from 5.2 mg to 12.5 mg (Fig. 3). Moreover, pretreatment with GA (50 mM, 100 mM, 150 mM and 200 mM) of the mouse ears before TPA treatment caused significant decreases in the average weight of the ear punches, resulting in 31.5, 60.3, 63.0 and 87.7%, respectively. These results indicated that pretreatment with GA, 15 min prior to TPA treatment, resulted in a dose-dependent decrease in the average weight of the ear punches. Furthermore, the differences in the decrease in the average weight of the ear punches between the TPA-induced group and any GA-treated group were statistically significant (P < 0.05).
Fig. 3. Effects of GA at four different concentrations on TPA-induced ear edema in the female BALB/c mice. Each value is the mean ± SD from six separate experiments performed in triplicate. *P < 0.05 (Dunnett's t-test) versus TPA-treated mice.
To evaluate the inhibitory effects of different administration routes for GA against TPA-stimulated mouse ear edema, we applied GA at 200 mM and prednisolone at 5 mM to determine the average weight variations of the ear punches after three different administration routes (TOPIC, ORAL and INTER) at different times. The in vivo results showed that topical application of GA significantly inhibited the average weight of the ear punches at all times up to 48 h, while a decrease in the average weight after oral administration was particularly obvious after 24 h, and intraperitoneal injection induced an increase in the average weight (Table 1). Furthermore, the average weight after topical application decreased by 87.1%, 87.7%, 87.5%, 89.9% and 88.7% for 5 mg of GA onto both mouse ears at 3 h, 6 h, 12 h, 24 h and 48 h, respectively. It was also demonstrated that GA at 200 mM, administered orally, provoked an average weight decrease of 66.7% and 64.5% at 24 h and 48 h. Additionally, prednisolone had more potent activity in the same model. Considered together, of the three different administration routes, the effects of GA on the average weight by topical application persisted for the longest time than those by other administration methods. Moreover, topical application showed the highest inhibition, and intraperitoneal injection provoked inflammation induction.
Table 1. Preventive effects of GA on TPA-induced ear edema.
| Preventive effect | ||||||
| Compounds | Total dose | Changes in the average weight of ear punches (mg) |
||||
| (mM) | 3 h | 6 h | 12 h | 24 h | 48 h | |
| Control | — | 5.2 | 5.2 | 5.3 ± 0.1 | 5.3 ± 0.2 | 5.2 |
| TPA | — | 8.3 ± 0.1 | 12.5 ± 0.3 | 12.4 ± 0.1 | 12.1 ± 0.2 | 11.4 ± 0.3 |
| GA (TOPIC) | 200 | 5.6 ± 0.1 | 6.1 ± 0.2 a | 6.1 ± 0.2 a | 5.9 ± 0.3 a | 5.9 ± 0.2 a |
| GA (ORAL) | 200 | 8.0 ± 0.2 | 12.3 ± 0.1 | 12.1 ± 0.3 | 7.5 ± 0.2 a | 7.4 ± 0.4 a |
| GA (INTER) | 200 | 7.8 ± 0.3 | 14.6 ± 0.5 | 14.1 ± 0.3 a | 13.5 ± 0.4 | 13.1 ± 0.2 a |
| Prednisolone | 5 | 5.4 ± 0.1 | 5.6 ± 0.1 a | 5.7 ± 0.2 | 5.6 ± 0.3 a | 5.6 ± 0.1 a |
aThe data were presented as the mean ± S.D. for six different experiments performed in triplicate. *P < 0.1 as compared with the TPA group.
It was reported that large amounts of GA administrated orally resulted in side effects, such as severe hypertension, hypokalemia and other signs of mineralocorticoid excess.27 Our results indicated that GA, used for transdermal application, may be avoidance of side effects of oral administration. Furthermore, it is worthwhile for us to investigate the anti-inflammatory mechanism of GA at four different concentrations in TPA-stimulated skin inflammation.
Effects of GA on TPA-induced mouse ear edema
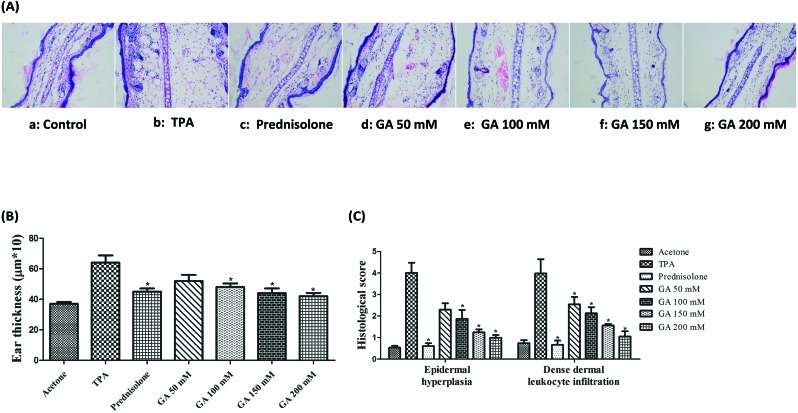
Based on the ability of GA to decrease the average weight of ear punches, we examined its effects on histological appearance in the TPA-stimulated ear edema model using H&E staining. As shown in Fig. 4A, the control mice (acetone treatment) had morphologically normal epidermis without any significant lesion. Histological analysis indicates that TPA treatment results in a marked swelling and a significant increase in ear thickness with a large amount of inflammatory cells infiltrating the dermis (Fig. 4B). Furthermore, the effect of GA topically applied onto the mouse ears was further observed on the mouse ear histological alteration caused by TPA application with reference to neutrophil infiltration and epidermal hyperplasia, as shown in Fig. 4C. The results indicate that TPA application results in a considerable increase in leucocyte infiltration and epidermal thickening in the TPA group as compared with the control group. Additionally, pre-treatment with GA dose-dependently diminishes the TPA-stimulated leucocyte infiltration as well as hyperplasia.
Fig. 4. Determination of TPA-stimulated mouse ears pretreated with acetone, TPA and GA at four different concentrations before TPA treatment. (4A) H & E-stained sections of TPA-stimulated mouse ears pretreated with acetone, TPA and GA at four different concentrations before TPA treatment. (4B) Ear thickness of TPA-stimulated mouse ears pretreated with acetone, TPA and GA at four different concentrations before TPA treatment. (4C) Histological scores of TPA-stimulated mouse ears pretreated with acetone, TPA and GA at four different concentrations before TPA treatment. The data were presented as mean ± S.D. *P < 0.05 (Dunnett's t-test) as compared with the TPA group. Magnification 200×.
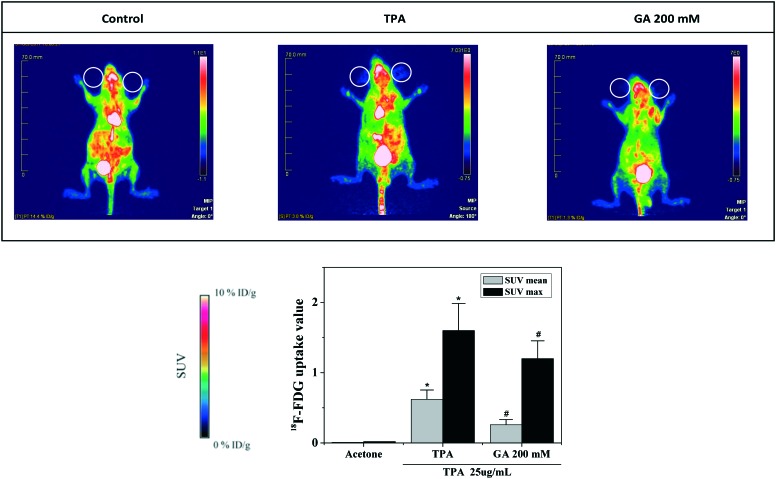
It was confirmed that abnormal glucose tolerance is associated with chronic inflammation.28 Herein, to evaluate the relevance of GA at 200 mM to TPA-induced mouse ear edema in mice, we determined the glucose uptake in mouse ears by 18F-FDG-PET. As shown in Fig. 5, microPET-CT imaging indicated a distinct difference in 18F-FDG uptake intensity in the mouse ears of the control and TPA groups, while topical application of GA at 200 mM significantly decreased the 18F-FDG uptake in the mouse ears. The results demonstrated that GA effectively reduced the inflammatory responses stimulated by TPA.
Fig. 5. MicroPET-CT images and 18F-FDG uptake of TPA-induced mouse ear edema.
Effects of GA on TPA-induced iNOS and COX-2
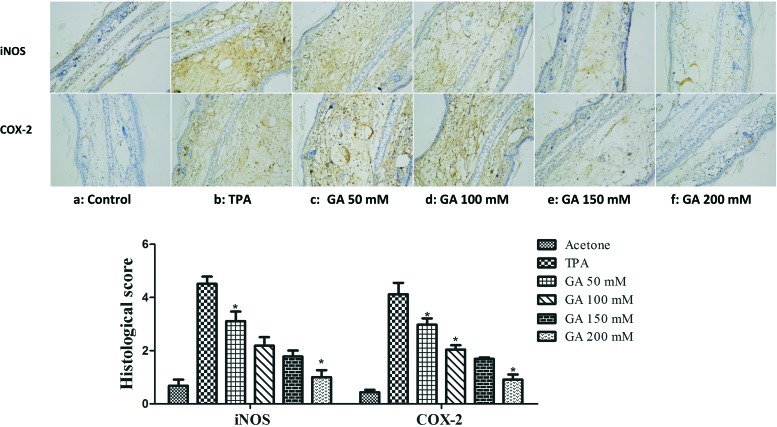
It is widely recognized that the released inducible inflammatory cytokines, particularly iNOS and COX-2, are key mediators of the cutaneous inflammatory response.29 Herein, to examine whether GA has any influence on TPA-induced iNOS and COX-2 expression, we next determined the effect of GA at four different concentrations (50 mM, 100 mM, 150 mM and 200 mM) on TPA-induced mouse ear edema. As described in Fig. 6, GA, administered topically onto the mouse ears before TPA treatment, decreased the TPA-induced expression of iNOS and COX-2 in a dose-dependent manner. In addition, GA at 200 mM markedly inhibited iNOS and COX-2. It was demonstrated that the reduction in TPA-induced skin inflammation may partially account for GA inhibition of the over-expression of inducible inflammatory cytokines (iNOS and COX-2).
Fig. 6. Immunohistochemical staining of iNOS and COX-2 in mouse ears pretreated with acetone, TPA and GA at four different concentrations before TPA treatment. The data are presented as the mean ± S.D. *P < 0.05 (Dunnett's t-test) as compared with the TPA group. Magnification 200×.
Inhibitory effects of GA on NF-κB activation
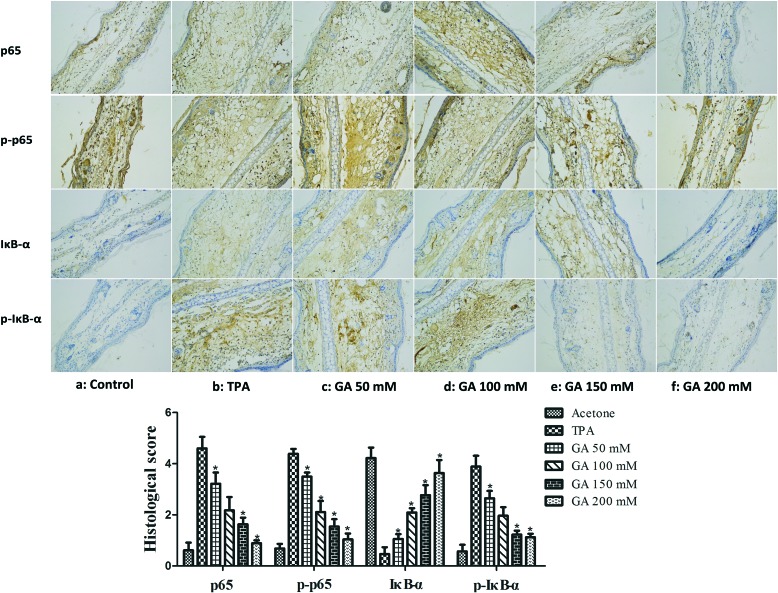
It was indicated that inducible pro-inflammatory genes, such as iNOS and COX-2, are implicated in NF-κB.30 Furthermore, NF-κB activation, stimulated by TPA, has been found to be modulated by multiple phosphorylations of IκBα, p50 and p65 subunits.31 Therefore, it is of importance to determine whether GA at four different concentrations affected TPA-induced NF-κB activation. The immunostaining results revealed that single treatment with TPA of the mouse ears drastically increased IκBα degradation and p65 expression (Fig. 7). By topical application of GA before TPA treatment, the inhibitory effect of GA on TPA-induced degradation of IκBα and phosphorylation of IκBα and p65 was exhibited in a dose-dependent manner. The results suggested that GA could block NF-κB activation, thereby down-regulating the expression of iNOS and COX-2.
Fig. 7. Immunohistochemical staining of p65, p-p65, IκBα and p-IκBα in mouse ears pretreated with acetone, TPA and GA at four different concentrations before TPA treatment. The data are presented as the mean ± S.D. *P < 0.05 (Dunnett's t-test) as compared with the TPA group. Magnification 200×.
Effects of GA on TPA-induced activation of the MAPK signaling pathway
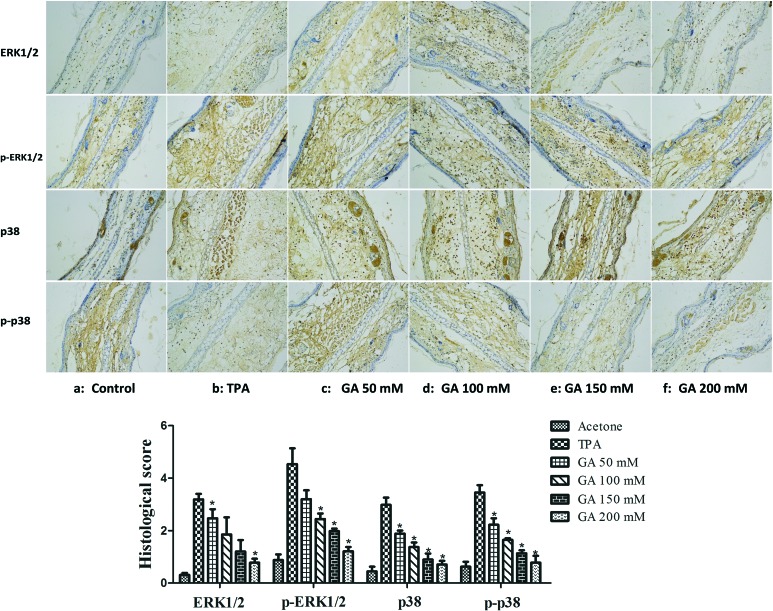
The MAPK signaling pathway, implicated in NF-κB activation, was confirmed to be activated in response to pathological stimuli in vivo.6 We herein investigated the effect of GA on the MAPK signaling pathway in TPA-induced mouse ear edema. As depicted in Fig. 8, treatment with TPA alone caused a marked increase in the phosphorylation of ERK1/2 and p38 in mouse ear edema as compared to that in the acetone control. However, pretreatment with GA dose-dependently inhibited the phosphorylation of p38 and ERK1/2 in the TPA-treated mouse ear edema model. Furthermore, there was a significant inhibitory effect of GA at 200 mM. Based on these results, it was suggested that GA may be a promising anti-inflammatory agent by influencing the MAPK signaling pathway which is well-connected with inflammation.
Fig. 8. Immunohistochemical staining of ERK1/2, p-ERK1/2, p38, and p-p38 in mouse ears pretreated with acetone, vehicle and GA at four different concentrations before TPA treatment. The data are presented as the mean ± S.D. *P < 0.05 (Dunnett's t-test) as compared with the TPA group. Magnification 200×.
Inhibitory effects of GA on TPA-induced activation of the PI3K/Akt signaling pathway
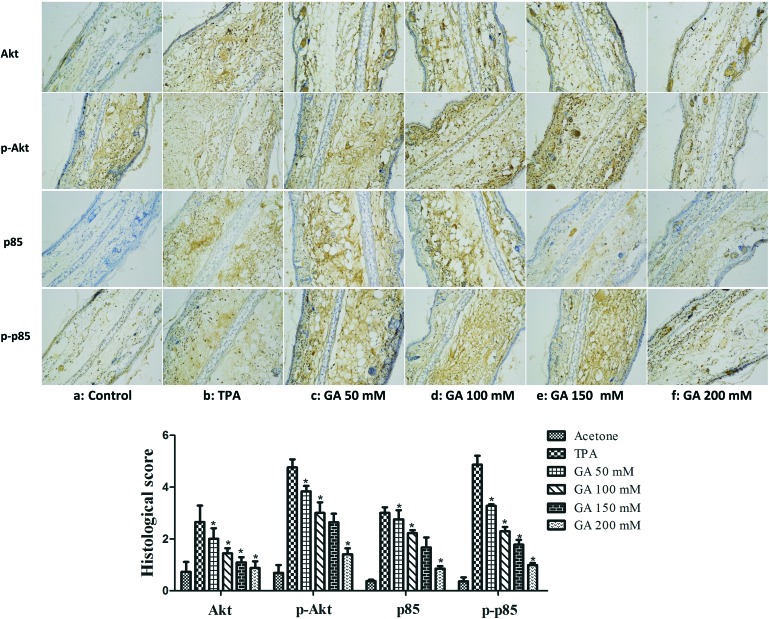
Studies have shown that the PI3K/Akt signaling pathway is involved in the TPA-induced up-expression of iNOS and COX-2 by modulating signaling via NF-κB.7 Thus, it is necessary to further understand the regulatory effects of GA on the PI3K/Akt signalling pathway. The results showed that TPA induced a significant increase in Akt and PI3K p85. Moreover, pretreatment with GA at four different concentrations significantly suppressed the TPA-induced expression of Akt and PI3K p85 (Fig. 9). We further confirmed that the phosphorylation of Akt and PI3K p85 was also reduced by topical application of GA in a dose-dependent manner. It was found that GA treatment effectively inhibited the TPA-induced activation of the PI3K/Akt signalling pathway, thereby blocking NF-κB activation, which resulted in down-regulation of the expression of iNOS and COX-2.
Fig. 9. Immunohistochemical staining of Akt, p-Akt, PI3K p85 and p-PI3K p85 in mouse ears pretreated with acetone, TPA and GA at four different concentrations before TPA treatment. The data are presented as the mean ± S.D. *P < 0.05 (Dunnett's t-test) as compared with the TPA group. Magnification 200×.
It is well-known that TPA primarily leads to the activation of the MAPK/NF-κB and PI3K/Akt/NF-κB pathways thereby affecting the over-expression of iNOS and COX-2, which are involved in inflammation-associated diseases.7 The animal experimental data indicated that the anti-inflammatory mechanism of GA, being of natural origin, was that it would inhibit the NF-κB-dependent inflammatory response by directly targeting the MAPK and PI3K/Akt pathways.
Conclusions
In summary, GA, derived from licorice which is used extensively as a natural sweetener and traditional folk herbal medicine, exerts preventive effects on TPA-induced skin inflammation. It was indicated that GA dose-dependently inhibited the TPA-induced activation of the PI3K/Akt signalling pathway, thereby blocking NF-κB activation, which resulted in down-regulation of the expression of iNOS and COX-2. Altogether, the mechanistic studies provided a new insight into the mechanism responsible for the anti-inflammatory activity of GA. It is concluded that GA may serve as a naturally occurring anti-inflammatory agent to prevent skin inflammation.
Conflicts of interest
The authors declare no competing interests.
Acknowledgments
Financial support was provided by the funds of the Science Foundation for Young Teachers of Wuyi University (No: 2016zk04 and 2017td01), the Foundation for Young Talents (No: 2016KQNCX174, 2017GkQNCX006 and 2017KTSCX184), the Doctor Start-up Funds of Wuyi University (No: 2016BS19), the Basic and Theoretical Research Programs of the Science and Technology Foundation of Jiangmen and the Foundation for the Department of Education of Guangdong Province (No: 2016KCXTD005 and 2017KSYS010).
References
- Rao T. S., Currie J. L., Shaffer A. F., Isakson P. C. Inflammation. 1993;17:723–741. doi: 10.1007/BF00920477. [DOI] [PubMed] [Google Scholar]
- Splettstoesser W. D., Schuff-Werner P. Microsc. Res. Tech. 2002;57:441–455. doi: 10.1002/jemt.10098. [DOI] [PubMed] [Google Scholar]
- Lee Y. J., Han S. B., Nam S. Y., Oh K. W., Hong J. T. Arch. Pharmacal Res. 2010;33:1539–1556. doi: 10.1007/s12272-010-1006-7. [DOI] [PubMed] [Google Scholar]
- Coussens L. M., Werb Z. Nature. 2002;420:860–867. doi: 10.1038/nature01322. [DOI] [PMC free article] [PubMed] [Google Scholar]
- Kuo D. H., Lai Y. S., Lo C. Y., Cheng A. C., Wu H., Pan M. H. J. Agric. Food Chem. 2010;58:5777–5783. doi: 10.1021/jf100601r. [DOI] [PubMed] [Google Scholar]
- Agarwal A., Das K., Lerner N., Sathe S., Cicek M., Casey G., Sizemore N. Oncogene. 2005;24:1021–1031. doi: 10.1038/sj.onc.1208296. [DOI] [PubMed] [Google Scholar]
- Pan M. H., Lai C. S., Dushenkov S., Ho C. T. J. Agric. Food Chem. 2009;57:4467–4477. doi: 10.1021/jf900612n. [DOI] [PubMed] [Google Scholar]
- Harvey A. L. Drug Discovery Today. 2008;13:894–901. doi: 10.1016/j.drudis.2008.07.004. [DOI] [PubMed] [Google Scholar]
- Villa F. A., Gerwick L. Immunopharmacol. Immunotoxicol. 2010;32:228–237. doi: 10.3109/08923970903296136. [DOI] [PubMed] [Google Scholar]
- Hsiang C. Y., Cheng H. M., Lo H. Y., Li C. C., Chou P. C., Lee Y. C., Ho T. Y. J. Agric. Food Chem. 2015;63:6051–6058. doi: 10.1021/acs.jafc.5b01801. [DOI] [PubMed] [Google Scholar]
- Pan M. H., Ho C. T. Chem. Soc. Rev. 2008;37:2558–2574. doi: 10.1039/b801558a. [DOI] [PubMed] [Google Scholar]
- Saha A., Blando J., Silver E., Beltran L., Sessler J., DiGiovanni J. Cancer Prev. Res. 2014;7:627–638. doi: 10.1158/1940-6207.CAPR-13-0420. [DOI] [PubMed] [Google Scholar]
- Blumenthal M., Goldberg A. and Brinckmann J., Herbal Medicine: expanded Commission E Monographs, American Botanical Council, Newton, 2000, pp. 233–236.
- Wu T. Y., Khor T. O., Saw C. L., Loh S. C., Chen A. I., Lim S. S., Park J. H., Cai L., Kong A. N. AAPS J. 2011;13:1–13. doi: 10.1208/s12248-010-9239-4. [DOI] [PMC free article] [PubMed] [Google Scholar]
- Li S., Zhu J. H., Cao L. P., Sun Q., Liu H. D., Li W. D., Li J. S., Hang C. H. Neurol. Sci. 2014;35:1115–1120. doi: 10.1007/s10072-014-1661-4. [DOI] [PubMed] [Google Scholar]
- Sharifzadeh M., Shamsa F., Shiran S., Karimfar M. H., Miri A. H., Jalalizadeh H., Gholizadeh S., Salar F., Tabrizian K. Planta Med. 2008;74:485–490. doi: 10.1055/s-2008-1074494. [DOI] [PubMed] [Google Scholar]
- Michel H. E., Tadros M. G., Abdel-Naim A. B., Khalifa A. E. Neurosci. Lett. 2013;544:110–114. doi: 10.1016/j.neulet.2013.03.055. [DOI] [PubMed] [Google Scholar]
- Dafni A., Yaniv Z., Palevitch D. J. Ethnopharmacol. 1984;10:295–310. doi: 10.1016/0378-8741(84)90017-5. [DOI] [PubMed] [Google Scholar]
- Gray A. M., Flatt P. R. Proc. Nutr. Soc. 1997;56:507–517. doi: 10.1079/pns19970051. [DOI] [PubMed] [Google Scholar]
- Rajurkar N. S., Pardeshi B. M. Appl. Radiat. Isot. 1997;48:1059–1062. doi: 10.1016/s0969-8043(97)00103-6. [DOI] [PubMed] [Google Scholar]
- Yang R., Yuan B. C., Ma Y. S., Zhou S., Liu Y. Pharm. Biol. 2017;55:5–18. doi: 10.1080/13880209.2016.1225775. [DOI] [PMC free article] [PubMed] [Google Scholar]
- Wang C. Y., Kao T. C., Lo W. H., Yen G. C. J. Agric. Food Chem. 2011;59:7726–7733. doi: 10.1021/jf2013265. [DOI] [PubMed] [Google Scholar]
- Luo L., Jin Y., Kim I. D., Lee J. K. Exp. Neurobiol. 2013;22:107–115. doi: 10.5607/en.2013.22.2.107. [DOI] [PMC free article] [PubMed] [Google Scholar]
- Park B. K., Heo M. Y., Park H., Kim H. P. Eur. J. Pharmacol. 2001;425:153–157. doi: 10.1016/s0014-2999(01)01187-6. [DOI] [PubMed] [Google Scholar]
- Chen M., Chang Y. Y., Huang S., Xiao L. H., Zhou W., Zhang L. Y., Du Z. Y. Mol. Nutr. Food Res. 2018;62:1700281. doi: 10.1002/mnfr.201700281. [DOI] [PubMed] [Google Scholar]
- Ouyang N., Williams J. L., Tsioulias G. J., Gao J. J., Iatropoulos M. J., Kopelovich L., Kashfi K., Rigas B. Cancer Res. 2006;66:4503–4511. doi: 10.1158/0008-5472.CAN-05-3118. [DOI] [PubMed] [Google Scholar]
- Asl M. N., Hosseinzadeh H. Phytother. Res. 2008;22:709–724. doi: 10.1002/ptr.2362. [DOI] [PMC free article] [PubMed] [Google Scholar]
- Tasali E., Ip M. S. Proc. Am. Thorac. Soc. 2008;5:207–217. doi: 10.1513/pats.200708-139MG. [DOI] [PubMed] [Google Scholar]
- Chun K. S., Cha H. H., Shin J. W., Na H. K., Park K. K., Chung W. Y., Surh Y. J. Carcinogenesis. 2004;25:445–454. doi: 10.1093/carcin/bgh021. [DOI] [PubMed] [Google Scholar]
- Baldwin Jr. A. S. Annu. Rev. Immunol. 1996;14:649–683. doi: 10.1146/annurev.immunol.14.1.649. [DOI] [PubMed] [Google Scholar]
- Israel A. Trends Genet. 1995;11:203–205. doi: 10.1016/s0168-9525(00)89045-9. [DOI] [PubMed] [Google Scholar]


