

Abstract
Innate immune cells recruited to inflammatory sites have short life spans and originate from the marrow, which is distributed throughout the long and flat bones. While bone marrow production and release of leukocyte increases after stroke, it is currently unknown if its activity rises homogeneously throughout the entire hematopoietic system. To address this question, we employed spectrally resolved in vivo cell labeling in the murine skull and tibia. We show that in murine models of stroke and aseptic meningitis, skull bone marrow derived neutrophils are more likely to migrate to the adjacent brain tissue than cells that reside in the tibia. Confocal microscopy of the skull-dura interface revealed myeloid cell migration through microscopic vascular channels crossing the inner skull cortex. These observations point to a direct local interaction between the brain and the skull bone marrow through the meninges.
Introduction
Inflammation is an essential defense and repair mechanism that is tightly orchestrated in many human diseases. The hematopoietic system supplies most cellular components of sterile inflammation. The abundance of circulating innate immune cells correlates closely with mortality1 and fluctuates dramatically after ischemic injury or systemic infection2–5. Once recruited to sites of inflammation, neutrophils and other immune cells may defend against infection but also have destructive properties. This often contributes to tissue damage and impaired organ function. Specifically, ischemic brain recruits myeloid cells2,4,6 after activating the bone marrow via the sympathetic nervous system7. Given the short life span of myeloid cells in blood and in inflamed tissues, the marrow’s supply of these cells influences systemic and local inflammatory activity. The bone marrow is therefore increasingly becoming an organ of therapeutic interest in inflammatory diseases.
On a microscopic scale, functional marrow heterogeneity is being studied intensively, leading to several emerging niche concepts8. Quiescent blood stem cells are thought to reside close to osteoblasts and arterioles, while proliferating hematopoietic progenitors are located close to sinusoids, which are also discussed as the site where leukocytes are released from marrow into the systemic circulation9. Beyond the distinction of red versus yellow marrow, much less is known about the macroscopic heterogeneity of the bone marrow. On the one hand, this relative paucity of data is surprising, given that this organ system literally spans from head to toe, and that there are many different types of long and flat bones. On the other hand, studying such a large and widespread organ is challenging, given that cellular resolution is often required to understand the marrow’s function, in particular cell migration. In vivo sampling in humans relies on bone marrow biopsies which are limited to one site only, mostly the iliac crest.
To begin addressing the knowledge gap on the marrow’s functional heterogeneity, we developed a localized cell tagging approach to label bone marrow cells residing in the mouse skull and tibia with spectrally resolved membrane dyes that serve as cell trackers. This allowed us to determine the origin of leukocytes that were recruited to inflamed tissues after being labeled in the bone marrow. We found that in ischemic and chemically induced models of acute cerebral inflammation, the skull bone marrow contributed significantly more neutrophils than the tibial marrow. Using an organ bath microscopy setup to image the inner surface of the mouse skull, we found that neutrophils take a surprising “shortcut”: myeloid cells migrate towards the inflamed brain through microscopic channels, which cross the inner skull cortex and thus directly connect the skull marrow cavities with the dura.
Results
Spectrally resolved site specific cell tagging
We began by testing two commercially available cell permeant fluorescent dyes with different excitation/emission spectra, FITC and APC, respectively, for their cell labeling efficiency. Cells separately incubated with the dyes in vitro demonstrated excellent concentration dependent labeling which was readily detected by flow cytometry in the respective APC and FITC channels (Fig. 1a). Selective bone marrow microinjection of 3–10 µl cell tracker was then performed in vivo using a Hamilton syringe equipped with a custom 34G blunt needle. Based on the observed in vitro labeling efficiencies, we chose a cell tracker dose for in situ bone marrow labeling that creates a steep fluorescence gradient between the marrow compartment and the systemic circulation. Twenty-four hours after microinjections into the skull and the tibia, we examined the labeling efficiency for neutrophils harvested from the injection and remote control sites, specifically the spleen and blood. We focused on neutrophils because these cells are numerous first responders to tissue injury. Labeled neutrophils were readily detected at sites of injection by flow cytometry (Fig. 1b). Low numbers of labeled cells were also detected in the blood and spleen (Fig. 1b). Cell exposure to locally concentrated dye after injection into the marrow yields high cell-associated fluorescence intensities (Fig. 1b), whereas intravenously injected dye, which resembles cell-unassociated dye leaking into the circulation after marrow injection, was so diluted that we did not detect any labeled cells (Fig. 1c).
Figure 1. Bone marrow cell tagging.
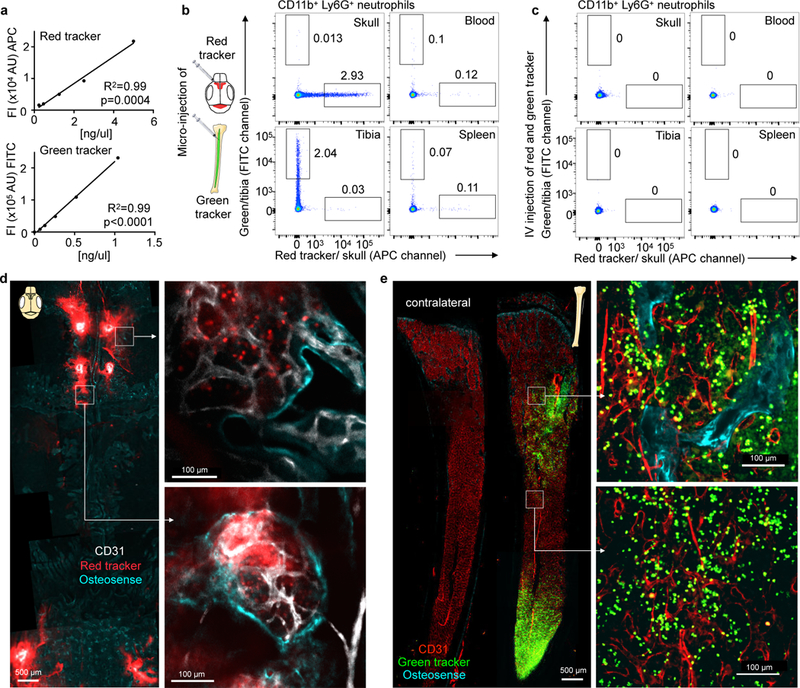
a, Concentration dependent fluorescence intensity of in vitro labeled bone marrow cells by flow cytometry for the red (APC, n=5 mice) and green (FITC, n=6 mice) cell tracker in 2 different experiments. b,c, Representative flow cytometry from naive mice 24 hrs after (b) marrow microinjection of red and green cell tracker or (c) intravenous injection (independently repeated twice with same results). d,e, Confocal imaging of (d) calvarium and (e) tibia after microinjection of red and green cell tracker into 2 different mice (single experiment). Bone outline is visualized with osteosense (turquoise) and endothelium with CD31 in vivo immunolabeling.
Confocal microscopy of the skull (Fig. 1d) and the tibia (Fig. 1e) following cell tracker injection showed locally contained fluorescence and efficient cell labeling. While dye microinjections slightly decreased cell viability, this occurred to the same extend in both compartments, and did not alter marrow cell content or migration of cells to the inflamed brain after stroke (Supplementary Fig. 1a,b). Following skull injections, we used microglia, which are not bone marrow derived, as “witness cells” to explore if skull marrow labeling is locally contained or spills over in inflammatory brain conditions. Microglial cells were only APC positive when red cell tracker was purposely injected through the skull below the dura, but not after injection into the marrow (Supplementary Fig. 1c,d). Taken together, these data demonstrate that intra-marrow cell tracker injections label cells in the skull and tibia with an efficiency sufficient for systemic cell tracking by flow cytometry.
Tracking cell origins in different inflammatory sites
We next used the cell tracking approach to determine relative neutrophil sources in several models of acute inflammation, including ischemic stroke, acute myocardial infarction (MI) and inflammation induced by intracisternal carrageenan injection which leads to aseptic meningoencephalitis10 (Fig. 2). To explore neutrophil contributions to inflammatory sites, we first injected red and green cell tracker into the skull and tibia, respectively. Destination tissues were then processed and stained with an antibody cocktail for flow cytometry detection of cell surface markers, reserving two channels for the spectrally resolved cell trackers. Flow cytometry gates were positioned based on intravenously injected control animals (Supplementary Fig. 2). We focused on neutrophil migration during early inflammation and normalized labeled cell frequencies in tissues of interest to the labeling efficiency at the site of origin (Fig. 2a-e). We found that the skull contributes significantly more neutrophils to the ischemic brain hemisphere than the tibia (Fig. 2a). The frequency of cells originating from the skull or the tibia was not significantly different in the spleen and the blood, with the exception of the spleen 2 days after stroke, which showed a decreased contribution of cells from the tibia (Fig. 2b,c). Raw frequencies and ratios to blood are provided in Supplementary Fig. 3. Like ischemic stroke, intracisternal injection of carrageenan, leading to eningoencephalitis10, also elicited a higher contribution of skull neutrophils to brain inflammation (Fig. 2d). In contrast, one day after MI, the neutrophil contribution of the skull and the tibia, which are both distant to the heart, was comparable (Fig. 2e), indicating that the proximity of brain inflammation to skull bone marrow may influence cell migration paths. We next used ex vivo confocal microscopy of the fresh brain after in vivo staining of the vasculature to explore the location of cells tagged in skull or tibia after induction of meningoencephalitis. We primarily found cells originating from the skull (8 of 12 tagged cells), which were located in the brain parenchyma, outside of the vasculature (Supplementary Fig. 4). The observation of preferential skull neutrophil recruitment to the brain was not caused by the size of the labeled marrow compartment, as the cellularity of one tibia roughly equals that of the skull (Fig. 2f).
Figure 2. Neutrophil tracking in stroke, carrageenan-induced meningoencephalitis and myocardial infarction.
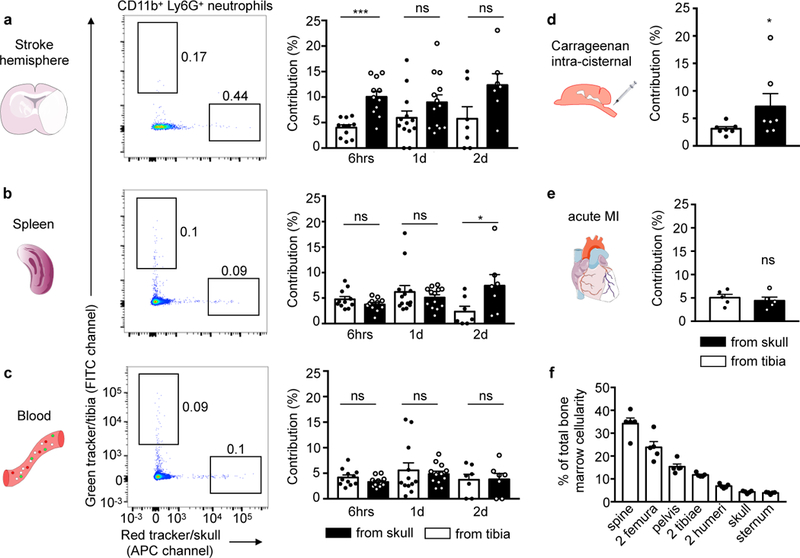
a-c, Representative examples of neutrophil tracking after tagging in skull (red) and one tibia (green tracker) in the same animal, 6 hrs (n=11, 5 experiments), 1 day (n=13 for brain and spleen, n=12 for blood, 5 experiments) and 2 days after stroke induced by permanent occlusion (n=7, 2 experiments). Contribution was normalized to cell frequency at injection site. Two-tailed paired Wilcoxon test; brain, 6hrs, ***P=0.002, 1d, P=0.127, and 2d, P=0.219; spleen, 6hrs, P= 0.206, 1d, P=0.787 and 2d *P=0.016; blood, 6hrs, P=0.153, 1d, P=0.97 and 2d, P=0.812. d, Neutrophil exit from the skull and the tibia in aseptic meningoencephalitis (n=7, 4 experiments, two-tailed paired Wilcoxon test, *P=0.031) and (e) after myocardial infarction (n= 5, 1 experiment, two-tailed Wilcoxon test, P=0.813). f, Size of bone marrow compartments, n=5 mice. Data are mean ± s.e.m. See also Supplementary Fig. 2 for gating and Supplementary Fig. 3 for related analyses.
Figure 3. Skull release more of cells after stroke.
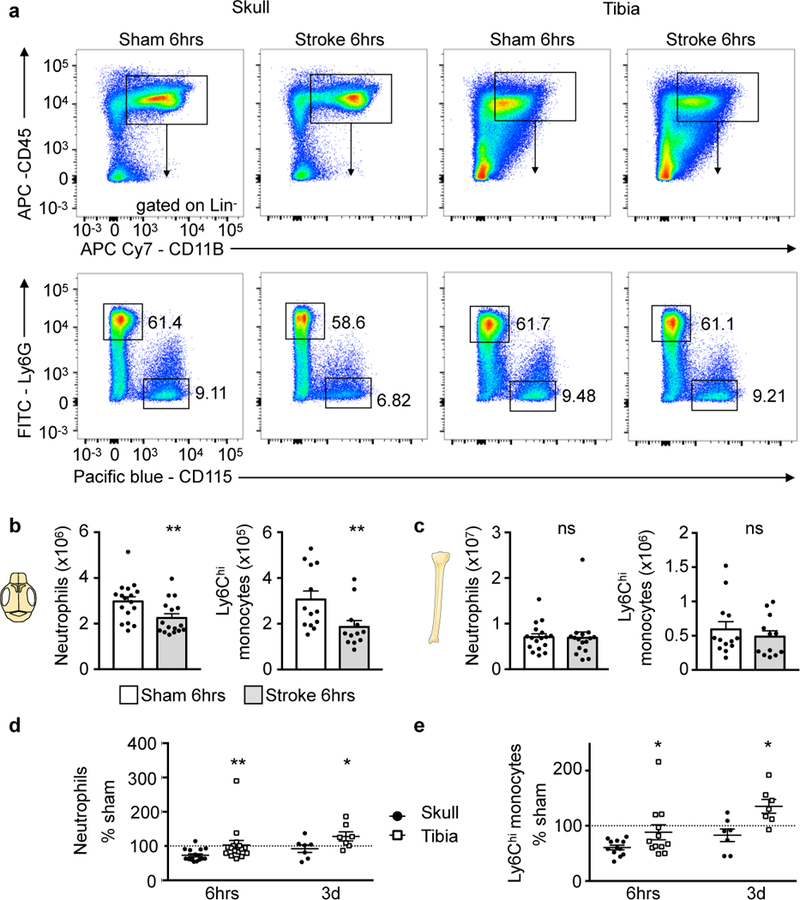
a, Representative flow cytometry plots of skull and tibia bone marrow 6 hours after stroke induced by 30 min tMCAO or sham controls (6 experiments). Additional gating is shown in Supplementary Fig. 2. b, Neutrophil and monocyte numbers in skull after stroke or sham controls. Data are mean ± s.e.m.. Neutrophils, n=16 stroke, n=17 sham, 6 experiments; Ly6Chi monocytes, n=13 stroke, n=12 sham, 4 experiments; two-tailed Mann-Whitney test, neutrophils, **P=0.008; monocytes, **P=0.007. c, Neutrophil and monocyte numbers in both tibiae. Data are mean ± s.e.m.. Neutrophils, n=16 stroke, n=17 sham, 6 experiments; Ly6Chi monocytes, n=13 stroke, n=12 sham, 4 experiments; two-tailed Mann-Whitney test, neutrophils, P=0.49; monocytes, P=0.54. d,e, Data normalized to sham at 6hrs (neutrophils, n=16 and monocytes, n=12 per condition; 4 experiments) and 3 days after stroke (n=7 per condition, 3 experiments) and displayed as mean (center) ± s.e.m. (error bars). Two-tailed paired Wilcoxon test, neutrophils, 6hrs, **P=0.002 skull versus tibia; 3 days, *P=0.031 skull versus tibia; monocytes, 6hrs *P=0.016 skull versus tibia; 3 days,*P=0.016 skull versus tibia. See Supplementary Fig. 5 for spine.
Myeloid cell population dynamics depend on marrow location
To explore whether the observed migration heterogeneity causes differences in the marrow’s myeloid cell numbers, we enumerated neutrophils and monocytes in the skull and tibia at different time points after stroke. Compared to sham controls, stroke led to a significant decrease of neutrophils and monocytes in the skull bone marrow 6 hours after ischemia (Fig. 3a,b), which reflects the release of myeloid cells after brain injury. Interestingly, in the tibia, the cell number did not decrease significantly (Fig. 3a,c). Likewise, the vertebral marrow did not show a major reduction of myeloid cells 6 hours after stroke (Supplementary Fig. 5). When normalized to sham controls, the post-stroke skull marrow contained significantly less neutrophils and monocytes than the tibia (Fig. 3d,e). Viewed together with the higher cell traffic from the skull (Fig. 2a), these data indicate that after stroke, the skull marrow releases myeloid cells more vigorously than the tibia. Comparing naive skull and tibial neutrophils in vitro, we found no difference in the cells’ migration through activated brain endothelium (Supplementary Fig. 6).
To begin deciphering the mechanisms behind the observed marrow heterogeneities, we compared SDF-1 levels between the skull and tibial marrow by ELISA. SDF-1 retains leukocytes in hematopoietic niches, and its decrease leads to monocyte and neutrophil release from the marrow11. SDF-1 production increases in the brain after stroke12. Six hours after stroke, we observed a significant decline in SDF-1 levels in the skull only (Fig. 4a), which may contribute to a preferential release of neutrophil from this site. Since bone marrow vascular permeability may regulate leukocyte release, we assessed this parameter using an Evans Blue assay9. Six hours after stroke, vascular permeability did not change significantly in either skull or tibia (Fig. 4b,c). A trend towards higher permeability of the skull marrow after cisternal carrageenan injection, as well as a decrease in tibial marrow permeability were observed (Fig. 4d). Thus, regional heterogeneities in the leukocyte retention factor SDF-1 and vascular permeability may contribute to the preferred mobilization of skull neutrophils in the context of brain inflammation.
Figure 4. Retention factor SDF-1 and bone marrow permeability.

a, SDF-1 protein ELISA in skull and tibia bone marrow 6hrs after stroke induced by 30 min occlusion. Data are from 2 separate experiments and normalized to the mean sham value. Stroke, n=12 skull, n=12 tibia; sham n=12 skull, n=11 tibia sham. Two-tailed Welch’s t test, skull, *P=0.025; tibia, P=0.567. b, Evans blue permeability after stroke induced by 30min occlusion, n=6 sham, n=8 stroke, 5 experiments. Two-tailed Mann Whitney, skull, P=0.59, tibia, P=0.28. c, Histology of Evans blue in skull and tibia bone marrow after stroke and in sham animals. d, Evans blue permeability after carrageenan injection, control, n=15; carageenan, n=6, 6 experiments; two-tailed Welch’s t test, skull, P=0.112; tibia, *P=0.027. Data are mean ± s.e.m., ns indicates not significant.
Direct vascular channels connect skull marrow and the CNS surface
Since the skull provides relatively more neutrophils to acutely inflamed brain tissue than remote tibial marrow, we tested the hypothesis that this is due to the proximity of the skull marrow to the brain. We reasoned that direct vascular connections could provide either a conduit for danger signals that alert the skull marrow of CNS inflammation or a path for leukocytes that migrate towards the brain. When studying the skull-brain intersection by confocal microcopy on coronal views, we observed a number of channels that connect marrow cavities with the dura mater through the skull’s inner cortex (Fig. 5). The channels were surrounded by osteosense signal (Fig. 5a) which arises from osteoblasts lining the bone surface13. Inside these channels, we detected fluorescent signal for CD31 indicating endothelial lining, Cx3cr1GFP positive monocytes and Ly6G expressing neutrophils (Fig. 5a-c). To image the inside of the skull’s surface, we immersed the freshly harvested skull in an organ bath with the interior surface facing the microscope’s objective (Fig. 5b). In this orientation, we likewise observed numerous channels traversing the inner cortical layer of the skull bone. The experimental setup provided the opportunity to acquire z stacks and time lapse data (Fig. 5d,e). Intriguingly, we frequently observed Ly6G+ neutrophils migrate through channels, ultimately emerging at the inner skull surface (Supplementary movie 1). To determine whether there is cell traffic in these channels in vivo, we next imaged 4 week old mice. Young mice have thinner skulls, which allowed us to image the inner skull bone layers in vivo. In these mice, we observed that the blood flow through channels was directed towards the marrow cavities. However, neutrophils crawled against the flow towards the dura mater after induction of stroke (Fig. 5f, Supplementary movies 2, 3). Neutrophils exited channels more frequently in skulls harvested from mice with brain inflammation after stroke or intracisternal carrageenan injection (Fig. 6a-c, Supplementary movies 4,5).
Figure 5. Ex vivo confocal microscopy of channels connecting the skull marrow to the dura.
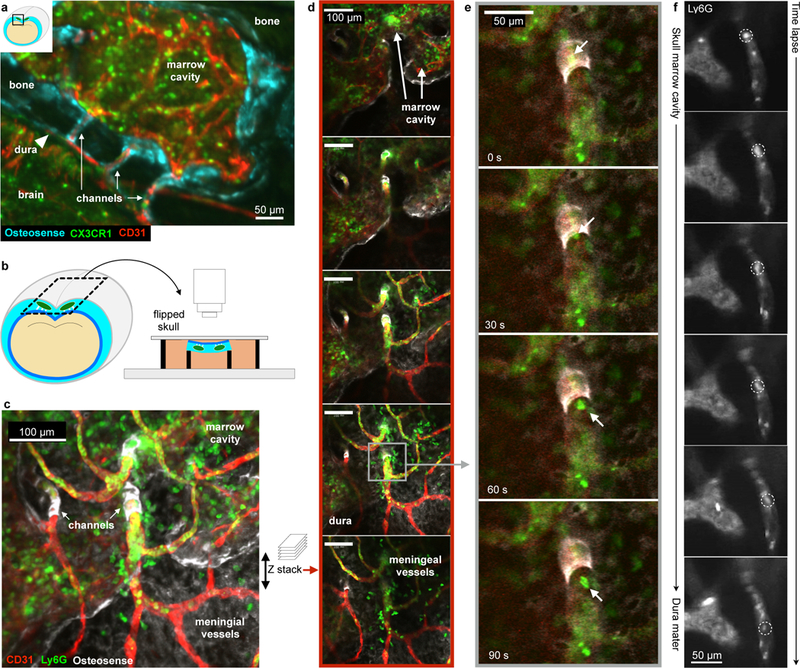
a, Coronal view of the skull and brain in a Cx3cr1GFP mouse showing channels in relation to the brain, bone and dura (single experiment). b, Ex-vivo skull marrow bath using fMLP containing medium. c, Collapsed z stack and (d) single slices after intracisternal carrageenan injection. e, Time series of neutrophil channel exit (replicated 4 times). See also Supplementary movie 1. f, In vivo time lapse of neutrophil migrating through a channel, representative example of imaging in 2 mice after stroke (permanent MCAO). See also Supplementary movie 2,3.
Figure 6. Cells exit channels in organ bath.
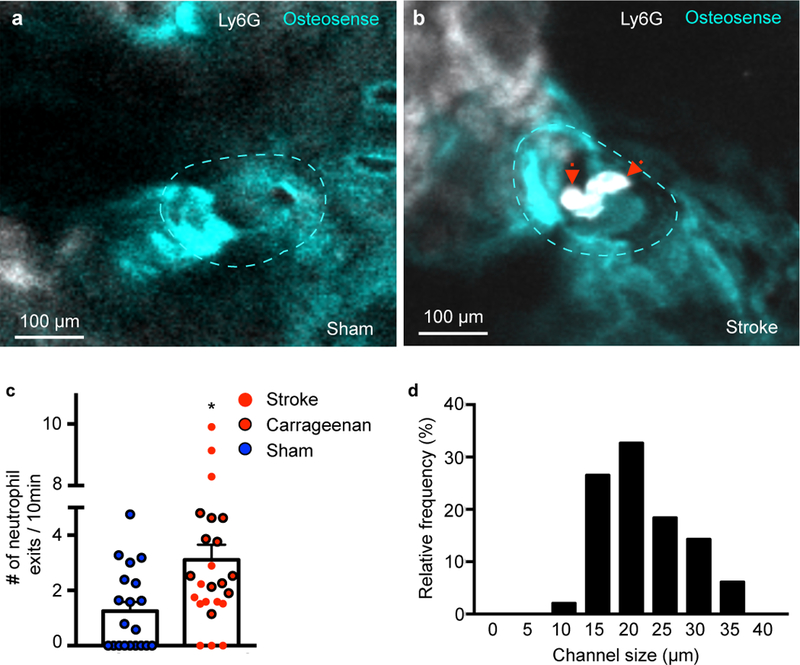
a,b, Representative examples of channels (dotted line) in (a) sham control and (b) stroke (permanent MCAO). See also Supplementary movie 4,5. c, Number of neutrophil exits. Data are mean ± s.e.m. Two-tailed Mann-Whitney test, *P= 0.011, sham, n=20 channels, acute inflammation n=24 (including 13 stroke) channels per group, 4 independent experiments. Sham, n=4 mice, stroke, n=3 mice, carageenan, n=4 mice. d, Distribution of channel diameter by histology. Sham, n=4 mice, stroke, n=3 mice, carageenan, n=4 mice.
In adult mice, the channels were 21.6 ± 0.9 µm in diameter (Fig. 6d). Electron microscopy confirmed the channels’ endothelial lining and showed that the channel lumen connects with vasculature in the dura mater (Fig. 7a-d). After stroke, neutrophils extravasated in the dura (Supplementary Fig. 7). High resolution ex vivo X-ray computed tomography revealed the channels’ wide distribution throughout the inner and outer murine skull cortices (Fig. 8a-e, Supplementary movie 6). Measured by microCT, the channels were similar in size in the inner and outer skull cortex (Fig. 8f). Compared to the histology data, the average channel diameter was slightly lower on microCT, which we attribute to partial volume effects and the lower resolution of the X-ray based modality. In the tibia, we observed similar channels traversing the bone cortex (Fig. 8f).
Figure 7. Electron microscopy of channel.
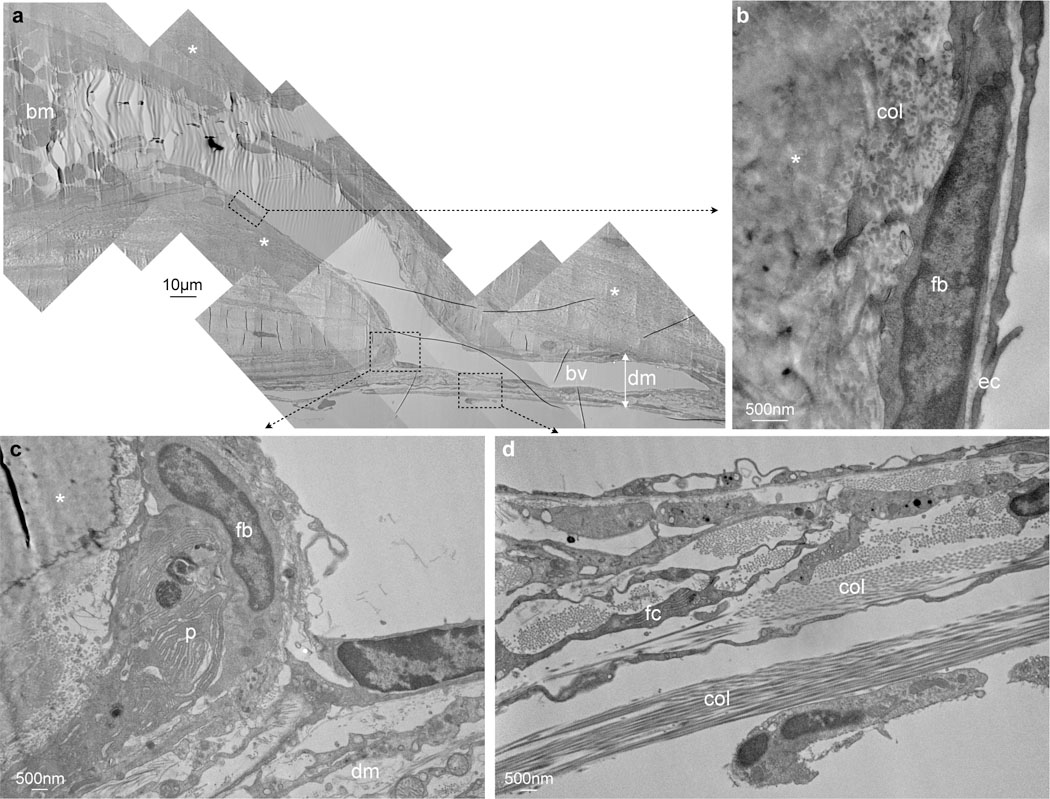
a, Entire channel connecting a skull bone marrow cavity (bm) filled with blood cells with a blood vessel (bv) in the dura mater (dm) while traversing the inner bone cortex (asterisks), single experiment. b, Channel is clad with endothelial cells (ec), above fibroblasts (fb). c, Connective tissue in the dura mater (dm) in the vicinity of the channel, fibroblast (fb), plasma cell (p). d, Dura mater with collagen (col) and fibrocyte (fc).
Figure 8. Channels in the mouse (a-f) and human skull (g-l) imaged by microCT.
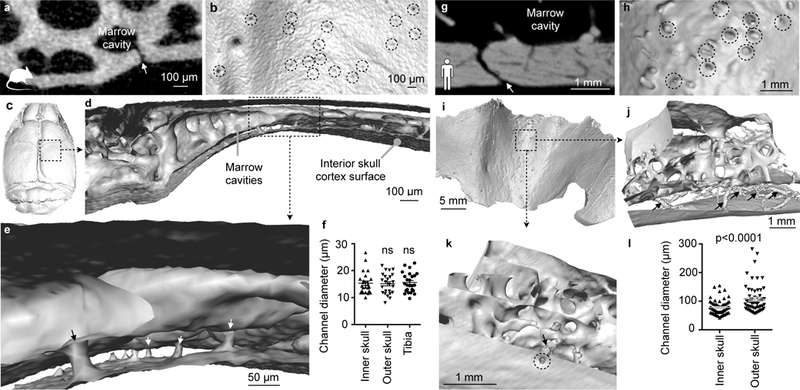
a,g, Coronal view of channel (arrow) in a mouse (a) and human (g). b,h, Interior skull surface reconstruction, channel openings indicated by dashed circles. c,i, Interior skull surface reconstruction. d,e,j,k, Coronal surface rendering of channels (arrows). f, Channel diameter according to location in mouse and (l) in human. Each point is one channel. Data were obtained in 1 mouse (inner and outer skull, n= 24; tibia, n=25), one-way Anova P= 0.96 and 3 humans (inner and outer skull, n=60), two-tailed t-test with Welch’s correction, p<0.0001 . Data are mean ± s.e.m. See Supplementary movie 6.
Finally, we explored whether such channels exist in humans. To this end, we imaged craniectomy specimen obtained during decompression surgery in three patients (clinical information is provided in the method section). In all three samples, we identified similar channels (albeit with 5.3-fold larger mean diameters) connecting the inner skull cortex surface with marrow cavities (Fig. 8g-k). In contrast to mice, channels through the human outer skull cortex were larger than channels traversing the inner skull cortex (Fig. 8l). In the interior human skull cortex, the channels occupied 2.5±0.2% of the bone volume.
Discussion
We here apply a method for tracking cell origins from different bone marrow locations to study inflammation in several organs. When inflammation occurred in the brain, the organ had a high propensity to recruit neutrophils from skull bone marrow. We detected this recruitment bias by flow cytometry after tagging cells in the marrow. No such preference was present when inflammation befell the heart, suggesting that anatomic proximity could be instrumental for leukocyte migration in general and specifically for inflammatory brain disorders. Confocal microscopy on the inside of the skull after stroke or intracisternal carrageenan injection revealed myeloid cell traffic through small vascular channels that connect the skull marrow with the meninges. These data challenge the current dogma that after any inflammatory stimulus, the marrow homogeneously releases leukocytes into the systemic circulation, followed by cell recruitment into the injured site from the blood pool.
The meninges carry a rich vascular network that originates from the cerebral arteries, external carotid arteries and the diploic veins. Diploic veins connect the pericranial and endocranial venous system through the skull14,15. On the brain surface, meningeal vessels can expand through the arachnoid layer, which provides access to the cerebrospinal fluid14. Diploic vessels pass through the human cranium mostly in the parietal bone16. Those vessels average 1.5 mm in diameter, but diploic veins also connect to a microscopic network of venous channels14,17. Specifically, human corrosion casts display numerous microvessels branching towards the marrow cavity14. Our microCT data indicate that there are direct connections between skull marrow cavities and the inner surface of the skull bone in mice and humans. Whether leukocytes frequent these channels in humans, in parallel to our in vivo microscopy observations in mice, is currently unclear.
In the setting of brain inflammation, vascular structures may be damaged or become leaky. Such pathologies, our data indicate, could trigger direct skull marrow supply of inflammatory cells to the surface of the brain. After stroke, we observed leukocytes crawling through channels against the blood flow towards the dura, as well as extravasated neutrophils in the dura, which supports that skull-derived neutrophils may migrate directly to the brain. Other cell types or pathogens may travel the same way. Interestingly, meninges emerge as a site of early inflammatory processes in chronic neurological diseases such as multiple sclerosis18. Innate immune cells, in particular neutrophils and monocytes, are also being studied in the setting of Alzheimer’s disease19–21. Skull neutrophil supply could thus contribute to chronic neuro-degenerative disorders like Alzheimer’s, as neutrophils were observed at the cerebro-meningeal level early in the course of the disease21. Trauma to the skull may also impact the dynamics and supply of inflammatory cells to the meninges and the brain, possibly affecting inflammatory activity in the CNS.
Because the channels are not a one-way street, signaling molecules originating from the inflamed brain may preferentially reach the skull marrow. This could trigger local alteration of the hematopoietic stem cell niche, as indicated by our data on SDF-1, and perhaps also condition leukocytes and their progenitors. As a consequence, skull neutrophils may be more inflammatory, more numerous and prone to interact with brain macrophages, in particular at the perivascular level22–24. Altogether, such local interactions may explain the preferential skull neutrophil recruitment we observed in the inflamed brain, and initiate neuro-inflammatory cascades.
Leukocyte access to ischemic brain may rely on alternate migratory paths independent of the systemic circulation, a speculation that agrees with our observation of bias towards skull marrow recruitment in CNS inflammation. We observed leukocytes in perivascular spaces of the dura after stroke induction, similar to prior reports in rodents and humans which stressed the importance of the leptomeningeal vessels for leukocyte migration into inflamed brain tissue25,26. Even though limited by the small number of cells available for histological analysis in our study, skull neutrophils were more numerous at the brain surface than cells originating from the tibia, which suggests that leptomeningeal vessels may enrich for leukocytes originating from the skull marrow.
The dura is composed of thick collagen layers and contains arterial, venous and lymphatic components27. Dural lymphatic vessels may carry immune cells from the CNS to the periphery28,29. However, lymphatic drainage is absent from bone marrow, and the channel microanatomy is not suggestive of lymphatic endothelium. Whether leukocytes extravasated in the dura enter the lymphatic system or the brain parenchyma requires further investigation. In steady state, an impervious barrier separates the dura from the leptomeninges27. This may change in inflammatory conditions. Direct leukocyte migration through these layers could represent an alternative migratory path, particularly in the context of severe stroke or meningitis that triggers inflammation on the brain’s surface. Proteases released from activated mast cells and macrophages in the dura may loosen extracellular matrix, thus facilitating cell migration30–32.
Our work focussed on early inflammatory events and neutrophil migration, cells considered to be first responders to infection and injury. In the setting of sterile inflammation, neutrophils are destructive, as their defensive weaponry inflicts damage on the organ stroma33. In ischemic stroke, and particularly after reperfusion, neutrophils contribute to blood-brain barrier disruption, edema, oxidative stress, protease activity, neuronal death, infarct expansion and poor neurological outcomes2,34. Neutrophils are among the cells with the shortest life span; therefore, the study of their production and migration provides insight into mechanisms that bring about the population increase seen in inflamed tissue.
This work poses several questions. The channels’ function in humans is currently unknown, but it would be valuable to estimate the contribution of this migratory path in steady state and during chronic and acute brain inflammation. It would be of interest to explore if and how the blood flow and cell migration through these channels is regulated, and how it changes with increased intracranial pressure. An additional putative channel function is information transfer, as soluble inflammatory factors, including danger associated molecular patterns arising from ischemic brain, may alert the skull marrow6. Finally, it will be of interest to study if inhibition of cell migration through the described channels has anti-inflammatory effects.
Online Methods
Animals and experimental parameters
We used 4 week and 3 month old male C57BL/6 from Jackson laboratories, and bred heterozygous Cx3cr1GFP (3–6 month old males were used in experiments). All the procedures were performed in accordance with the ARRIVE guidelines, the Guide for Care and Use of Laboratory Animals (NIH Publication No. 85–23, 1996), and have been approved by the institutional review board (MGH Subcommittee on Research Animal Care). Mice were randomly distributed to experimental groups. There was no literature available on our topic to perform sample size calculation. As the same experimenter performed the surgeries, harvest and sample preparation for flow cytometry, blinding was not implemented.
Human samples
The Institutional Review Board of Dongguk University at the Ilsan Hospital approved this study. All patients or their legally authorized representatives gave a written informed consent. We imaged skull specimen obtained from two males (52 and 33 year old) and one female (53 years old). The 52 year old male had decompression surgery 2 days after bilateral ischemic stroke, and his comorbidities were hyperlipidemia, hypertension and diabetes mellitus. The other male had decompression surgery after trauma. The female patient underwent retromastoid craniotomy for microvascular decompression surgery.
Bone marrow tagging by microinjection technique
Deep red CellTracker™ (C34565 Molecular Probes) and CMFDA (green) CellTracker™ (C7025 Molecular Probes) dyes were prepared fresh before each experiment by dissolving in 3 µl of DMSO (D8418 Sigma) and then adding 297µl of sterile saline. Microinjection of the tibia and skull marrow were performed sequentially under 1.5 % isoflurane anesthesia, using a 5 µl syringe (#65 Hamilton Co, Reno, NV USA) mounted with a custom 34G blunt needle (RN 0.375’’ PT3). For each procedure aseptic technique was used. The skin above the skull was opened at the midline to expose both anterior (near bregma) and posterior (besides the cerebellum) marrow sites. One or two microinjections were performed for each marrow site (right frontal, left frontal and occipital). First, a “pre-drilling” was done using a 30G needle (ref # 305106 BD) with great care to prevent the perforation of the inner wall of the skull. Animals with unsuccessful procedure at that stage were removed from the study. A total volume of about 2–3 µl of the red tracker was slowly injected per injection site through the pre-drilled spots (20–30s per injection), for a total of 10 µl of red tracker injected per skull (4 injection sites). The injection was monitored through the microscope. Thereafter, the skin was sutured with 6–0 silk. The skull was kept moist throughout the procedure using sterile saline. For the tibia marrow injection, the disinfected skin was opened just below the knee and the muscle insertion locally scrapped off the bone at the chosen injection site. The bone wall was perforated with a 30G needle (ref # 305106 BD). The needle of the Hamilton syringe was introduced in the marrow cavity to inject 3 µl of the green cell tracker over 30 seconds. The skin was sutured with 6–0 thread. Animals were sacrificed 6–48 hours after injection, followed by cardiac perfusion with 20ml of PBS.
Stroke induction
Stroke was induced using a filament MCAO (Middle Cerebral Artery Occlusion) model under anesthesia (1.5% isoflurane) and temperature control system (Harvard apparatus, Holliston, MA USA). Mice were given preemptive analgesia (buprenorphine 0.1mg/kg SC) and follow up doses until sacrifice. Briefly, the right carotid bifurcation was accessed through cervicotomy and careful dissection. After permanent ligation of the external carotid artery (ECA), a silicon coated 7–0 filament (Doccol corporation, Sharon, MA USA) was introduced from the ECA to the internal carotid artery until block. The filament was left in place either permanently or for 30 min and then pulled out to achieve reperfusion. Success of the procedure was monitored by the presence of a brain cortical pallor/edema at sacrifice, or the presence of neurological signs on basic mouse examination (circling behavior, impaired forelimb flexion associated with clasping reflex). Corresponding sham surgery comprised skin opening and dissection of the carotid bifurcation and ligation of the right external carotid artery.
Carrageenan injection
For intracisternal (IC) injections, pre-emptive buprenorphine (Buprenex) was given subcutaneously (0.1mg/kg). Lambda carrageenan was bought from Sigma (#22049). To induce aseptic meningoencephalitis, we adapted a published protocol10 and injected 5 µl of 0.5% carrageenan (w/V) diluted in sterile saline in the cisterna magna, during 1.5% isoflurane anesthesia. The mouse was installed on a stereotactic frame (Stoelting, Wood dale IL USA). After shaving, disinfection, opening of the skin and dissection of the cervical muscles, the cisterna magna membrane was visualized under microscopy and punctured using a Hamilton syringe (Gastight #1701) mounted with a 34G needle. Carrageenan was injected slowly over 1 minute. Excess carrageenan was removed with a cotton tip. The skin was then sutured and the mouse allowed to recover. Corresponding sham surgery consisted of skin opening and dissection of the cervical muscles only.
Myocardial infarction
Under isoflurane anesthesia, the mouse was intubated and ventilated (Inspira, Harvard Apparatus). A thoracotomy was then performed between the 3rd and 4th ribs to visualize the heart. After removing the connective tissue, a 8–0 suture was placed to ligate the left coronary artery. The rib cage was then closed with two separate 5–0 sutures, a 20G sheath left between the sutures, and the dermis glued shut with surgical glue. Finally, air was removed from the thoracic cavity via the sheath and a 3ml syringe before the animal was extubated.
Confocal microscopy
Microscopy of the skull, the tibia or brain was performed with a confocal microscope (IV100 Olympus). Field of view at 4x magnification covers 2290µm by 2290µm, and 20x covers 458µm by 458µm with a resolution of 512 by 512 pixels. For video acquisition, time-lapse was either 1.64 or 4.89s per image. Images were reconstructed using the Imaris software (Bitplane, Zurich, Switzerland) or Matlab software. For in vivo imaging, we used a customized Olympus FV1000 BX61-W1 (Olympus America) confocal/multiphoton microscope. A 20x water-immersion objective with a high numerical aperture (NA) and large working distance (Olympus, XLUMPLFLN 1 NA, 2mm wd) were utilized for imaging. Images 256×256 in size and with 4 microseconds/pixel integration time were acquired in confocal modality.
Histology
After euthanasia with cardiac perfusion of 20 ML PBS, brains were frozen at minus 35C in 2 methyl butane and further sectioned at 50 microns on a cryostat (CM 3050S, Leica, Wetzlar, Germany). After post fixation in 4% paraformaldehyde, the sections were imaged on a microscope (Eclipse TE2000-U Nikon)
Electron microscopy
Tissues were fixed by cardiac perfusion with formaldehyde/glutaraldehyde (2.5% each) followed by a post fixation over night in the same fixative. Calvaria were decalcified 4.13% EDTA and 0.44% NaOH in distilled water (pH 7.3) at 4 degrees with solution changed every 2 days, for at least 2 weeks. The samples were then washed in 0.1M cacodylate buffer and postfixed with 1% Osmiumtetroxide (OsO4)/1.5% Potassium-ferrocyanide(KFeCN6) for 1 hour, washed in water 3 times and incubated in 1% aqueous uranyl acetate for 1hr followed by 2 washes in water followed by dehydration in ethanol. The samples were then put in propyleneoxide for 1 hr and incubated over night in a 1:1 mixture of propyleneoxide and TAAB Epon (Marivac Canada Inc. St. Laurent, Canada). The following day the samples were embedded in TAAB Epon and polymerized at 60 degrees C for 48 hrs. Ultrathin 80nm thick sections were obtained on a Reichert Ultracut-S microtome, placed on to copper grids and stained with lead citrate and examined in a JEOL 1200EX Transmission electron microscope. Images were recorded with an AMT 2k CCD camera.
Ex-vivo microscopy of the skull and the tibia
To identify bone, animals were injected with OsteoSense® 750EX (4nmol/mouse, PerkinElmer) the day before imaging. The vasculature was labeled in vivo with 50 µl of RPE anti mouse CD31 antibody (#553373 BD Biosciences) or isolectin B4 (FL-1201 Vector labs), injected IV 1 hour before sacrifice. Mice were euthanized 2 hours after either skull or tibia microinjection and perfused with 20 ml of PBS, or 7 hours after systemic injection of evans blue 3% (w/vol in sterile saline). The skull and the tibiae were dissected and cleaned before fixation for 1 hour in 4% paraformaldehyde in PBS, then rinsed twice in PBS for 10 minutes. Tibiae were then embedded in Tissue-Tek® O.C.T( #4583 Sakura Finetek Inc Torrance CA USA) on dry ice, and kept at −20 Celsius. They were later shaved on a cryostat (CM 3050S, Leica, Wetzlar, Germany) to expose the bone marrow compartment. Z-stacks images were acquired with 2 µm steps at 20x magnification. Images were processed using the Imaris software ™ (Bitplane, Zurich, Switzerland). Maps of the entire bones for the injection sites were generated by the stitching of multiple images acquired at 4X magnification, using the Affinity Designer® software (Serif, Nottingham, UK). Size of the channels was determined manually using the measuring distance tool on Imaris software™ (Bitplane, Zurich, Switzerland).
Skull marrow organ bath
To explore cell traffic through the skull channels to the meninges, we employed an organ bath system. After in vivo staining of the bone surface with OsteoSense® 750EX (4 nmol/mouse, PerkinElmer) the day before the experiment, the vasculature and neutrophils were stained with IV injections of 50 µl of RPE anti mouse CD31 (#553373 BD Biosciences) and 50 µl of APC anti mouse Ly6G (#127614 Biolegends) antibodies 1 hour before harvest. Using surgical scissors, we obtained a skull piece of about 4 by 4 mm, respecting the integrity of the dura and the visible edges of the marrow cavities. This specimen was flipped upside down and rapidly transferred into the organ bath. The specimen was placed on a stage and immersed with a solution of 50 µmolar fMLP (F3506 Sigma-Aldrich), used as chemoattractant, in HBSS. This protocol was adopted from previously published in vitro neutrophil migration assays35. The organ bath was maintained at 37°C through a warming plate (ATC-2000 World Precision Instruments). The same conditions were implemented to explore neutrophil migration through the channels at 4–6 hours after permanent MCAO or after intracisternal injection of carrageenan, and corresponding sham or naive controls. Neutrophils exiting the channels were identified and counted using Imaris software™ (Bitplane).
Flow cytometry
To study the skull bone marrow, the entire calvarium and the sphenoid bone were harvested. The dura was removed using a microscope. Cell suspension was prepared by mincing the calvarium and sphenoid for 2.5 minutes in buffer (2.5% albumin in PBS). The obtained suspension was then filtered through a 40 µm cell stainer into a 50 ml Falcon tube. The marrow from long bones was collected by flushing. Spine bone marrow was obtained by crushing. Marrow from sternum and pelvis bones were also obtained by crushing. Enumeration of bone marrow cellularity for all bones in naive mice relied on bones prepared by crushing only. After centrifugation at 340G for 7 minutes at 4°C, samples were resuspended in 300 µl of buffer and kept at 4°C until staining.
Either one (stroke hemisphere) or both hemispheres (carrageenan) were collected and weighted for analysis36. Samples were digested for 20 minutes at 37°C in 5 ml of HBSS containing 10% Fetal Bovine Serum (#16140071 Gibco™) and 1% (w/V) Collagenase (#C5138, Sigma). After homogenization, samples were passed though a 40µm mesh cell strainer to a 50ml Falcon tube. The suspension was completed to 30ml with PBS and centrifuged at 450G for 5 minutes. The remaining pellet was suspended in 10.5 ml of PBS and gently homogenized with 4.5 ml of isotonic Percoll™(GE healthcare). The myeloid layer was collected by aspiration after 35 minutes of centrifugation (900 G) with no brake at 4°C. The Percoll™ was then washed off and cells were finally resuspended in 300 µl of PBS after a last centrifugation (450G, 5 minutes). Hearts were digested using a mixture of Collagenase I (450 U/ml, #C0130 Sigma), Collagenase XI (125U/ml, #C7657 Sigma), Hyaluronidase (60 U/ml, #H3605 Sigma), DNAse I (60 U/ml, #D5319, Sigma) and Hepes buffer (20 µM) in PBS at 37C for 1 hr under gentle shaking at 750 rpm. After homogenization, the preparation was filtered, washed off in buffer, spun and resuspended in PBS. Blood was collected by retro-orbital bleeding under anesthesia during sacrifice. Spleens were immediately mashed through a 40 µm mesh on top of a 50 ml Falcon and suspended in 15–20 ml of buffer. After a first centrifugation (340G, 7 minutes, 4°C), hypotonic red blood cell (RBC) lysis was performed for both the blood and the spleen (#420301 Biolegends). Samples were centrifuged again (340G, 7 minutes, 4°C) before resuspension in 300 µl (blood) or 1 ml (spleen). The total number of cells per sample was determined using a hemocytometer and Trypan Blue staining method for cell viability (Cellgro, Mediatech Inc, VA, USA). For cellularity in all bone marrow compartments in naive mice, automated cell counting was used (Countess®, Thermo Fisher). Leucocyte staining was performed at 4°C for 20 minutes, using a combination of antibodies at a concentration 1/300. Viability was assessed using a live/dead dye (L-34966, Life Technologies). After staining samples were fixed (BD Cytofix ™ 10 minutes on ice). The list of antibodies used for the experiments is provided in Supplementary table 1.
Samples were recorded on a LSRII Flow Cytometer (BD) and data were analyzed with FlowJo software (Tree Star). Cell numbers per sample were calculated as total cells per sample multiplied by percentage of live cells obtained from the appropriate flow cytometry gate. After gating out the lineage+ cells (Ter119, c-kit, CD11c, CD3, CD90, NK 1.1, CD31 and B220), mature myeloid cells were identified as CD45+ and CD11B+. Sub-populations of myeloid cells were defined as follows: neutrophils (Ly6G+ and CD115-), Ly6Chi monocytes (CD115+ Ly6C+) and finally microglia (Ly6G- and Ly6C-).
For the experiments involving bone marrow tagging, Deep red CellTracker™ and CMFDA (green) CellTracker™ were analyzed in the APC and FITC channels according to the excitation/emission peaks provided by the manufacturer (492/517 nm and 630/660 nm, respectively). The neutrophil population was analyzed for the presence of cells positive for the trackers at high fluorescence intensity. To take in account both potential auto-fluorescence and unspecific staining by the dyes at lower fluorescence intensity from circulation, the gate position for each cell tracker was based on animals that were injected IV with the same dose.
In vitro fluorescence assay for red and green trackers
Deep red CellTracker™ (C34565 Molecular Probes) and CMFDA (green) CellTracker™ (C7025 Molecular Probes) dyes were prepared fresh by dissolution in 3 µl of DMSO (D8418 Sigma) in 297 µl of FACS buffer (PBS with 0.5% Bovine Serum Albumin) or serum (fetal bovine serum #16140071 Gibco™). A cell suspension was obtained from flushed tibiae as described above. 700,000 cells were incubated with either the green or the red cell tracker at different concentration levels for 15 minutes at room temperature. Cells were then washed and resuspended in FACS buffer for flow cytometry.
Measurement of SDF-1 in bone marrow serum by ELISA
Murine SDF-1 was quantified by an ELISA kit (DY460 Duoset ®). Tibial (sectioned in half) and skull (minced in PBS) marrow serum was obtained after centrifugation in a custom made 2 compartment system (11750G, 3 minutes). The supernatant was used as indicated by the manufacturer’s instruction.
In vivo bone marrow permeability to Evans blue dye
The protocol was adapted from Itkin et al.9. Evans blue 3% (w/vol in sterile saline) was injected via the jugular vein at the time of reperfusion in stroke mice (30 minutes occlusion time) or immediately after intracisternal injection of carrageenan at a dose of 0.07 mg/g of body weight. The entire calvarium, the sphenoid bone and both tibia were harvested. The periosteum and dura attached to the skull samples were removed under microscopy. The pieces were then minced in 200µl formamide for 2 minutes. The tibiae were individually spun dry in a custom made 2 compartment system at 11750G for 3 minutes to recover all marrow, which was homogenized in 200 µl formamide by vortexing. Evans blue extraction was realized overnight at 60C and 700 rpm shaking. After centrifugation at 2000G for 30 minutes, 50 µl of the supernatant was plated and read for absorbance by dual-wavelength spectrophotometric analysis 620 nm and 740 nm (Tecan, Switzerland). Standards were prepared with Evans blue diluted in formamide (0 to 250 µg/ml). Absorbance was corrected for potential hematic contamination as previously published9 using the formula: corrected absorbance at 620 nm = actual absorbance at 620 nm – (1.426*(absorbance at 740) + 0.03). Values were then subtracted for blank and Evans blue amount calculated from the standards.
Mouse neutrophil transmigration assay
Mouse brain endothelial cells (MBEC) were obtained from Cell Biologics (C57–6023) and cultured on polyethylene collagen coated membranes (8 um pore size, Falcon 353182) in supplemented EBM-2 media (Lonza) until confluence. Neutrophils were isolated from skull and tibia bone marrow on MACS columns after staining with the manufacturer antibody mix (negative selection, Miltenyi 130097658) from 6 wild type 3 month old C57BL/6 mice. Cells originating from skull and tibia from the same mouse were loaded with cell tracker red (skull) and green (tibia), respectively, for 3 animals, and green (skull) and red (tibia) tracker for the 3 others, in accordance with manufacturer’s instructions (Deep red CellTracker ™ C34565 Molecular Probes and CMFDA (green) CellTracker ™ C7025 Molecular Probes). Cells were counted in order to obtain a cell suspension of 50% skull and 50% tibial origin.
Prior to the transmigration assay, MBECs were activated with TNF alpha (10ng/ml) for 8 hours and then washed. Neutrophil attractant fMLP was used at a concentration of 50 µmolar to facilitate the migration towards the bottom part of the well. Finally, cells (200,000 from each compartment) were deposited on the upper part of the transwell. After 2 hours, the number of cells that had migrated through the membrane was counted manually, and the composition of the population assessed by flow cytometry. The percentage of migrated cell was calculated as follow: migrated number of cells / initial number of cell above the membrane.
High resolution X-ray computed tomography
Calvaria and sphenoid bone were dissected after euthanasia in a naive 3 month old C57BL/6 mouse. Ex-vivo human occipital bone, mouse frontal bone and mouse tibial samples were scanned on a high resolution CT scanner (µCT40, Scanco Medical AG, Brüttisellen, Switzerland). Data were acquired using a 6 µm3 isotropic voxel size, 70 kVp peak x-ray tube intensity, 114 µA x-ray tube current, 200 ms integration time, and were subjected to Gaussian filtration. Images were generated with Horos (https://www.horosproject.org) and Osirix (Pixmeo, Bernex, Switzerland) software. Image renderings were performed in the Amira software (FEI, Hillsboro, OR) environment.
The human skull samples were imaged, as previously reported37, by using microCT (mCT, NFR Polaris-G90; NanoFocusRay, Jeonju, Korea): 65 kVp, 60 μA, 500 milliseconds per frame, 360 views, 512X512 reconstruction matrix, 600 slices. The data were converted to the Digital Imaging and Communications in Medicine format (Lucion; MeviSYS, Seoul, Korea).
The human and mouse skull bone CT were segmented by thresholding using Amira software. Channel size was determined by segmenting voxels that were three standard deviations below the mean table Hounsfield units. Channel diameters were manually determined by measuring the maximum diameter of individual channels below a Hounsfield threshold which was three standard deviations below that of the cortical bone’s mean. Mouse tibia were analyzed in similar fashion by removing the trabecular bone to isolate the cortical bone of an 0.15 cm axial section along the tibial crest. 3D Image visualization was performed in the Amira software environment.
Statistics
We used the GraphPad Prism 7 software (GraphPad Inc) for statistical analyses. Results are reported as mean ± standard error of mean. For group comparison, two tailed non parametric Mann-Whitney, Welch’s t test or paired Wilcoxon tests were executed. For comparing more than two groups, a nonparametric Kruskall-Wallis test was applied. P values of < 0.05 indicated statistical significance. No statistical methods were used to pre-determine sample sizes but our sample sizes are similar to those reported in previous publications7,13. Data distribution was assumed to be normal but this was not formally tested. There was no formal randomization. Data collection and analysis were not performed blind to the conditions of the experiments.
Supplementary Material
Acknowledgements
The authors thank the MGH mouse imaging program and the Center for Skeletal Research Core (NIH P30 AR066261) for assistance with imaging. The authors thank Maria Ericsson (HMS Electron Microscopy Facility) for skull sample preparation, sectioning and assistance with EM imaging. We acknowledge Diane Capen (Center for Systems Biology and Program in Membrane Biology/Division of Nephrology, MGH) for help with interpretation of electron microscopy data.
This work was funded in part by a grant from the National Institutes of Health (NS084863 and HL139598), the American Heart Association (16SDG30190009), the Cure Alzheimer’s Fund, the Global Research Lab (GRL) program (NRF-2015K1A1A2028228) of the National Research Foundation by the Korean government and fellowships from the Netherlands Organisation for Scientific Research (NWO, Rubicon Grant: 835.15.014), the Deutsche Forschungsgemeinschaft (RO5071/1–1) and the MGH Research Scholar program.
Footnotes
Competing financial interests
The authors declare that they have no competing financial interests.
Data availability
The data that support the findings of this study are available from the corresponding authors upon reasonable request.
References
- 1.Swirski FK & Nahrendorf M Leukocyte behavior in atherosclerosis, myocardial infarction, and heart failure. Science 339, 161–166 (2013). [DOI] [PMC free article] [PubMed] [Google Scholar]
- 2.Jickling GC et al. Targeting neutrophils in ischemic stroke: translational insights from experimental studies. J Cereb Blood Flow Metab 35, 888–901 (2015). [DOI] [PMC free article] [PubMed] [Google Scholar]
- 3.Kamel H & Iadecola C Brain-immune interactions and ischemic stroke: clinical implications. Arch Neurol 69, 576–581 (2012). [DOI] [PMC free article] [PubMed] [Google Scholar]
- 4.Offner H et al. Experimental stroke induces massive, rapid activation of the peripheral immune system. J Cereb Blood Flow Metab 26, 654–665 (2006). [DOI] [PubMed] [Google Scholar]
- 5.Courties G, Moskowitz MA & Nahrendorf M The innate immune system after ischemic injury: lessons to be learned from the heart and brain. JAMA Neurol 71, 233–236 (2014). [DOI] [PMC free article] [PubMed] [Google Scholar]
- 6.Gelderblom M, Sobey CG, Kleinschnitz C & Magnus T Danger signals in stroke. Ageing Res Rev 24, 77–82 (2015). [DOI] [PubMed] [Google Scholar]
- 7.Courties G et al. Ischemic stroke activates hematopoietic bone marrow stem cells. Circ Res 116, 407–417 (2015). [DOI] [PMC free article] [PubMed] [Google Scholar]
- 8.Morrison SJ & Scadden DT The bone marrow niche for haematopoietic stem cells. Nature 505, 327–334 (2014). [DOI] [PMC free article] [PubMed] [Google Scholar]
- 9.Itkin T et al. Distinct bone marrow blood vessels differentially regulate haematopoiesis. Nature 532, 323–328 (2016). [DOI] [PMC free article] [PubMed] [Google Scholar]
- 10.Gamache DA, Povlishock JT & Ellis EF Carrageenan-induced brain inflammation. Characterization of the model. J Neurosurg 65, 679–685 (1986). [DOI] [PubMed] [Google Scholar]
- 11.Ueda Y, Kondo M & Kelsoe G Inflammation and the reciprocal production of granulocytes and lymphocytes in bone marrow. J Exp Med 201, 1771–1780 (2005). [DOI] [PMC free article] [PubMed] [Google Scholar]
- 12.Hill WD et al. SDF-1 (CXCL12) is upregulated in the ischemic penumbra following stroke: association with bone marrow cell homing to injury. J Neuropathol Exp Neurol 63, 84–96 (2004). [DOI] [PubMed] [Google Scholar]
- 13.Heidt T et al. Chronic variable stress activates hematopoietic stem cells. Nat Med 20, 754–758 (2014). [DOI] [PMC free article] [PubMed] [Google Scholar]
- 14.Zenker W & Kubik S Brain cooling in humans--anatomical considerations. Anat Embryol (Berl) 193, 1–13 (1996). [DOI] [PubMed] [Google Scholar]
- 15.Adeeb N, Mortazavi MM, Tubbs RS & Cohen-Gadol AA The cranial dura mater: a review of its history, embryology, and anatomy. Childs Nerv Syst 28, 827–837 (2012). [DOI] [PubMed] [Google Scholar]
- 16.Hershkovitz I et al. The elusive diploic veins: anthropological and anatomical perspective. Am J Phys Anthropol 108, 345–358 (1999). [DOI] [PubMed] [Google Scholar]
- 17.Rangel de Lazaro G, de la Cuetara JM, Pisova H, Lorenzo C & Bruner E Diploic vessels and computed tomography: Segmentation and comparison in modern humans and fossil hominids. Am J Phys Anthropol 159, 313–324 (2016). [DOI] [PubMed] [Google Scholar]
- 18.Lucchinetti CF et al. Inflammatory cortical demyelination in early multiple sclerosis. N Engl J Med 365, 2188–2197 (2011). [DOI] [PMC free article] [PubMed] [Google Scholar]
- 19.Michaud JP, Bellavance MA, Prefontaine P & Rivest S Real-time in vivo imaging reveals the ability of monocytes to clear vascular amyloid beta. Cell Rep 5, 646–653 (2013). [DOI] [PubMed] [Google Scholar]
- 20.Prokop S et al. Impact of peripheral myeloid cells on amyloid-beta pathology in Alzheimer’s disease-like mice. J Exp Med 212, 1811–1818 (2015). [DOI] [PMC free article] [PubMed] [Google Scholar]
- 21.Zenaro E et al. Neutrophils promote Alzheimer’s disease-like pathology and cognitive decline via LFA-1 integrin. Nat Med 21, 880–886 (2015). [DOI] [PubMed] [Google Scholar]
- 22.Park L et al. Brain Perivascular Macrophages Initiate the Neurovascular Dysfunction of Alzheimer Abeta Peptides. Circ Res 121, 258–269 (2017). [DOI] [PMC free article] [PubMed] [Google Scholar]
- 23.Faraco G, Park L, Anrather J & Iadecola C Brain perivascular macrophages: characterization and functional roles in health and disease. J Mol Med (Berl) 95, 1143–1152 (2017). [DOI] [PMC free article] [PubMed] [Google Scholar]
- 24.Abtin A et al. Perivascular macrophages mediate neutrophil recruitment during bacterial skin infection. Nat Immunol 15, 45–53 (2014). [DOI] [PMC free article] [PubMed] [Google Scholar]
- 25.Perez-de-Puig I et al. Neutrophil recruitment to the brain in mouse and human ischemic stroke. Acta Neuropathol 129, 239–257 (2015). [DOI] [PubMed] [Google Scholar]
- 26.Bartholomaus I et al. Effector T cell interactions with meningeal vascular structures in nascent autoimmune CNS lesions. Nature 462, 94–98 (2009). [DOI] [PubMed] [Google Scholar]
- 27.Coles JA, Myburgh E, Brewer JM & McMenamin PG Where are we? The anatomy of the murine cortical meninges revisited for intravital imaging, immunology, and clearance of waste from the brain. Prog Neurobiol 156, 107–148 (2017). [DOI] [PubMed] [Google Scholar]
- 28.Louveau A et al. Structural and functional features of central nervous system lymphatic vessels. Nature 523, 337–341 (2015). [DOI] [PMC free article] [PubMed] [Google Scholar]
- 29.Aspelund A et al. A dural lymphatic vascular system that drains brain interstitial fluid and macromolecules. J Exp Med 212, 991–999 (2015). [DOI] [PMC free article] [PubMed] [Google Scholar]
- 30.McKittrick CM, Lawrence CE & Carswell HV Mast cells promote blood brain barrier breakdown and neutrophil infiltration in a mouse model of focal cerebral ischemia. J Cereb Blood Flow Metab 35, 638–647 (2015). [DOI] [PMC free article] [PubMed] [Google Scholar]
- 31.Arac A et al. Evidence that meningeal mast cells can worsen stroke pathology in mice. Am J Pathol 184, 2493–2504 (2014). [DOI] [PMC free article] [PubMed] [Google Scholar]
- 32.Sellner J & Leib SL In bacterial meningitis cortical brain damage is associated with changes in parenchymal MMP-9/TIMP-1 ratio and increased collagen type IV degradation. Neurobiol Dis 21, 647–656 (2006). [DOI] [PubMed] [Google Scholar]
- 33.Kruger P et al. Neutrophils: Between host defence, immune modulation, and tissue injury. PLoS Pathog 11, e1004651 (2015). [DOI] [PMC free article] [PubMed] [Google Scholar]
- 34.Shi Y, Leak RK, Keep RF & Chen J Translational Stroke Research on Blood-Brain Barrier Damage: Challenges, Perspectives, and Goals. Transl Stroke Res 7, 89–92 (2016). [DOI] [PMC free article] [PubMed] [Google Scholar]
- 35.Keenan TM & Folch A Biomolecular gradients in cell culture systems. Lab Chip 8, 34–57 (2008). [DOI] [PMC free article] [PubMed] [Google Scholar]
- 36.Lelios I & Greter M Isolation of leukocytes from mouse central nervous system. Methods Mol Biol 1193, 15–19 (2014). [DOI] [PubMed] [Google Scholar]
- 37.Kim JY et al. Direct Imaging of Cerebral Thromboemboli Using Computed Tomography and Fibrin-targeted Gold Nanoparticles. Theranostics 5, 1098–1114 (2015). [DOI] [PMC free article] [PubMed] [Google Scholar]
Associated Data
This section collects any data citations, data availability statements, or supplementary materials included in this article.