Abstract
Background
Sequence optimization in neonates might improve detection sensitivity of abnormalities for a variety of conditions. However this has been historically challenging because tissue properties such as the longitudinal relaxation time and proton density differ significantly between neonates and adults.
Objective
To optimize the magnetization-prepared rapid gradient echo (MP-RAGE) sequence to enhance both signal-to-noise ratio (SNR) and contrast-to-noise ratio (CNR) efficiencies.
Materials and methods
We optimized neonatal MP-RAGE sequence through (1) reducing receive bandwidth to decrease noise, (2) shortening acquisition train length (acquisition number per repetition time or total number of read-out radiofrequency rephrasing pulses) using slice partial Fourier acquisition and (3) simulating the solution of Bloch’s equation under optimal receive bandwidth and acquisition train length. Using the optimized sequence parameters, we scanned 12 healthy full-term infants within 2 weeks of birth and four preterm infants at 40 weeks’ corrected age.
Results
Compared with a previously published neonatal protocol, we were able to reduce the total scan time by 60% and increase the average SNR efficiency by 160% (P<0.001) and the average CNR efficiency by 26% (P=0.029).
Conclusion
Our in vivo neonatal brain imaging experiments confirmed that both SNR and CNR efficiencies significantly increased with our proposed protocol. Our proposed optimization methodology could be readily extended to other populations (e.g., older children, adults), as well as different organ systems, field strengths and MR sequences.
Keywords: Acquisition train length, Brain, K-space, Magnetic resonance imaging, Magnetization-prepared rapid gradient echo sequence, Neonates, Optimization
Introduction
Two-dimensional rather than three-dimensional (3-D) T1-weighted brain MR imaging is used routinely in neonatal clinical studies because it can be acquired in a shorter time [1]. However the tradeoff of lower resolution along the slice direction compromises the image quality of reformatted images in the other two planes and increases partial volume effects. As a result, morphometry-based applications are limited in 2-D scans. The magnetization-prepared rapid gradient echo (MP-RAGE) sequence combines the power of magnetization-prepared imaging and rapid 3-D gradient echo acquisition techniques [2]. Quantitative measurements of regional tissue volumes afforded by 3-D acquisition have shown promise in investigating the impact of premature birth [3–6] and its related pathology [7–11]. In general, the gain in resolution is at the expense of the elongated scan time. Researchers have long been interested in optimizing sequence parameters to achieve a good trade-off among resolution, tissue contrast-to-noise, and scan time.
MP-RAGE has been optimized for structural brain imaging in adults [12–19]. However sequence optimization in neonates has been historically challenging. Neonatal brains exhibit reversed white matter–gray matter contrast on T1-weighted scans. Additionally, the relative contrast difference is considerably less in neonates than in adults — the maximum theoretical contrast for neonates is approximately 1/3 of that for adults at 3 T (T) [20–22] — which makes T1-weighted sequence optimization for neonates more challenging. Although investigators have optimized MP-RAGE sequence parameters for neonates, resulting in improved image contrast [21], the protocol has limited clinical applicability because of its prolonged scan time (~9 min).
In a previous paper [19] we optimized the MP-RAGE sequence through computer simulations of the solution of Bloch’s equation for adult brain scans. We developed an optimal k-space sampling strategy and validated the approach with in vivo studies of human adults. We did not consider the potential effects of acquisition or echo train on image quality and acquisition efficiency [23] because the impact of varying these parameters is relatively small for adult brains. In this paper, we studied a new method to optimize the MP-RAGE sequence for neonatal brains, which included: (1) reducing receive bandwidth to decrease noise, (2) shortening acquisition train length (acquisition number along the slice-selection direction per repetition time or total number of read-out radiofrequency pulses) using slice partial Fourier acquisition, (3) optimizing k-space strategy and (4) optimizing effective inversion recovery time. In addition, we performed in vivo neonatal brain imaging to validate our MP-RAGE sequence optimization.
Materials and methods
Subjects
This study is part of an investigation into brain development and neurodevelopmental outcomes for very preterm infants (≤32 weeks’ gestation) cared for in the neonatal intensive care unit at Nationwide Children’s Hospital. We recruited a comparison group of healthy full-term control infants from the well-baby nursery at The Ohio State University Medical Center and the newborn nursery at Riverside Methodist Hospital. We excluded preterm infants with known structural congenital central nervous system anomalies, congenital chromosomal anomalies, or congenital cyanotic cardiac defects. Additionally, we excluded full-term infants who were small or large for gestational age and those with a history of perinatal distress or complications. None of the term infants exhibited any signs of parenchymal brain injury or delayed brain development on anatomical MRI. Brain MRI was performed at term-equivalent age for preterm infants and 1–2 weeks after birth for term infants. The Nationwide Children’s Hospital institutional review board approved this study and we obtained written parental informed consent for every child prior to imaging.
Computer simulation
The MP-RAGE sequence is composed of 3-D inversion recovery α and N equally spaced readout radiofrequency pulses of flip angle θ and echo spacing τ. Repetition time (TR) is defined as the time interval between two successive inversion recovery pulses:
| (1) |
where τ is echo spacing time, N is the total number of readout radiofrequency pulses, TI is the time interval between the inversion recovery pulse and the first radiofrequency readout pulse, and TD is delay time. In order to simplify the formula for signal intensity, we defined: , and μ = δ · cos (θ). The acquisition train length was defined as the actual number of phase encoding along the slice-selection direction or the total number of read-out radiofrequency pulses, which is the product of the nominal number of slices and slice partial Fourier factor. T1 is spin-lattice relaxation time. Signal intensity Si from the ith read-out radiofrequency pulse can be described using the solution of Bloch’s equation [19]:
| (2) |
where
| (3) |
During the simulation, we assume the noise σ is white [24], i.e. it is constant for all tissues. M0 is equilibrium magnetization. Additionally, we also assume that α is 180° for all simulations. The signal-to-noise (SNR) efficiency SNRi, eff from the ith read-out radiofrequency pulse can be described as:
| (4) |
The tissue contrast-to-noise (CNR) efficiency CNRi, eff between tissue 1 and tissue 2 from the ith read-out radiofrequency pulse can be described as:
| (5) |
A computer is used to simulate the solution of Bloch’s equation and determine the optimal imaging parameters to achieve maximum CNR efficiency CNRi, eff for desired spatial resolution and within known hardware specifications.
We assume perfect spoiling of transverse magnetization after each inversion and before each excitation pulse while ignoring relaxation effects during radiofrequency excitation. The solution of Bloch’s equation (Eq. 1) can be simplified for the steady state to investigate the effects of major imaging parameters on tissue signal and contrast (Eq. 3). This is based on the known neonatal tissue properties [20, 21, 25] at 3.0 T (Table 1). A major source of noise in MR imaging is electronic noise, which is relatively evenly spread across all frequencies. A wider receiver bandwidth includes more such noise. Decreasing the bandwidth by a factor of 2 results in an increase in the signal-to-noise ratio (SNR) by a factor of √2. The narrowest bandwidth that a scanner can achieve is known, and then the corresponding echo spacing τ is set. This correspondence is available from the settings of each specific scanner. For the 3-T Siemens Skyra scanner, the narrowest receiver bandwidth of 140 Hz/pixel corresponds to a τ of 8.5 ms.
Table 1.
Tissue properties of full-term neonates at 3.0 T
| White matter | Gray matter | Cerebrospinal fluid | |
|---|---|---|---|
| T1 (ms) | 2,840 | 2,170 | 3,700 |
| T2 (ms) | 266 | 138 | 2,000 |
| Proton density | 0.94 | 0.90 | 1.00 |
In vivo brain imaging
We scanned all infants on a 3-T Skyra scanner (Siemens, Malvern, PA) that was equipped with a 32-channel head coil. The scans were conducted during natural sleep after infants were fed, swaddled and restrained using a Med-Vac vacuum fixation device (CFI Medical, Fenton, MI). MRI noise was minimized using Insta-Puffy Silicone Earplugs (E.A.R. Inc., Boulder, CO). Based on the simulation, we obtained structural images using the following optimized MP-RAGE parameters: TR/TE=2,130/2.9 ms, τ=8.5 ms, field of view (FOV) 174×192 mm, matrix 174×192, number of slices 120, slice thickness 1 mm, partial Fourier factor of 6/8, TIeff =1,610 ms, flip angle θ=12°, pixel bandwidth 140 Hz/pixel, and parallel image acquisition with an accelerator factor of 2. The in-plane phase-encoding is along the left–right direction of the brain. The total scan time was 3 min 32 s.
Previously recommended optimal imaging parameters [21] for neonatal brain imaging on a 3-T Innovative system are: TR/TE=7,000/5 ms, τ=14 ms, matrix 120×120, FOV 160×160, θ=10°, partial Fourier factor of 1, TIeff=2,250 ms. We attempted to reproduce this protocol on our 3-T Siemens Skyra scanner. To make the study more comparable and prevent loss of image quality, we adjusted the matrix and FOV size to 174×192 and reduced TE from 5 ms to 2.9 ms (the shorter TE improves signal intensity and reduces susceptibility artifacts), with a corresponding τ of 8.5 ms. The total scan time for this sequence was 9 min 8 s, similar to the original sequence [21]. In order to reduce the effect of motion on neonatal brain imaging, we ran both protocols (previous and present) but selected the order randomly.
Preterm
We scanned four preterm infants (demographic information is listed in Table 2) at 40 weeks’ corrected age (when magnetic tissue properties can be assumed to be same as term infants) to demonstrate the effects of varying the acquisition train length on in vivo brain images. In other words, to validate the effects of acquisition train length on image quality for partial Fourier factor other than 6/8 (acquisition train length 90), we acquired additional images with partial Fourier factor of 7/8 (acquisition train length 105) and 1 (acquisition train length 120).
Table 2.
Demographic information of the full-term and preterm participants
| Subjects | Gender | Birth weight (grams)a | GA at birtha | PMA at scana |
|---|---|---|---|---|
| Full-term (n=6) | 2 M, 4 F | 3,450±261 | 40.5±0.5 | 42.0±0.5 |
| Preterm (n=4) | 1 M, 3 F | 1,361±369 | 29.5±2.4 | 40.0±0.3 |
F female, GA gestational age (weeks), M male, PMA postmenstrual age (weeks)
All values are mean ± standard deviation
Full term
We scanned 12 healthy full-term infants (Table 2) within 2 weeks of birth. Of the 12 full-term infants (all completed with shorter scan time using our proposed protocol), only 6 remained cooperative to complete the scan with the longer modified protocol [21]. The remaining 6 scans could not be completed or were corrupted by significant head motion because of the prolonged scan time.
Qualitative performance evaluation
MR-RAGE images acquired using the previously published sequence and our proposed sequence were assessed by a pediatric neuroradiologist in a blinded fashion for SNR and tissue contrast utilizing a grading scale of 1 to 5, with 5 representing the highest SNR and tissue contrast. The two grades were averaged to provide an overall image-quality grade.
Quantitative performance evaluation
We estimated SNR=μsignal/δnoise, where μsignal is the global mean tissue intensity (excluding non-brain tissues) and δnoise is the standard deviation of image noise (assuming noise has a Gaussian distribution). Similarly, we estimated contrast-to-noise ratio CNR=(μGM − μWM)/δnoise where μGM and μWM are the mean tissue intensities of the gray matter and white matter, respectively. Next, we evaluated the optimization performance using SNR and CNR efficiencies, which are defined as SNR and CNR per square root of the total scan time (TA in seconds), respectively: and .
To calculate the global mean tissue intensities of the gray matter and white matter, we first obtained tissue probability maps by conducting brain tissue segmentation using SPM 8 (University College London, UK) with neonatal tissue probability priors [26]. We then generated a gray matter and white matter binary mask by converting membership probabilities to hard/binary assignments. Instead of using the conventional approach of assigning a single tissue type to each pixel according to the highest degree of membership, we eliminated all pixels with less than 70% membership probability. In other words, we only labeled pixels with a very high probability (≥70%) of gray matter or white matter membership. We excluded pixels that were affected by partial volume effects and field inhomogeneity from the SNR and CNR efficiency calculations. We extracted gray matter and white matter tissues by superimposing gray matter and white matter binary masks onto the original images. We estimated image noise level δnoise using weak textured patches via principal components analysis [27].
Results
Computer simulation
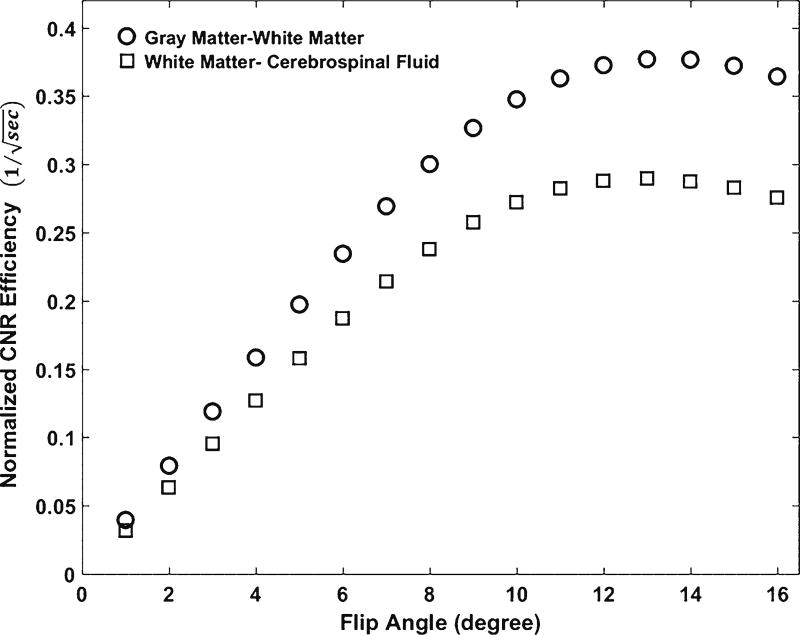
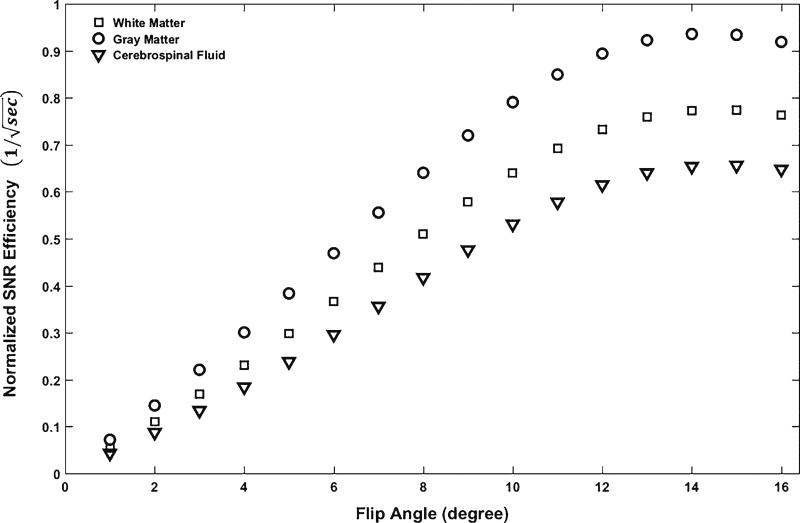
With steady-state approximation and a fixed τ of 8.5 ms, we simulated signal intensity and tissue contrast efficiencies as functions of flip angle θ according to Eq. 1. As shown in Fig. 1 [28], both white matter–gray matter and white matter–cerebrospinal fluid contrast efficiencies rapidly increase with increasing flip angles starting from 1°, reach their maxima at a flip angle around 12° and decline slightly above 12°. The tissue contrast curves are almost flat for flip angles between 10° and 14°. In other words, the flip angle has a minimum effect on tissue contrast when between 10° and 14°. In Fig. 2, the maximal signal intensities of white matter, gray matter and cerebrospinal fluid reach their maxima at a flip angle of 13°. The maximal signal intensity and tissue contrast are achieved at slightly different flip angles. We chose 12° as the optimal flip angle to maximize tissue contrast without sacrificing too much signal intensity.
Fig. 1.
Simulation of tissue contrast efficiencies as functions of flip angle. At a fixed echo spacing time of 8.5ms, both white matter–gray matter and white matter–cerebrospinal fluid contrast efficiencies reach their maxima at a flip angle of 12°. CNR contrast-to-noise ratio
Fig. 2.
Simulation of white matter, gray matter and cerebrospinal fluid signal intensity efficiencies as functions of flip angle. At a fixed echo spacing time of 8.5 ms, simulated signal-to-noise ratio efficiencies reach their maxima at a flip angle of 13°. SNR signal-to-noise ratio
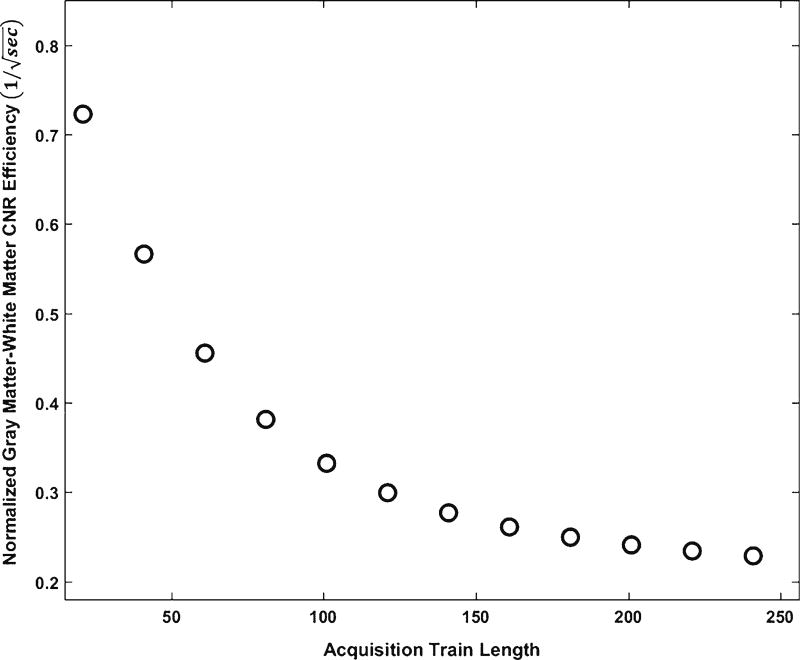
In 3-D fast (turbo) spin-echo (FSE) pulse sequences, longer echo train durations (the number of 180° radiofrequency refocusing pulses) can result in degraded image contrast and increased artifacts, such as blurring at high spatial frequencies [23, 29]; similarly, acquisition train length can also affect MP-RAGE image quality. Inspired by the optimization strategy of Mugler et al. [23, 30], we optimized acquisition train length for the MP-RAGE sequence with consideration of the tradeoff between it and spatial resolution using partial-Fourier acquisition [31, 32]. The effect of acquisition train length on normalized gray matter–white matter contrast efficiency is simulated at an arbitrary inversion recovery time. As shown in Fig. 3, gray matter–white matter contrast efficiency reduces with increasing acquisition train length. In other words, theoretically, maximal gray matter–white matter contrast efficiency is achieved at the minimal acquisition train length. However in practice it is restricted by scan time, field of view and slice thickness (i.e. resolution along slice direction) for MP-RAGE sequence acquisitions. With a desired spatial resolution of 1 mm, the total number of slices per slab needs to be at least 120 to cover a whole neonatal brain. In the settings of the 3-T Siemens Skyra scanner, once the slice-per-slab number of 120 is set, acquisition train length has three optional values of 120, 105 and 90, with corresponding slice partial Fourier factors of 1, 7/8 and 6/8, respectively. Because our simulation had shown that the shorter the acquisition train length, the higher the tissue contrast, we selected 90 to be the optimal value.
Fig. 3.
The effect of acquisition train length on normalized gray matter–white matter contrast efficiency. The gray matter–white matter contrast efficiency decreases with increasing acquisition train length at an arbitrary given inversion recovery time. CNR contrast-to-noise ratio
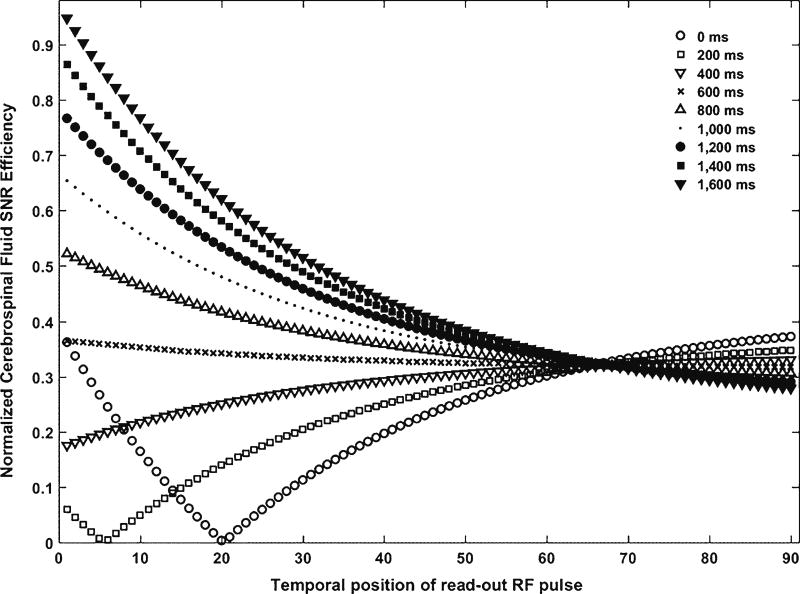
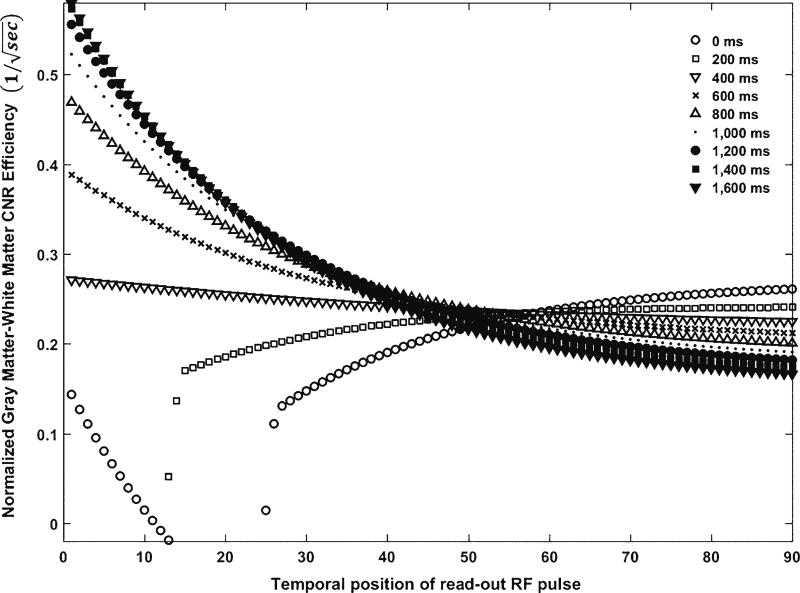
The data in k-space center represent low spatial frequencies and therefore object shapes and the contrast of an image. Low spatial frequency components have the highest amplitude, contributing most to image contrast. High spatial frequency components in the periphery of the k-space have lower amplitudes with little effect on image contrast or general object shapes but with greater effect on sharpness as they encode edge information. The higher the spatial frequency the k-space covers, the higher the spatial resolution of the image. Therefore the k-space zero line largely determines image contrast. As for the MP-RAGE sequence with a rectilinear k-space trajectory, each temporal position of the radiofrequency pulse (i.e. the read-out radiofrequency pulse number i) has a different tissue contrast. The k-space optimization is performed by determining the temporal position of the radiofrequency pulse (i.e. the read-out radiofrequency pulse number imax) that leads to the maximum tissue contrast according to Eq. 2. We simulated the normalized cerebrospinal fluid signal intensity efficiency and normalized gray matter–white matter contrast efficiency with temporal position of read-out radiofrequency pulse i over different effective inversion recovery times TIeff, as shown in Figs. 4 and 5 [28]. When TIeff>600, at lower (i≤20) temporal positions of the read-out radiofrequency pulse, both signal intensity and tissue contrast efficiencies show higher values; however when TIeff<600, there is a dip-and-rebound on signal intensity efficiency as well as dramatic low values for tissue contrast efficiency. To exclude this inconsistent trend, we suggest that the optimal temporal positions of the read-out radiofrequency pulse i should be greater than 20. When i>20, the signal and tissue contrast efficiencies show higher values with higher TIeff (>600) compared with lower TIeff. With higher TIeff (>600), signal intensity and contrast efficiencies decrease with increasing i and reach steady states when i is around 65 and 40, respectively. Therefore, we suggest the optimal temporal positions of the read-out radio-frequency pulse to be as small as possible with a minimum value of 20. Generally, the partial Fourier encoding can be performed by omitting the slice-selection direction phase encoding either at the beginning or at the end of the readout train. For the MP-RAGE sequence on a Siemens scanner, the partial Fourier encoding is performed by omitting slice-direction phase encoding at the beginning. With slice partial Fourier factors of 1, 7/8 or 6/8, the k-space center can only be shifted to the center of the nominal slice acquisition number N, 3 N/8, and N/4 from the beginning of the readout train, respectively. For example, to acquire a total of 120 slices per slab, the earliest acquisition that a 3-T Siemens Skyra scanner can achieve is when the temporal position of the read-out radiofrequency pulse is at 30, which corresponds to a slice partial Fourier factor of 6/8.
Fig. 4.
Simulation of normalized cerebrospinal fluid signal intensity efficiency as functions of temporal position of read-out radiofrequency pulse over different effective inversion recovery times. RF radiofrequency, SNR signal-to-noise ratio
Fig. 5.
Simulation of normalized gray matter–white matter contrast efficiency as a function of temporal position of read-out radiofrequency pulse over different effective inversion recovery times. CNR contrast-to-noise ratio, RF radiofrequency
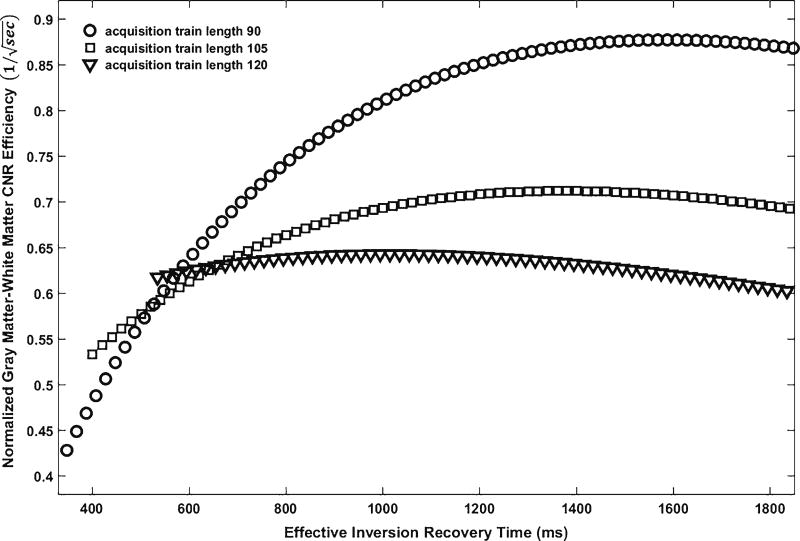
We simulated normalized gray matter–white matter contrast efficiency with different effective inversion recovery time TIeff over optional values of acquisition train length (Fig. 6). It first showed that the normalized gray matter–white matter contrast efficiency increases by approximately 40% when acquisition train length decreases from 120 to 90. This is consistent with the observation we made in Fig. 3 that the shorter the acquisition train length, the higher the tissue contrast. By examining the simulation results (acquisition train length 90), we found that gray matter–white matter contrast efficiency reaches its maximum at TIeff around 1,600 ms and maintains this maximum value with a negligible decline when TIeff is further increased. Therefore, we selected the optimal TIeff to be around 1,600 ms.
Fig. 6.
Simulation of normalized gray matter–white matter contrast efficiency as functions of effective inversion recovery time with different acquisition train lengths. Gray matter–white matter contrast efficiency is greatest with an acquisition train length of 90 and reaches its maximum at effective inversion recovery time of ~1,600. CNR contrast-to-noise ratio
The effect of delay time (TD) on SNR and CNR efficiencies is also simulated according to Eqs. 2 and 3. The results are identical to those for adult brains [19]. That is, both SNR and CNR efficiencies reduce monotonously with increasing delay time. Thus the optimal delay time is set to zero, and optimal is around 2,130 ms.
In summary, according to our simulations shown in Figs. 1, 2, 3, 4, 5 and 6, by balancing the theoretical recommendation and practical constraints, the optimal imaging parameters of the MP-RAGE sequence for neonatal imaging with a resolution of 1mm(total slice number of 120 to cover a whole brain) for a 3-T Siemens Skyra scanner are flip angle 12°, echo space time 8.5 ms, effective inversion recovery time around 1,600 ms, slice partial Fourier factor of 6/8, and TR of 2,130 ms.
In vivo brain imaging
Preterm infants
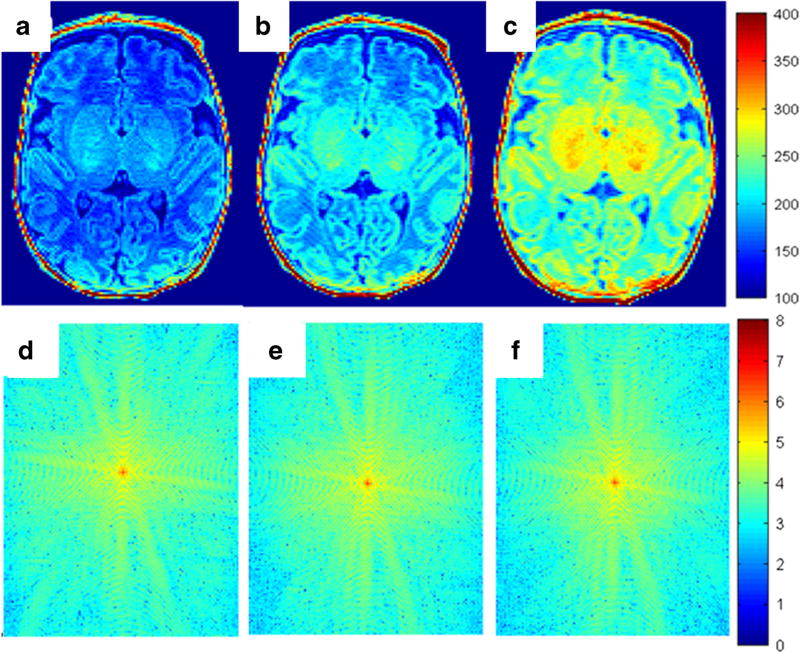
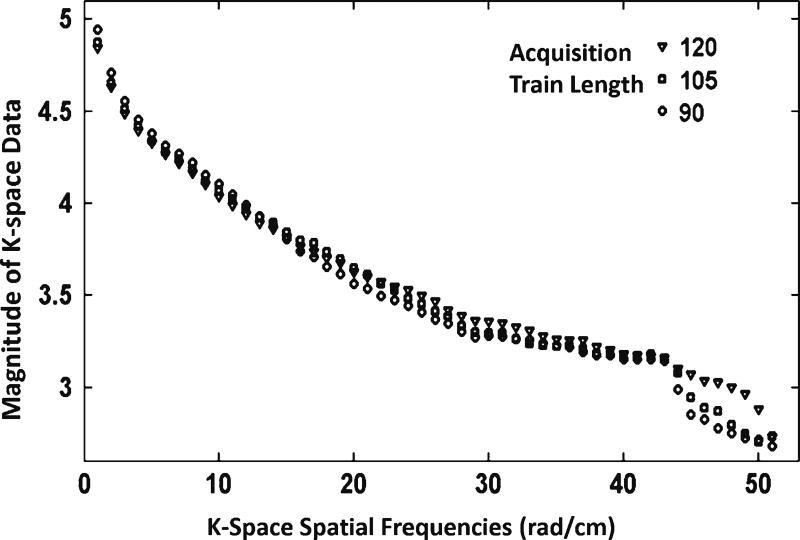
To demonstrate the effects of varying the acquisition train length on in vivo brain images, we scanned four preterm infants at 40 weeks’ corrected age. In other words, to validate the effects of acquisition train length on image quality for partial Fourier factors other than 6/8 (acquisition train length 90), we acquired additional images with partial Fourier factor of 7/8 (acquisition train length 105) and 1 (acquisition train length 120). All four MP-RAGE images were evaluated visually and determined to be of high quality with no or minimal artifacts. Figure 7 displays an example comparing images and their k-space representation of a preterm infant brain acquired at different acquisition train lengths. Qualitatively, signal intensity and contrast increased with decreasing acquisition train length. By transforming data from the image domain to k-space domain, we investigated the effect of acquisition train length on k-space spectrum. Visually, the magnitude of low spatial frequency components (near/at the center) was lowest with an acquisition train length of 120 and highest with an acquisition train length of 90; conversely, the magnitude of high spatial-frequency components (near the four corners) was highest with an acquisition train length of 120 and lowest with an acquisition train length of 90 (Fig. 7). Quantitative analysis in Fig. 8 exhibits consistency with Fig. 7, showing that decreasing acquisition train length improved the magnitude of low spatial frequency components while reducing the magnitude of high spatial frequency components in k-space. As a result, magnitude increment of low spatial frequency components increased SNR, while magnitude decrement of high spatial frequency components decreased spatial image resolution to a certain extent. Further quantitative analysis based on four preterm infants’ scans suggested that when we decreased acquisition train length from 120 to 90, SNR efficiency increased on average from 5.9 to 11.1 (s−1/2) (by 88%) and CNR efficiency improved from 1.18 to 2.11 (by 79%). Student’s paired t-test confirmed these improvements were significantly different, with P-value of 0.003 and <0.001, respectively. In summary, in vivo imaging validated our simulation results, which also showed that shortening acquisition train length in MP-RAGE acquisition significantly increased both signal intensity and tissue contrast.
Fig. 7.
Representative in vivo brain images and their k-space magnitude data from a preterm male neontate (gestational age: 30.0 weeks and post menstrual age at scan: 40.0 weeks) acquired with identical optimized imaging parameters but different acquisition train lengths: 120 (a, d), 105 (b, e) and 90 (c, f). The color bar in the first row indicates the signal intensity. The color bar in the second row indicates the k-space magnitude. The signal intensity at an acquisition train length of 90 (c) is the highest and at an acquisition train length of 120 (a) is the lowest. The magnitude of low spatial-frequency components (near the center) is the lowest with an acquisition train length of 120 (d) and highest with an acquisition train length of 90 (f). Conversely, the magnitude of high spatial-frequency components (corners) is the highest in (d) and the lowest in (f)
Fig. 8.
Quantitative analysis of the effect of acquisition train length on k-space spectrum. Shorter acquisition train length corresponds to higher magnitude of low spatial frequency components and lower magnitude of high spatial frequency components
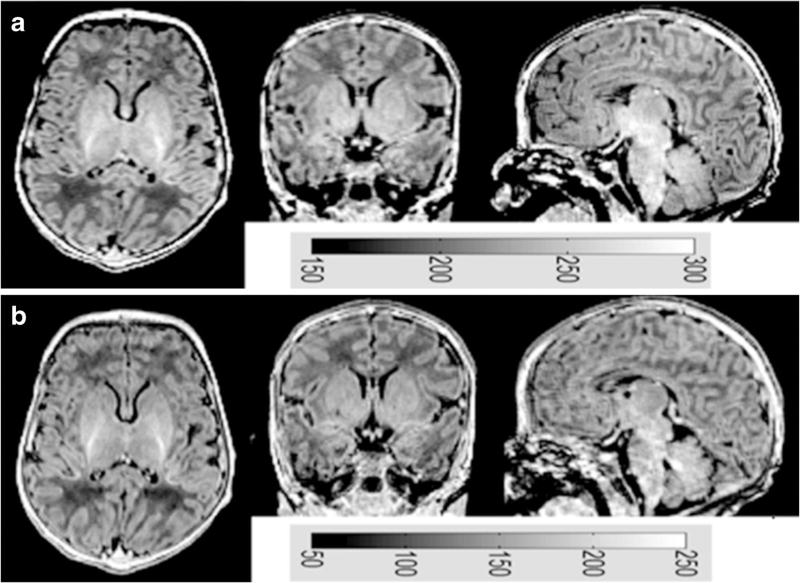
Full-term infants
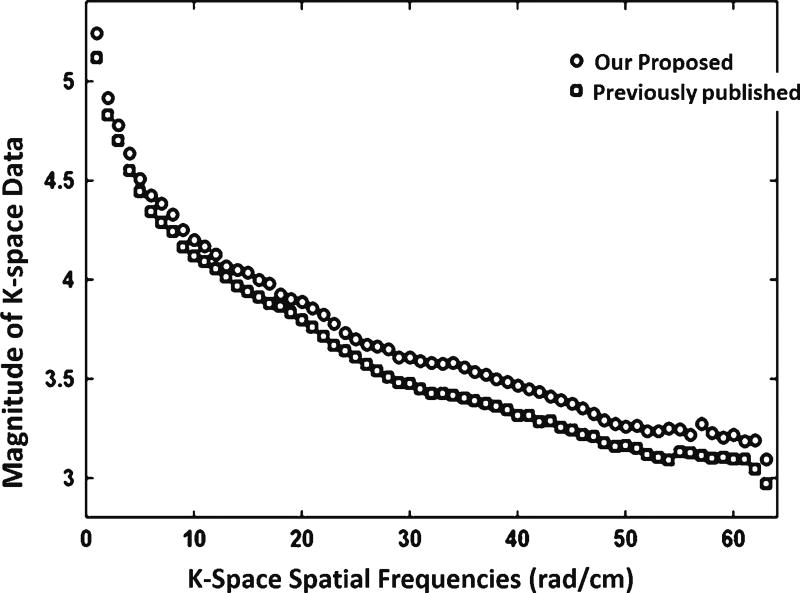
The MP-RAGE images for six healthy full-term infants were determined to be of high quality with no or minimal artifacts upon visual inspection. Figure 9 [28] shows sample images from a full-term infant obtained using our optimized imaging parameters compared to previously recommended parameters [21]. The tissue contrast appears similar between both sets of parameters. Similar structural details were captured and no apparent artifacts (except for mild motion) were observed in both images. The maximum gray-scale (indicating signal intensity) value used to display the image with optimized parameters was 300, while it was 250 to display the image with the previously recommended parameters. This implies that image signal intensity obtained using our optimized protocol was higher than that obtained using the previously published protocol [21]. We investigated whether our protocol introduced new artifacts, such as blurring. By transforming image data back to k-space domain, we observed that the magnitude of k-space data acquired with our protocol was higher than that acquired with the previous protocol at low spatial frequencies as well as middle and high spatial frequencies (Fig. 10). Therefore, our protocol did not reduce image sharpness, because it did not affect high-frequency components in k-space.
Fig. 9.
In vivo brain images from a full-term male neonate (gestational age: 40.6 weeks and post menstrual age at scan: 41.9 weeks) acquired with our optimized parameters (a) and previously published parameters (b). Gray-scale bars show the signal intensity values. Signal intensity in (a) is higher than that in (b)
Fig. 10.
Comparison of the magnitude of k-space data as a function of spatial frequency for in vivo brain images from a full-term male neonate (gestational age: 40.6 weeks and post menstrual age at scan: 41.9 weeks). Our proposed protocol outperforms the previous protocol at low frequency as well as middle and high frequencies
A pediatric neuroradiologist (B.M.K.-F.) with over 15 years of experience reviewed the six sets of MP-RAGE images acquired using the previously published and our proposed sequences in a blinded fashion. The average SNR, tissue contrast scores and the overall quality grade of the images acquired using the previously published sequence were 3.33, 3.83 and 3.58; those acquired while using our proposed sequence were 3.83, 4.50 and 4.17, respectively.
Quantitative comparisons of SNR and CNR efficiencies are shown in Table 3 for the six full-term newborns. The CNR efficiency of the images acquired using the previous protocol ranged from 1.4 to 2.3, with a mean of 1.8, while the range acquired with our optimized protocol was 1.8 to 2.6, with a mean of 2.3. Thus the average CNR efficiency was 26% higher with our protocol (P=0.029). In addition, the range of SNR efficiency of the images acquired using the previously published protocol [21] was 4.5 to 6.2, with a mean of 5.4, while the range acquired with our protocol was 12.6 to 15.1, with a mean of 14.1; the average SNR efficiency was 160% higher with our protocol (P<0.001).
Table 3.
Quantitative measures of contrast-to-noise ratio (CNR) and signal-to-noise ratio (SNR) efficiencies using our proposed optimized protocol and a previously published MP-RAGE protocol for neonates [23]
| Full-term subjects | CNR efficiency | SNR efficiency | ||
|---|---|---|---|---|
|
|
|
|||
| Proposed protocol | Previous protocol | Proposed protocol | Previous protocol | |
| 1 | 2.6 | 1.4 | 14.9 | 4.5 |
| 2 | 2.2 | 1.8 | 14.3 | 5.2 |
| 3 | 2.4 | 2.3 | 14.2 | 6.2 |
| 4 | 1.8 | 1.6 | 13.4 | 5.2 |
| 5 | 2.4 | 1.8 | 15.1 | 5.9 |
| 6 | 2.1 | 1.7 | 12.6 | 5.4 |
| Mean±SD | 2.3±0.3 | 1.8±0.3 | 14.1±0.9 | 5.4±0.6 |
SD standard deviation
Discussion
In this study we applied known neonatal brain tissue properties of T1, T2 and proton density to simulate the solution of Bloch’s equation. The specific narrow window of postmenstrual age near term-equivalent age to study our preterm and term infants was chosen because it is the most common time point when clinicians and researchers perform brain MRI for prognostication in very preterm infants and term infants with neonatal hypoxic–ischemic encephalopathy [33, 34]. In addition, published data suggest that MR tissue properties of infants during the first 6 months after birth are approximately the same [35, 36]. Therefore, our optimized protocol should be optimal for infants up to 6 months of age. Furthermore our methods can be readily adapted to brains of older children when T1 and T2 relaxation times for the desired age range of interest are known.
In this paper, we proposed to consider the potential effects of acquisition train length on image quality and acquisition efficiency [23]. We were also able to evaluate the overall performance of our proposed optimization method in vivo in preterm and full-term neonates. According to our simulation, the variability between infants of gray matter and white matter T1 values would impact mainly on the optimized inversion recovery time and have few effects on the optimized flip angle.
It has been suggested that centric phase encoding offers 40–100% higher CNR than linear phase encoding [12, 21]. In this study, we proposed an acquisition protocol using the 6/8 partial Fourier factor to shift the center of k-space between the beginning of echo train acquisition and the center of the nominal slice-direction acquisition. We previously demonstrated in adults using both simulations and in vivo experiments [19] that our off-center phase-encoding strategy outperforms centric phase encoding. The k-space optimization is one of the major factors that made our optimized neonatal protocol better than the previously published neonatal protocol.
Because the MP-RAGE echo train occurs with linear ordering along the slice phase-encoding direction, partial Fourier simply changes not only the time within the MP-RAGE echo train at which the center of k-space is sampled, but also the echo train length. As a result, shortening acquisition train length along the slice direction greatly improved SNR and CNR efficiencies. Our results also show that for images acquired with MP-RAGE, reduced acquisition train length attenuated the high spatial frequencies. In contrast, in FSE the high spatial frequency components are attenuated with long echo train length [37, 38]. The major reason for this discrepancy is that with long acquisition train length, T1 recovery dominates in MP-RAGE scans, whereas T2 decay dominates in FSE scans. Additionally, slice partial Fourier acquisition along the slice direction might reduce the magnitude of high spatial frequency components. In this case, we can apply other methods to reduce acquisition train length. For example, we can apply parallel acquisition techniques or increase slice thickness to shorten ATLs for identical brain coverage. We performed in vivo validation of the optimal acquisition train length but not for the echo spacing time, flip angle, k-space center or effective inversion recovery time. However the simulations we used for these in neonates were similar to those in our previous paper in adults, where we were able to validate these findings in vivo [19].
We noticed that performance improvement in the simulations showed higher percentages than for our in vivo experiments. The possible reasons include: (1) the use of simplified simulations that assumed perfect spoiling; it is quite difficult to achieve perfect spoiling with increasing flip angle [39] and imperfect spoiling affects the estimation accuracy of signal intensity; and (2) the optimization of both SNR and CNR efficiencies in neonates requires knowledge of T1, T2 and proton-density tissue properties for this population. T1 and T2 properties undergo significant changes during the first few months after birth because brain water content decreases markedly [40]. Such changes are most pronounced in the white matter in which the protein and lipid contents also become increasingly myelinated [41]. Therefore the MR properties of neonatal brains (i.e. T1, T2 and proton density) exhibit great variability between term and preterm infants, across different brain regions of a single subject and across subjects [42]. Because of the lack of data, we were unable to account for this variability; without loss of generality, we used average neonatal MR parameters in our simulations [24, 41].
In this study we chose a fixed receiver bandwidth of 140 Hz/pixel to achieve a higher SNR. A relatively lower bandwidth would generate more signal loss in areas affected by B0 distortions, increased fat–water shift, and reduced signal because of longer echo time. In this study, TE increased from 2.26 ms to 2.89 ms when the receiver bandwidth was reduced from 200 Hz/pixel to 140 Hz/pixel. Because T2* value of neonatal brain tissue is more than 100 ms, the reduced signal intensity caused by B0 distortion and longer TE can be negligible. Additionally, the fat content inside the brain is relatively low, and the effect of fat–water shift can be negligible in brain imaging. However this effect can become very important for body imaging, such as spine imaging. When the proposed method is applied to body imaging, it is necessary to consider the trade-off between SNR and fat–water artifacts in choosing the receiver bandwidth.
One of the biggest challenges in neonatal neuroimaging is that neonates, especially non-sedated ones, are more prone than adults to move during image acquisition, thereby introducing motion artifacts. Infants are increasingly scanned during natural sleep, induced by food, comfort and warmth [43]. This is usually successful but can be challenging for scans of long duration. Of our 12 attempts, we were unable to complete half of the scans with a previously published MP-RAGE protocol [21], likely because of the prolonged 9-min scan time. Our results are highly significant because we were able to reduce the total scan time by almost 60%, while achieving much higher signal intensity and similar contrast both quantitatively (Table 3) and qualitatively (based on blinded assessments by a pediatric neuroradiologist). This advance might also facilitate more accurate neuroradiology readings, especially in conditions that are best diagnosed using T1-weighted imaging such as neonatal hypoxic–ischemic encephalopathy or for more subtle lesions such as punctate white matter lesions in preterm infants. Because such punctate lesions reside in regions such as the periventricular white matter where partial volume effects can obscure diagnosis, increasing CNR becomes more important. Further, 3-D acquisition with isotropic resolution of 1 mm is expected to provide more accurate assessment of lesion load over 2-D T1 fluid-attenuated inversion recovery (FLAIR) images with slice thickness greater than 1-mm resolution. Improved SNR and CNR might also enhance automated tissue segmentation of neonatal brain images, which currently utilizes T2-weighted images and lower-resolution T1-weighted images. Neonatal brain tissue segmentation is more difficult than adult brain tissue segmentation because of reduced myelination, smaller field of view, and propensity for motion artifacts that characterize neonatal MRI scans. In future studies, we expect to enhance the accuracy of neonatal tissue segmentation by incorporating higher-contrast T1-weighted images into our existing automated brain segmentation method [44, 45].
Conclusion
We optimized the MP-RAGE sequence in neonates by employing Bloch’s equation and computer simulations under optimal k-space strategy and acquisition train length. We demonstrated that decreasing acquisition train length significantly improved signal and contrast efficiencies. Our in vivo neonatal brain imaging experiments also confirmed that both SNR and CNR efficiencies significantly increased with shorter acquisition train length. Our proposed optimal imaging parameters for neonatal MP-RAGE with a resolution of 1 mm (total slice number of 120 to cover a neonate’s whole brain) for the 3-T Siemens Skyra scanner are acquisition train length 90 (slice partial Fourier 6/8), effective inversion recovery time 1,610 ms, bandwidth 140 Hz/pixel, echo spacing time 8.5 ms, and flip angle 12°. Our optimization methodology could be readily extended to other populations (e.g., older children, adults), different organ systems, field strengths and MR sequences.
Acknowledgments
This work was funded in part by National Institutes of Health (NIH) grants R01-NS094200 and R01-NS096037 from the National Institute of Neurological Diseases and Stroke (NAP).
Footnotes
Compliance with ethical standards
Conflicts of interest None
References
- 1.Rutherford MA, Ward P, Malamateniou C. Advanced MR techniques in the term-born neonate with perinatal brain injury. Semin Fetal Neonatal Med. 2005;10:445–460. doi: 10.1016/j.siny.2005.05.005. [DOI] [PubMed] [Google Scholar]
- 2.Mugler JP, 3rd, Brookeman JR. Three-dimensional magnetization-prepared rapid gradient-echo imaging (3D MP RAGE) Magn Reson Med. 1990;15:152–157. doi: 10.1002/mrm.1910150117. [DOI] [PubMed] [Google Scholar]
- 3.Huppi PS, Warfield S, Kikinis R, et al. Quantitative magnetic resonance imaging of brain development in premature and mature newborns. Ann Neurol. 1998;43:224–235. doi: 10.1002/ana.410430213. [DOI] [PubMed] [Google Scholar]
- 4.Inder TE, Warfield SK, Wang H, et al. Abnormal cerebral structure is present at term in premature infants. Pediatrics. 2005;115:286–294. doi: 10.1542/peds.2004-0326. [DOI] [PubMed] [Google Scholar]
- 5.Srinivasan L, Dutta R, Counsell SJ, et al. Quantification of deep gray matter in preterm infants at term-equivalent age using manual volumetry of 3-tesla magnetic resonance images. Pediatrics. 2007;119:759–765. doi: 10.1542/peds.2006-2508. [DOI] [PubMed] [Google Scholar]
- 6.Peterson BS, Anderson AW, Ehrenkranz R, et al. Regional brain volumes and their later neurodevelopmental correlates in term and preterm infants. Pediatrics. 2003;111:939–948. doi: 10.1542/peds.111.5.939. [DOI] [PubMed] [Google Scholar]
- 7.Vasileiadis GT, Gelman N, Han VK, et al. Uncomplicated intraventricular hemorrhage is followed by reduced cortical volume at near-term age. Pediatrics. 2004;114:e367–372. doi: 10.1542/peds.2004-0500. [DOI] [PubMed] [Google Scholar]
- 8.Tolsa CB, Zimine S, Warfield SK, et al. Early alteration of structural and functional brain development in premature infants born with intrauterine growth restriction. Pediatr Res. 2004;56:132–138. doi: 10.1203/01.PDR.0000128983.54614.7E. [DOI] [PubMed] [Google Scholar]
- 9.Inder TE, Huppi PS, Warfield S, et al. Periventricular white matter injury in the premature infant is followed by reduced cerebral cortical gray matter volume at term. Ann Neurol. 1999;46:755–760. doi: 10.1002/1531-8249(199911)46:5<755::aid-ana11>3.0.co;2-0. [DOI] [PubMed] [Google Scholar]
- 10.Toft PB, Leth H, Ring PB, et al. Volumetric analysis of the normal infant brain and in intrauterine growth retardation. Early Hum Dev. 1995;43:15–29. doi: 10.1016/0378-3782(95)01657-o. [DOI] [PubMed] [Google Scholar]
- 11.Murphy BP, Inder TE, Huppi PS, et al. Impaired cerebral cortical gray matter growth after treatment with dexamethasone for neonatal chronic lung disease. Pediatrics. 2001;107:217–221. doi: 10.1542/peds.107.2.217. [DOI] [PubMed] [Google Scholar]
- 12.Deichmann R, Good CD, Josephs O, et al. Optimization of 3-D MP-RAGE sequences for structural brain imaging. NeuroImage. 2000;12:112–127. doi: 10.1006/nimg.2000.0601. [DOI] [PubMed] [Google Scholar]
- 13.Epstein FH, Mugler JP, 3rd, Brookeman JR. Optimization of parameter values for complex pulse sequences by simulated annealing: application to 3D MP-RAGE imaging of the brain. Magn Reson Med. 1994;31:164–177. doi: 10.1002/mrm.1910310210. [DOI] [PubMed] [Google Scholar]
- 14.Tardif CL, Collins DL, Pike GB. Regional impact of field strength on voxel-based morphometry results. Hum Brain Mapp. 2010;31:943–957. doi: 10.1002/hbm.20908. [DOI] [PMC free article] [PubMed] [Google Scholar]
- 15.Wu HH, Nishimura DG. 3D magnetization-prepared imaging using a stack-of-rings trajectory. Magn Reson Med. 2010;63:1210–1218. doi: 10.1002/mrm.22288. [DOI] [PMC free article] [PubMed] [Google Scholar]
- 16.Lin C, Bernstein MA. 3D magnetization prepared elliptical centric fast gradient echo imaging. Magn Reson Med. 2008;59:434–439. doi: 10.1002/mrm.21448. [DOI] [PubMed] [Google Scholar]
- 17.Jack CR, Jr, Bernstein MA, Fox NC, et al. The Alzheimer's Disease Neuroimaging Initiative (ADNI): MRI methods. J Magn Reson Imaging. 2008;27:685–691. doi: 10.1002/jmri.21049. [DOI] [PMC free article] [PubMed] [Google Scholar]
- 18.Tardif CL, Collins DL, Pike GB. Sensitivity of voxel-based morphometry analysis to choice of imaging protocol at 3 T. NeuroImage. 2009;44:827–838. doi: 10.1016/j.neuroimage.2008.09.053. [DOI] [PubMed] [Google Scholar]
- 19.Wang J, He L, Zheng H, et al. Optimizing the magnetization-prepared rapid gradient-echo (MP-RAGE) sequence. PLoS One. 2014;9:e96899. doi: 10.1371/journal.pone.0096899. [DOI] [PMC free article] [PubMed] [Google Scholar]
- 20.Williams LA, Gelman N, Picot PA, et al. Neonatal brain: regional variability of in vivo MR imaging relaxation rates at 3.0 T–initial experience. Radiology. 2005;235:595–603. doi: 10.1148/radiol.2352031769. [DOI] [PubMed] [Google Scholar]
- 21.Williams LA, DeVito TJ, Winter JD, et al. Optimization of 3D MP-RAGE for neonatal brain imaging at 3.0 T. Magn Reson Imaging. 2007;25:1162–1170. doi: 10.1016/j.mri.2007.01.119. [DOI] [PubMed] [Google Scholar]
- 22.Gelman N, Ewing JR, Gorell JM, et al. Interregional variation of longitudinal relaxation rates in human brain at 3.0 T: relation to estimated iron and water contents. Magn Reson Med. 2001;45:71–79. doi: 10.1002/1522-2594(200101)45:1<71::aid-mrm1011>3.0.co;2-2. [DOI] [PubMed] [Google Scholar]
- 23.Mugler JP., 3rd Optimized three-dimensional fast-spin-echo MRI. J Magn Reson Imaging. 2014;39:745–767. doi: 10.1002/jmri.24542. [DOI] [PubMed] [Google Scholar]
- 24.Macovski A. Noise in MRI. Magn Reson Med. 1996;36:494–497. doi: 10.1002/mrm.1910360327. [DOI] [PubMed] [Google Scholar]
- 25.Conklin J, Winter JD, Thompson RT, et al. High-contrast 3D neonatal brain imaging with combined T1- and T2-weighted MP-RAGE. Magn Reson Med. 2008;59:1190–1196. doi: 10.1002/mrm.21548. [DOI] [PubMed] [Google Scholar]
- 26.Shi F, Yap PT, Wu G, et al. Infant brain atlases from neonates to 1- and 2-year-olds. PLoS One. 2011;6:e18746. doi: 10.1371/journal.pone.0018746. [DOI] [PMC free article] [PubMed] [Google Scholar]
- 27.Liu X, Tanaka M, Okutomi M. Single-image noise level estimation for blind denoising. IEEE Trans Image Process. 2013;22:5226–5237. doi: 10.1109/TIP.2013.2283400. [DOI] [PubMed] [Google Scholar]
- 28.He L, Wang J, Smiths M, et al. Optimization of magnetization-prepared rapid gradient-echo (MP-RAGE) sequence for neonatal brain MRI; Paper presented at the ISMRM; Toronto. 2015. [DOI] [PMC free article] [PubMed] [Google Scholar]
- 29.Qin Q. Point spread functions of the T2 decay in k-space trajectories with long echo train. Magn Reson Imaging. 2012;30:1134–1142. doi: 10.1016/j.mri.2012.04.017. [DOI] [PMC free article] [PubMed] [Google Scholar]
- 30.Mugler JP, 3rd, Bao S, Mulkern RV, et al. Optimized single-slab three-dimensional spin-echo MR imaging of the brain. Radiology. 2000;216:891–899. doi: 10.1148/radiology.216.3.r00au46891. [DOI] [PubMed] [Google Scholar]
- 31.Margosian P, Schmitt F, Purdy D. Faster MR imaging: imaging with half the data. Health Care Instrum. 1986;1:195–197. [Google Scholar]
- 32.Feinberg DA, Hale JD, Watts JC, et al. Halving MR imaging time by conjugation: demonstration at 3.5 kG. Radiology. 1986;161:527–531. doi: 10.1148/radiology.161.2.3763926. [DOI] [PubMed] [Google Scholar]
- 33.Parikh NA. Advanced neuroimaging and its role in predicting neurodevelopmental outcomes in very preterm infants. Semin Perinatol. 2016;40:530–541. doi: 10.1053/j.semperi.2016.09.005. [DOI] [PMC free article] [PubMed] [Google Scholar]
- 34.van Laerhoven H, de Haan TR, Offringa M, et al. Prognostic tests in term neonates with hypoxic-ischemic encephalopathy: a systematic review. Pediatrics. 2013;131:88–98. doi: 10.1542/peds.2012-1297. [DOI] [PubMed] [Google Scholar]
- 35.Schneider J, Kober T, Bickle Graz M, et al. Evolution of T1 relaxation, ADC, and fractional anisotropy during early brain maturation: a serial imaging study on preterm infants. AJNR Am J Neuroradiol. 2016;37:155–162. doi: 10.3174/ajnr.A4510. [DOI] [PMC free article] [PubMed] [Google Scholar]
- 36.Leppert IR, Almli CR, McKinstry RC, et al. T(2) relaxometry of normal pediatric brain development. J Magn Reson Imaging. 2009;29:258–267. doi: 10.1002/jmri.21646. [DOI] [PMC free article] [PubMed] [Google Scholar]
- 37.Constable RT, Gore JC. The loss of small objects in variable TE imaging: implications for FSE, RARE, and EPI. Magn Reson Med. 1992;28:9–24. doi: 10.1002/mrm.1910280103. [DOI] [PubMed] [Google Scholar]
- 38.Ortendahl DA, Kaufman L, Kramer DM. Analysis of hybrid imaging techniques. Magn Reson Med. 1992;26:155–173. doi: 10.1002/mrm.1910260116. [DOI] [PubMed] [Google Scholar]
- 39.Zur Y, Wood ML, Neuringer LJ. Spoiling of transverse magnetization in steady-state sequences. Magn Reson Med. 1991;21:251–263. doi: 10.1002/mrm.1910210210. [DOI] [PubMed] [Google Scholar]
- 40.Dobbing J, Sands J. Quantitative growth and development of human brain. Arch Dis Child. 1973;48:757–767. doi: 10.1136/adc.48.10.757. [DOI] [PMC free article] [PubMed] [Google Scholar]
- 41.Jones RA, Palasis S, Grattan-Smith JD. MRI of the neonatal brain: optimization of spin-echo parameters. AJR Am J Roentgenol. 2004;182:367–372. doi: 10.2214/ajr.182.2.1820367. [DOI] [PubMed] [Google Scholar]
- 42.Paus T, Collins DL, Evans AC, et al. Maturation of white matter in the human brain: a review of magnetic resonance studies. Brain Res Bull. 2001;54:255–266. doi: 10.1016/s0361-9230(00)00434-2. [DOI] [PubMed] [Google Scholar]
- 43.Saunders DE, Thompson C, Gunny R, et al. Magnetic resonance imaging protocols for paediatric neuroradiology. Pediatr Radiol. 2007;37:789–797. doi: 10.1007/s00247-007-0462-9. [DOI] [PMC free article] [PubMed] [Google Scholar]
- 44.Yu X, Zhang Y, Lasky RE, et al. Comprehensive brain MRI segmentation in high risk preterm newborns. PLoS One. 2010;5:e13874. doi: 10.1371/journal.pone.0013874. [DOI] [PMC free article] [PubMed] [Google Scholar]
- 45.He L, Parikh NA. Automated detection of white matter signal abnormality using T2 relaxometry: application to brain segmentation on term MRI in very preterm infants. NeuroImage. 2013;64:328–340. doi: 10.1016/j.neuroimage.2012.08.081. [DOI] [PMC free article] [PubMed] [Google Scholar]


