Abstract
In computer-aided diagnosis systems for breast mammography, the pectoral muscle region can easily cause a high false positive rate and misdiagnosis due to its similar texture and low contrast with breast parenchyma. Pectoral muscle region segmentation is a crucial pre-processing step to identify lesions, and accurate segmentation in poor-contrast mammograms is still a challenging task. In order to tackle this problem, a novel method is proposed to automatically segment pectoral muscle region in this paper. The proposed method combines genetic algorithm and morphological selection algorithm, incorporating four steps: pre-processing, genetic algorithm, morphological selection, and polynomial curve fitting. For the evaluation results on different databases, the proposed method achieves average FP rate and FN rate of 2.03 and 6.90% (mini MIAS), 1.60 and 4.03% (DDSM), and 2.42 and 13.61% (INBreast), respectively. The results can be comparable performance in various metrics over the state-of-the-art methods.
Keywords: Breast mammography, Pectoral muscle region segmentation, Genetic algorithm, Morphological selection
Introduction
Breast cancer is the most common cancer in women worldwide and the second leading cause of female cancer deaths, impacting more than 1.7 million women each year [1]. In 2015, approximately 570,000 women died from breast cancer, that is, 15% of all cancer deaths among women [2]. In order to improve breast cancer survival, early examination is a quite important strategy of prevention. Mammography screening is the most frequently used technique in early breast cancer examination [3].
Mammography screening is a repetitive task that is time-consuming and exhausting. In practice, radiologists analyze hundreds of mammograms every day, which unavoidably lead to a lot of false positives or false negatives. Due to the advantages of consistency, reliability, and efficiency, the use of computer-aided diagnosis (CAD) systems to assist radiologists is popular. In breast CAD, segmentation of breast tissue is a crucial pre-processing step to identify lesions. The pectoral muscle region always appears as a higher-intensity and triangular region in most medio-lateral oblique (MLO) views. However, accurate segmentation of pectoral muscle region in poor-contrast mammograms is still a challenging task due to its similar texture and low contrast with breast parenchyma, which can easily cause a high false positive rate and misdiagnosis.
Many different approaches have been proposed to tackle this problem. Straight line estimation approaches [4–8] refine the boundary from a straight line with the change of gray intensity. These approaches need associate with other fine-tuned methods for pectoral muscle region with curved boundary. Region growing approaches [9–13] examine neighboring pixels of initial points and partition a mammogram into multiple regions. These approaches are sensitive to local gradient and noise, which do not always give good performance because of rigid stopping condition. The thresholding for edge detection approaches [14–20] segments the mammograms into multiple regions based on different gray intensities. These approaches do not always give good performance in low-contrast mammograms, because fewer thresholds are not enough for segmenting. Polynomial fitting [21–23] of the seed points is proposed to improve the performance for which pectoral muscle had a part of well contrast. These approaches more depend on the seed points from well-contrast boundary; their segmentation results in low-contrast regions are not stable. To our knowledge, these existing methods usually used empirical thresholds to detect initial boundary of pectoral muscle region. This strategy is effective for that mammograms with well contrast. Generally, mammogram is a type of gray scale medical image with low signal-to-noise ratio, and its contrast is poor. The prerequisite of using empirical thresholds is not robust.
Based on the background in previous statement, we propose an automatic method for pectoral muscle region segmentation in mammograms. The novel contributions are summarized as follows:
An automatic method combines genetic algorithm and morphological selection algorithm. This method can obtain robust performance of pectoral muscle region segmentation, especially in low-contrast mammograms.
We employ a genetic algorithm with wavelet transform to automatically learn multilevel thresholds for pectoral muscle region segmentation in mammograms.
We propose a morphological selection algorithm using morphological features. The algorithm adequately uses the prior characteristic of pectoral muscle in mammograms and efficiently searches the optimal contour that is close to the actual pectoral muscle region.
Related Work
There are many approaches have been developed for pectoral muscle region segmentation. According to the recent research review in this field by Mustra et al. [24], the most commonly used approaches contain straight line estimation, region growing, thresholding for edge detection, and polynomial fitting. The mini MIAS [25] database is the most used dataset, and only a few approaches evaluate all the mammograms in this database.
Straight line estimation is a very intuitive approach. It first estimates a straight line and then refines the boundary from the line with change of gray intensity or gradient in the region of interest (ROI). Kwok et al. [4, 5] presented a straight line method to estimate the pectoral muscle edge and refined the detected edge by cliff detection and surface smoothing. Approximately 94% of images were considered acceptably segmented. Ferrari et al. [6] proposed a straight line method based on Hough transform; it is possible to detect the longest or the brightest line in Hough space. Ferrari et al. also proposed a different approach using Gabor wavelets, specially designed for enhancing the pectoral muscle edge. The average FP and FN rates were, respectively, 0.58 and 5.77%. Kinoshita et al. [7] proposed a straight line method based on radon domain information. In the random domain, several suitable straight lines were detected as candidates to represent the pectoral muscle boundary. The average FP and FN were 8.99 and 9.13%, respectively. Chakraborty et al. [8] presented a pectoral muscle detection method based on average gradient and shape features; it contains of straight line approximation and curve smoothing. The average FP and FN pixel percentages were 4.22 and 6.71% for mini MIAS database.
Region growing approaches examine neighboring pixels of initial points and partition an image into multiple regions. Raba et al. [9] presented a segmentation method using region growing algorithm. Breast orientation was used to initial seed and a size restriction was applied to avoid a wrong growing. After the detection process, a morphological operation was used to refine the boundary. It achieved approximately 98% acceptable rate in test dataset. Nagi et al. [10] proposed a detection method using morphological pre-processing and seeded region growing algorithm. Chen and Zwiggelaar [11] presented a region growing method with the seed point located close to the border of the pectoral muscle and the breast tissue. A locally weighted regression method was used to refine the detected boundary; 92.8% nearly acceptable rate was achieved for MIAS database. Maitra et al. [12] also proposed a region growing method with three steps: contrast enhancement, defining the rectangle to isolate the pectoral muscle region, and seeded region growing algorithm. It achieved 95.71% acceptable rate in MIAS database. Rampun et al. [13] proposed a contour region growing method with two steps. Five edge features were applied to find the initial pectoral contour, and the actual boundary was searched via contour region growing. It achieved 97.8% dice similarity coefficients in MIAS database and 89.6% in INBreast database.
The thresholding for edge detection approaches segments the mammograms into multiple regions based on different gray intensities. Czaplicka and Wlodarczyk [14] proposed a thresholding method using multilevel Otsu threshold and refinement of initial segmentation by linear regression. Approximately 98% acceptable rate was achieved in test dataset. Camilus et al. [15, 16] presented a graph-cut segmentation method based on various thresholds to determine the initial boundary. Then, Bezier curve was applied to smooth the boundary. The mean of FP and FN rates were 0.64 and 5.58% in test dataset, respectively. Liu et al. [17] proposed a pectoral muscle identification method which utilizes statistical features of pixel responses. A global weighting scheme was applied onto the feature image to enhance pectoral muscle regions. Then, a preliminary set of pectoral muscles boundary was detected from the weighted image. The mean of FP and FN rates were 2.32 and 3.81% in test dataset, respectively. Vikhe et al. [18] proposed a thresholding method based on intensity for pectoral muscle boundary detection. After enhancement was applied on the image, the boundary points from the candidates were selected based on threshold technique. Then, all the boundary points detected were connected to obtain the boundary. It achieved 96.56% acceptable rate in test dataset. Sreedevi et al. [19] proposed global thresholding to identify pectoral muscles in combination with edge detection and connected labeling technique; 90.06% acceptable rate was achieved in test dataset. Yoon et al. [20] proposed a thresholding method with morphological operations and random sample consensus (RANSAC) algorithm. The results showed 92.2% acceptable rate in MIAS database.
To prevent false segmentation of mammograms that have a part of well-contrast pectoral muscle region, polynomial fitting of the seed points is proposed to predict the boundary in the poor-contrast part. Xu et al. [21] presented a optimal threshold method in combination with Hough transform and polyline fitting. After finding a optimal threshold, they extracted points from the initial pectoral muscle mask and performed polyline fitting in Hough space. Mustra and Grgic [22] presented a combination method with adaptive histogram equalization constrast enhancement and polynomial curvature estimation on selected region of interest. It achieved 96.56% acceptable rate in test dataset. Chen et al. [23] proposed a shape-based detection method for extracting the boundary of the pectoral muscle in mammograms. This method contained three steps: shape-based enhancement mask, shape-based growth strategy, and cubic polynomial fitting. The results showed 97.2% acceptable rate in MIAS database.
Some other related works applied specific method in pectoral muscle region segmentation. Ma et al. [26] proposed two image segmentation methods based on graph theory: adaptive pyramids (AP) and minimum spanning trees (MST), respectively. The AP method can obtain 3.71% FP and 5.95% FN, The MST method can obtain 2.55% FP and 11.68% FN. Iglesias et al. [27] provided a multi-atlas algorithm utilized the statistical information to estimate the pectoral muscle region. The mean of FP and FN rates was 2.23 and 6.62% in test dataset. Oliver et al. [28] used atlas, intensity, and texture information in probabilistic model to segment a mammogram. Zhou [29] developed a new texture-field orientation method that combines a priori knowledge and local and global information for the automated identification of pectoral muscle region. The mean of FP and FN were 2.33 and 2.88% in test dataset.
Methods
Our proposed methods incorporate four steps to automatically detect the pectoral muscle region: pre-processing, genetic algorithm, morphological selection, and polynomial curve fitting. The pre-processing step is proposed to determine the skin-air boundary of breast and remove various artifacts. The genetic algorithm can automatically learn multilevel thresholds for the processed grayscale image from previous step and segments the image into multiple regions based on multilevel thresholds. The morphological selection step employs morphological features to search the optimal contour with respect to pectoral muscle region. The polynomial curve fitting is proposed to smooth the pectoral muscle boundary and predict the boundary in the mammograms with a part of poor contrast.
Pre-processing
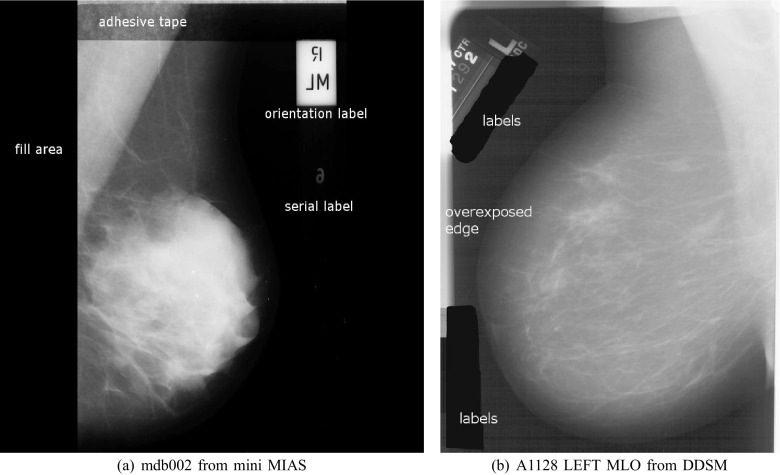
There are two commonly storing ways of mammograms: analog screen-film mammography (SFM) and full-field digital mammography (FFDM). In the case of scanned SFM images, each image may contain various artifacts, such as labels, markers, overexposed edges, fill area, and even adhesive tapes. Several types of artifacts are shown in Fig. 1.
Fig. 1.
Various artifacts in SFM images
In order to determine the skin-air boundary and improve the performance of pectoral muscle region segmentation, an algorithm employs a opening operation [30] and Otsu’s automatic thresholding [31] to remove artifacts on each image.
The opening operation can remove bright objects that are smaller than the kernel size, and restores the shape of remaining objects. The undersized kernel size leads to poor filtering performance and the oversized kernel size losses the boundary details of the remain objects. Based on the image resolution and the average size of noise points, the kernel is set as a disk shape with radius 10 pixels for mini MIAS database, and radius 50 pixels for DDSM [32]. In the next step, Otsu’s automatic thresholding is applied to generate a binary mask. Otsu’s algorithm tries to find a threshold value which minimizes the weighted within-class variance. Then, we choose the maximum connected domain of Otsu’s thresholding to generate a binary mask.
Finally, a logical multiply operation is performed between the binary mask and the original image. The pre-processing step is applied to determine the skin-air boundary of breast and remove various artifacts. The example of pre-processing step is shown in Fig. 2.
Fig. 2.
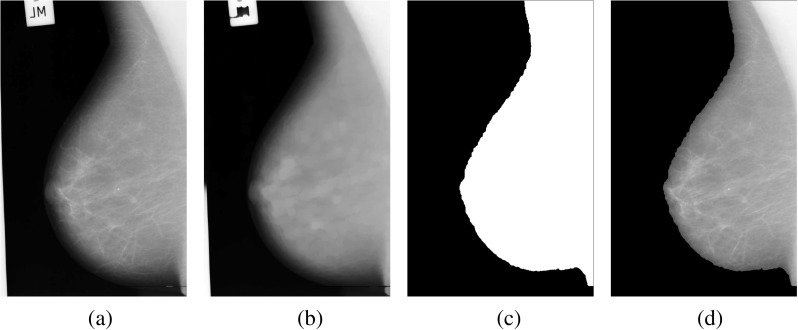
Example of pre-processing for mdb009 from mini MIAS database. a The original image without the fill area; b the modified image by opening operation; c the binary mask is chosen by the maximum connected domain after Otsu’s automatic thresholding for the modified image; d the final image without artifacts obtained from logical multiply operation between the binary mask and the original image
Genetic Algorithm
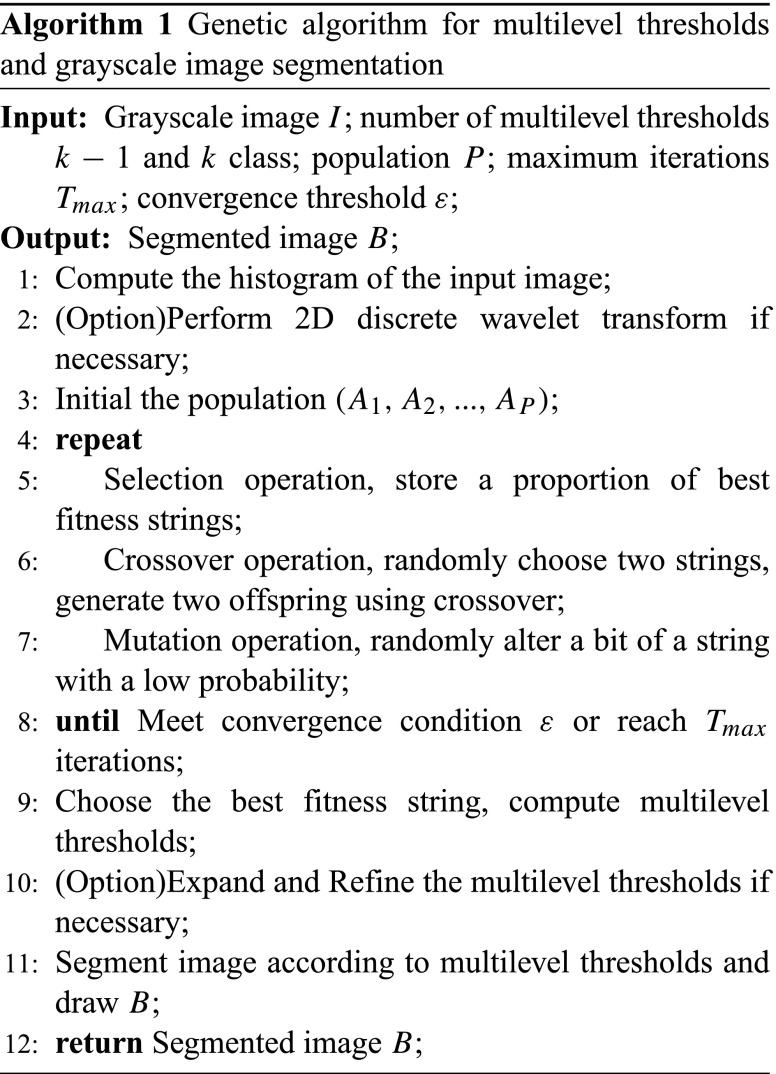
In this section, a genetic algorithm (GA) developed by Hammouche et al. [33] is introduced to automatically learn multilevel thresholds for the processed grayscale image from previous step and segment the image into multiple regions based on multilevel thresholds. For high-resolution grayscale image, this algorithm can employs 2D discrete wavelet transform [34] to accelerate the learning process, by learning the multilevel thresholds in the transformed image with low resolution.
Assume that an grayscale image I with gray levels is to be classified into classes with the set of multilevel thresholds . If a 2D discrete wavelet transform was performed, the length of gray levels was reduced to , where j was the wavelet resolution level.
In this proposed genetic algorithm, a chromosome is represented as a binary string A of size , given by
| 1 |
where denotes the number of multilevel thresholds. Such as , each character is equal to 0 or 1. In other words, a chromosome is a combination of binary representation of multilevel thresholds. The initial population of chromosomes with size P is randomly generated with a fixed length strings (A1,A2,...,AP) each string has randomly generated bits. For instance, the chromosome is a 32 bits string for the condition of and ; each 8 bits represent one threshold.
To determine the optimal string as well as the optimal multilevel thresholds, the genetic algorithm fitness function for a string was computed following Yen et al. [35], and is given by
| 2 |
where is a positive weighting constant and Disk denotes the within-class variance. The optimum class number and best multilevel thresholds can be determined by
| 3 |
In the proposed genetic algorithm, the learning strategy contains three types of genetic operations: selection, crossover, and mutation. The evolution process, the current population evolves to next population with the same size, is iterated until convergence or a maximum number of generations. The convergence condition is the change ratio of fitness function less than a convergence threshold (e.g., ). Selection operation mimics the natural survival of the fittest creatures. The probability of each string to be selected to next population is proportional to its fitness value. The crossover operation chooses two strings and of the current population. Single crossover is applied as follows: generate a random integer number within and create two offspring by swapping all the characters of and after position . The crossover is performed with the crossover probability . Mutation operation is an occasional alteration of a character in a string with a low probability . It generates a random integer number in and alter the bit in this string (i.e., 0 to 1, or 1 to 0).
If the multilevel threshold values determined by GA were obtained from a reduced histogram by a dyadic wavelet transform, these threshold values must be expanded to their original histogram spaces. In this case, each threshold was multiplied by a factor . Then, a refinement procedure was performed to obtain more accurate multilevel thresholds. In this procedure, compute the mean gray level of the class , where s denotes the time of iteration. The value of was updated and repeated until convergence according to the follow equation:
| 4 |
For previous learned multilevel thresholds, a grayscale image can be segmented into multiple regions. Suppose the input grayscale image is I, the output segmented image is B, and is the coordinate of pixel in image. The segmentation process is applied by
| 5 |
where , the minimum and maximum gray level are used as and , and is the set of multilevel thresholds.
The proposed genetic algorithm and next segmentation are summarized in Algorithm 1.
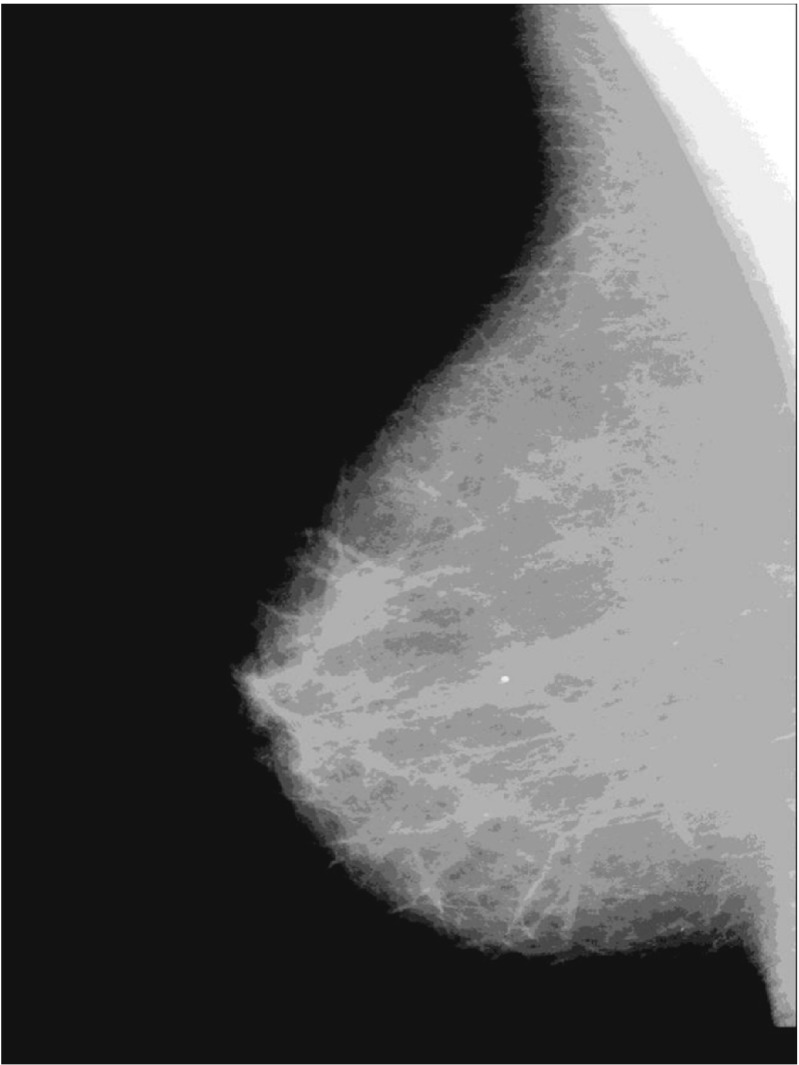
The example of this proposed genetic algorithm and segmentation is shown in Fig. 3. The algorithm was performed on mdb009 from mini MIAS database using following parameters given in Table 1. The thresholds parameter can be automatically obtained in the genetic algorithm. For mini MIAS database, wavelet transform level is set as 0. For DDSM and INBreast database, wavelet transform level is set as 3 to accelerate the learning process. Except wavelet transform level and thresholds, the other parameters of genetic algorithm use the same fixed configuration in the experiments. Moreover, the parameters except thresholds are correlated with the rate of computational convergence, the best fitness string are identical after the convergence.
Fig. 3.
Multilevel thresholds segmentation using proposed genetic algorithm for mdb009
Table 1.
Parameters used in proposed genetic algorithm for mdb009
| Parameter | Value |
|---|---|
| Thresholds | 10 |
| Population | 60 |
| Iterations | 100 |
| Selection probability | 0.1 |
| Crossover probability | 0.8 |
| Mutation probability | 0.1 |
| Wavelet transform level | 0 |
Morphological Selection
The pectoral muscle region has significant morphological features, such as higher intensity, roughly triangular shape, and gradually narrowing from top to bottom. In this section, a morphological selection algorithm is proposed to search the optimal contour of pectoral muscle region according to significant morphological features.
The following morphological features are used in proposed method: contour area size S, the ratio of contour area size to breast area size , the distance of contour centroid to axial corner D (the axial corner is decided by the orientation of breast, e.g., the top-right corner in Fig. 3), the ratio of contour area size to its convex hull area size Rch, namely solidity, and the similarity of contour with inverted right triangle L.
Based on the multilevel thresholds from previous section, a batch of binary masks can be obtained for each single threshold; each binary mask is given by
| 6 |
where , the example for mdb009 sets 10 multilevel thresholds for 11 binary masks, and the last five masks are shown in Fig. 4.
Fig. 4.

The last five binary masks for mdb009
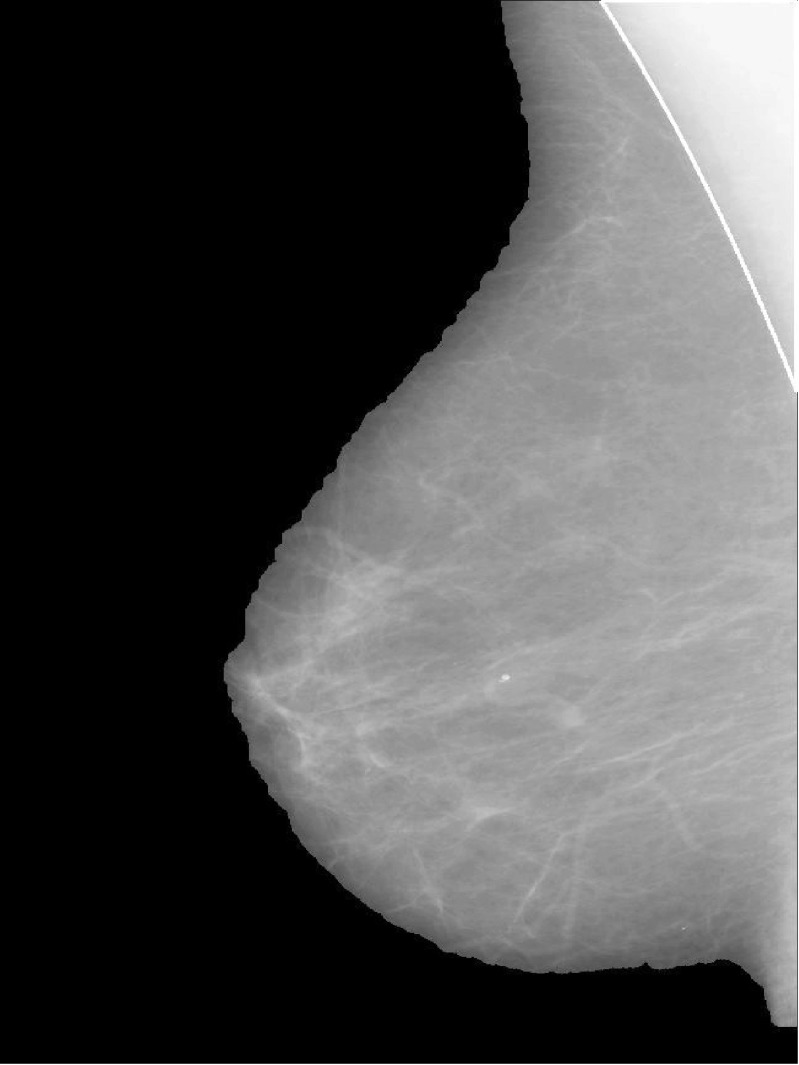
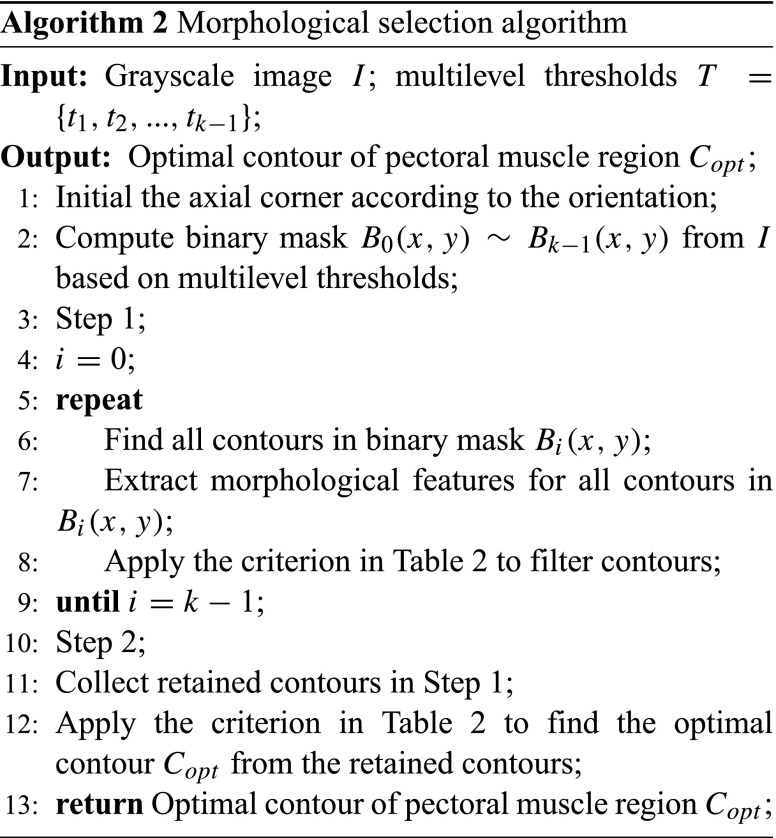
A contour search for each binary mask is implemented to find all proposal contours. Each proposal contour is a connected domain in corresponding binary mask. Then, morphological features are extracted for each proposal contour. A decision criterion with two steps is proposed to filter contours, given in Table 2. The particular values for the decision criterion are estimated from the samples of the corresponding database. The first step is performed in each binary mask, retaining the optimal contour in each mask. The S is used to filter too small contours (e.g., noise points). Based on the noise filter kernel size in pre-processing step (10 pixels), the minimum threshold of S is set as its square 100. The is used to filter too large contours (e.g., the contour of entire breast area). Based on imaging technique of MLO mammograms, the pectoral muscle regions reside in the top-left or top-right area and generally occupy a smaller part of the entire breast area (less than half). Therefore, the maximum threshold is set as 0.5. The is used to filter anomalous contours which have lower solidity (e.g., starlike contours). The L is used to filter dissimilar contours with inverted right triangle. The thresholds of and L are estimated by sampling statistics of the sample counters with the 95% confidence. The D is used to find the nearest contour to the axial corner in each binary mask. The second step is performed to find the optimal contour in retained contours from the first step. The Rch is used to find the maximal contour with the trade-off between contour area size and solidity, whose contour is selected as the optimal contour. The optimal contour of pectoral muscle region is shown in Fig. 5.
Table 2.
The decision criterion used in filtering contours for mini MIAS database
| Feature | Criterion | Step | Note |
|---|---|---|---|
| S | ≥ 100 | 1 | Contour area size |
| S ×Rch | max(⋅) | 2 | Product of contour area size and solidity |
| R cb | ≤ 0.5 | 1 | The ratio of contour area size to breast area size |
| D | min(⋅) | 1 | The distance of contour centroid to axial corner |
| R ch | ≥ 0.7 | 1 | The ratio of contour area size to its convex hull area size |
| L | ≤ 0.2 | 1 | The similarity of contour with inverted right triangle |
The S is used to filter too small contours (e.g., noise points). The Rcb is used to filter too large contours (e.g., the contour of entire breast area). The Rch is used to filter anomalous contours which have lower solidity (e.g.,starlike contours). The L is used to filter dissimilar contours with inverted right triangle. The D is used to find the nearest contour to the axial corner in each binary mask. The S ×Rch is used to find the maximal contour with the trade-off between contour area size and solidity, whose contour is selected as the optimal contour
Fig. 5.
The optimal contour of pectoral muscle region for mdb009
In very rare cases of mammograms, the pectoral muscle regions are nonexistent. For this cases, none proposal contour is retained after the filtering in the first step of morphological selection. This strategy ensures the robustness of the proposed method. The morphological selection procedure is summarized in Algorithm 2.
Polynomial Curve Fitting
Due to the noise in the original image, the optimal contour from morphological selection algorithm always has a rugged boundary. In minor cases, the mammograms have a part of well contrast and another part of poor contrast. To tackle this problem, a polynomial curve fitting is used to yield a smooth boundary.
Mustra et al. [22] proved that the curved boundary of pectoral muscle region in majority mammograms can be approximatively fitted in cubic function. Therefore, a cubic polynomial function with four coefficients is chosen in the proposed method, given by
| 7 |
where y is the horizontal coordinate, x is the vertical coordinate, and are the polynomial coefficients. Compared with linear function or quadratic function in this case, cubic fitting function has better performance without under-fitting problem. Although higher degree of polynomial function can also fit the curved boundary, it increases the risk of over-fitting with overall deviation.
In order to learn the coefficients of the cubic function, all the points in the boundary from the optimal contour are used. It can efficiently overcome the over-fitting problem with enough points. The result of boundary curve is shown in Fig. 6.
Fig. 6.
Boundary curve of pectoral muscle region and breast tissue for mdb009
Experiment
Datasets
To evaluate the performance of proposed method, we use three different databases: mini MIAS [25] database, DDSM [32] database, and INBreast [36] database. The mini MIAS database is a screen-film mammography (SFM) database, which contains 322 mammograms with resolution of pixels and 8 bits per pixel. The DDSM is the largest public SFM database, it contains 2620 cases with 10480 mammograms in total. The INBreast database is a public FFDM database in the field; it contains 201 MLO mammograms with annotations.
The mammograms of DDSM and INBreast database have higher image resolution, typically and . In the DDSM database, the MLO mammograms do not have annotations of pectoral muscle region. We only sample 128 mammograms from DDSM database for evaluation. Furthermore, we preferentially select low-contrast mammograms.
The evaluation dataset contains 651 MLO mammograms in total. The all 322 mammograms from mini MIAS database and the 128 MLO mammograms from DDSM use the manual segmentation annotated by a group of expert radiologists as ground truth. The all 201 MLO mammograms from INBreast database use the pectoral muscle boundary annotations as ground truth, which were provided by INBreast database. For mammograms from DDSM and INBreast databases, 2D wavelet transform is employed to reduce the resolution and gray levels in the proposed method. The wavelet transform level is set as 3 in the experiments.
Quantitative Evaluation
To quantitatively evaluate the performance of the proposed method, we use the following metrics: FP rate, FN rate, Jaccard similarity coefficient, Dice similarity coefficient, and Hausdorff distance.
Suppose that D is the set of pixels in detected region and R is the set of pixels in ground truth region. is the set of detected boundary points and is the set of ground truth boundary points. These metrics are given by
| 8 |
| 9 |
| 10 |
| 11 |
| 12 |
where refers to the number of pixels of that region and is the Euclidean distance between two point. and are given by
| 13 |
| 14 |
More details of the proposed metrics are presented in [37–41].
Results
All mammograms are obtained from MLO view, and the pixel resolutions of each database are 200, 50, 70 μ m respectively. For the 322 mammograms from mini MIAS database, the results of pectoral muscle region segmentation can be classified into three categories: successful, acceptable, and unacceptable. The result is rated as successful if the segmentation result is matched to the real boundary exactly or nearly exactly. If minor pixels near the real boundary are mis-segmented, the result is rated as acceptable. Based on the recommendations of a group of expert radiologists, we employ the following quantitative criterions of classification. For unacceptable results, the FP rate or the FN rate of detected pectoral muscle region is greater than 0.2. For acceptable results, one of the FP rate and the FN rate is in the range of 0.1 to 0.2; the other one is less than 0.1. For successful results, the FP rate and the FN rate are less than 0.1. Otherwise, the result is rated as unacceptable. The detection results of our proposed method for 322 mammograms from mini MIAS database are listed in Table 3; 291 mammograms are segmented out the pectoral muscle region successfully and 21 mammograms are acceptable. Therefore, a total 96.89% of the results are successful or acceptable. The rest of 10 mammograms are classified into unacceptable.
Table 3.
The detection results of 322 mammograms from mini MIAS database
| Category | Number | Percentage | Criterions |
|---|---|---|---|
| Successful | 291 | 90.37 | FP ≤ 0.1 and FN ≤ 0.1 |
| Acceptable | 21 | 6.52 | min(FP, FN) ≤ 0.1 and 0.1 < max(FP, FN) ≤ 0.2 |
| Unacceptable | 10 | 3.11 | FP > 0.2 or FN > 0.2 |
A total 96.89% of the results were successful or acceptable. The quantitative criterions of these categories is the most common criterion from related literature
Our proposed method also presents competitive performance of metrics that are comparable with the state-of-the-art methods; the overall quantitative results for the proposed method are shown in Table 4. The quantitative results of mini MIAS database are counted from all 322 mammograms; the quantitative results of DDSM and INBreast are counted from 128 MLO mammograms and 201 MLO mammograms respectively.
Table 4.
Average quantitative results of evaluation dataset
| Metric | Mini MIAS | DDSM | INBreast |
|---|---|---|---|
| FP (%) | 2.03 ± 2.24 | 1.60 ± 1.86 | 2.42 ± 6.22 |
| FN (%) | 6.90 ± 10.07 | 4.03 ± 2.31 | 13.61 ± 17.05 |
| Jaccard (%) | 91.25 ± 10.48 | 94.48 ± 2.19 | 84.61 ± 18.15 |
| Dice (%) | 94.96 ± 8.55 | 97.15 ± 1.16 | 89.10 ± 16.54 |
| Hd (mm) | 8.15 ± 8.77 | 6.77 ± 5.68 | 17.28 ± 23.75 |
The number of mammograms from each database are 322, 128, and 201 respectively. All metrics are presented in the form of mean with standard deviation(μ ± σ). Hd is Hausdorff distance. The pixel resolutions of each database are 200, 50, and 70 μ m respectively
For mini MIAS database, the proposed method achieves average FP rate, FN rate, Jaccard similarity coefficient, Dice similarity coefficient, and mm Hausdorff distance. For DDSM database, a 2D discrete wavelet transform is employed to reduce computational complexity, the wavelet is set as with level 3 [42]. The proposed method achieves average FP rate, FN rate, Jaccard similarity coefficient, Dice similarity coefficient, and mm Hausdorff distance. For INBreast database, a 2D discrete wavelet transform is also employed as DDSM database. The proposed method achieves average FP rate, FN rate, Jaccard similarity coefficient, Dice similarity coefficient, and mm Hausdorff distance. The evaluation results on mini MIAS database and DDSM database are competitive. Because the INBreast database contains many abnormal MLO mammograms, such as abnormal pectoral muscle position and incorrect boundary annotation, the evaluation results on INBreast database are restricted.
The state-of-the-art methods for comparison in the literature are shown in Table 5. It should be noted that the results of the comparative methods may be evaluated on different datasets and different evaluation metrics. Many studies quantitatively evaluated their methods based on private ground truth (e.g., used visual assessment by a group of expert radiologists). It is difficult to make a direct comparison between various methods. To minimize these deviation, we principally make a comparison between studies which used mini MIAS database with similar metrics. As shown in Table 5, most of the studies did not evaluate their methods on all 322 of the mammograms in mini MIAS database. For a small dataset with 84 mammograms, Ferrari et al. [6] achieved average FP rate, FN rate, and 3.88 mm Hausdorff distance; Camilus et al. [16] achieved average FP rate, FN rate, and 3.85 mm Hausdorff distance; Ma et al. [26] achieved average FP rate and FN rate using AP method and average FP rate and FN rate using MST method; Chen et al. [23] achieved average FP rate, FN rate, and 3.53 mm Hausdorff distance. For a whole dataset with all mammograms, Liu et al. [17] achieved average FP rate, FN rate, and 3.47 mm Hausdorff distance; Rampun et al. [13] achieved average FP rate, FN rate, 94.9% Jaccard similarity coefficient, and 97.9% Dice similarity coefficient. Our proposed method produced a comparable performance over the state-of-the-art methods.
Table 5.
Qualitative comparison
| Authers | Dataset | Results |
|---|---|---|
| Ferrari et al. [6] | 84⋆ | FP = 0.58%, FN = 5.77% Hd = 3.84 mm |
| Kinoshita et al. [7] | 540 | FP = 8.99%, FN = 9.13% Hd = 12.45 mm |
| Chakraborty et al. [8] | 80⋆ | FP = 4.22%, FN = 6.71% Hd = 7.71 mm |
| Camilus et al. [16] | 84‡ | FP = 0.85%, FN = 4.88% Hd = 3.85 mm |
| Liu et al. [17] | 318⋆ | FP = 2.32%, FN = 3.81% Hd = 3.47 mm |
| Rampun et al. [13] | 322‡ | FP = 2.30%, FN = 4.70% Jaccard = 94.9%, Dice = 97.9% |
| Ma et al. [26] | 84⋆ | FP = 3.71%, FN = 5.95%(AP) FP = 2.55%, FN = 11.68%(MST) |
| Iglesias et al. [27] | 80 | FP = 2.23%, FN = 6.62% Hd = 23.96 mm |
| Zhou [29] | 637 | FP = 2.33%, FN = 2.88% Hd = 3.45 mm |
| Oliver et al. [28] | 149‡ | Dice = 83% |
| Chen et al. [23] | 84⋆ | FP = 1.02%, FN = 5.63% Hd = 3.53 mm |
It should be noted that the results of the comparative methods may be quantitatively evaluated based on private ground truth. ⋆ denotes these images from mini MIAS database, ‡ denotes these images from MIAS database
Examples of pectoral muscle region segmentation results from each database are shown in Fig. 7 with ground truth. We plot the ground truth(red) on the segmented mammograms which have been removed the estimated pectoral muscle regions. Mammograms are sampled from mini MIAS database, are sampled from DDSM database, and are sampled from INBreast database. The proposed method achieves excellent performance in each example mammograms.
Fig. 7.

Examples of pectoral muscle region segmentation results from each database. The ground truth boundaries are plotted in red on the segmented mammograms which have been removed the estimated pectoral muscle regions. Mammograms are sampled from mini MIAS database, are sampled from DDSM database, and are sampled from INBreast database
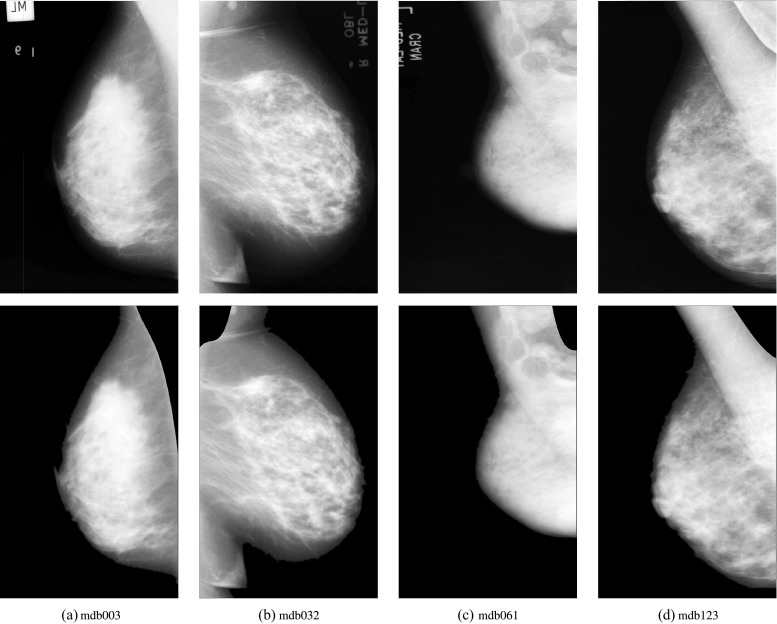
With further analysis for the acceptable and unacceptable results from mini MIAS database, there still remain limitations of the proposed method. Primarily, since the genetic algorithm is based on overall image gray intensity, it is difficult to segment the overall image into local regions appropriately in vary rare cases (e.g., pectoral muscle region and breast parenchyma have uniform gray intensity, or strong white Gaussian noise). Secondly, the morphological selection algorithm used some prior knowledge as filtering criterion; it may lead to poor performance for rare cases which did not conform to ordinary experience, such as pectoral muscle region in abnormal position of image, or irregular shape. Several samples are shown in Fig. 8. To overcome these limitations, we plan to employ local adaptive filtering methods to enhance mammograms and employ more robust features to filter contours in our future work.
Fig. 8.
The samples with acceptable and unacceptable results. The upper row shows the original mammograms, and the under row shows the segmentation results. a The acceptable sample mdb003 with over-segmented pectoral muscle; b the acceptable sample mdb032 with under-segmented pectoral muscle; c the unacceptable sample mdb061, it is unacceptable because pectoral muscle region and breast parenchyma have uniform gray intensity around the truth boundary; d the unacceptable sample mdb123, it is unacceptable because pectoral muscle region has abnormal split line
Conclusions
We propose a new method for automatic pectoral muscle region segmentation in MLO views of mammograms. The proposed method combines genetic algorithm and morphological selection algorithm, incorporating four steps: pre-processing, genetic algorithm, morphological selection, and polynomial curve fitting. The genetic algorithm is used to learn multilevel thresholds and segment the mammogram to multiple regions. The morphological selection algorithm is used to search the optimal contour of pectoral muscle region based on morphological features. The proposed method was evaluated on different databases (mini MIAS, DDSM, INBreast) with a total of 651 mammograms. The results of various metrics show that our proposed method achieved a comparable performance over the state-of-the-art methods in the literature.
Contributor Information
Rongbo Shen, Email: rock_shen@hust.edu.cn.
Kezhou Yan, Email: kezhouyan@tencent.com.
Ke Zhou, Email: k.zhou@hust.edu.cn.
References
- 1.Stewart B, Wild CP, et al (2017) World cancer report 2014, Health
- 2.World Health Organization Breast cancer (2017). [Online]. Available: http://www.who.int/cancer/prevention/diagnosis-screening/breast-cancer/en/
- 3.World Health Organization, et al. (2014) WHO position paper on mammography screening. World Health Organization [PubMed]
- 4.Kwok S, Chandrasekhar R, Attikiouzel Y Automatic pectoral muscle segmentation on mammograms by straight line estimation and cliff detection. In: Intelligent Information Systems Conference, The Seventh Australian and New Zealand 2001. IEEE, 2001, pp 67–72
- 5.Kwok SM, Chandrasekhar R, Attikiouzel Y, Rickard MT: Automatic pectoral muscle segmentation on mediolateral oblique view mammograms. IEEE Trans Med Imaging 23 (9): 1129–1140, 2004 [DOI] [PubMed]
- 6.Ferrari RJ, Rangayyan RM, Desautels JL, Borges R, Frere AF: Automatic identification of the pectoral muscle in mammograms. IEEE Trans Med Imaging 23 (2): 232–245, 2004 [DOI] [PubMed]
- 7.Kinoshita SK, Azevedo-Marques PM, Pereira RR, Rodrigues JAH, Rangayyan RM: Radon-domain detection of the nipple and the pectoral muscle in mammograms. J Digit Imaging 21 (1): 37–49, 2008 [DOI] [PMC free article] [PubMed]
- 8.Chakraborty J, Mukhopadhyay S, Singla V, Khandelwal N, Bhattacharyya P: Automatic detection of pectoral muscle using average gradient and shape based feature. J Digit Imaging 25 (3): 387–399, 2012 [DOI] [PMC free article] [PubMed]
- 9.Raba D, Oliver A, Martí J, Peracaula M, Espunya J (2005) Breast segmentation with pectoral muscle suppression on digital mammograms. Pattern Recognition and Image Analysis, pp 153–158
- 10.Nagi J, Kareem SA, Nagi F, Ahmed SK Automated breast profile segmentation for ROI detection using digital mammograms. In: 2010 IEEE EMBS conference on biomedical engineering and sciences (IECBES). IEEE, 2010, pp 87–92
- 11.Chen Z, Zwiggelaar R A combined method for automatic identification of the breast boundary in mammograms. In: 2012 5th International Conference on Biomedical Engineering and Informatics (BMEI). IEEE, 2012, pp 121– 125
- 12.Maitra IK, Nag S, Bandyopadhyay SK: Technique for preprocessing of digital mammogram. Comput Methods Prog Biomed 107 (2): 175–188, 2012 [DOI] [PubMed]
- 13.Rampun A, Morrow PJ, Scotney BW, Winder J (2017) Fully automated breast boundary and pectoral muscle segmentation in mammograms. Artificial Intelligence in Medicine [DOI] [PubMed]
- 14.Czaplicka K, Włodarczyk H., et al: Automatic breast-line and pectoral muscle segmentation. Schedae Informaticae 2011 (20): 195–209, 2012
- 15.Camilus KS, Govindan V, Sathidevi P: Computer-aided identification of the pectoral muscle in digitized mammograms. J Digit Imaging 23 (5): 562–580, 2010 [DOI] [PMC free article] [PubMed]
- 16.Camilus KS, Govindan V, Sathidevi P: Pectoral muscle identification in mammograms. J Appl Clin Med Phys 12 (3): 215–230, 2011 [DOI] [PMC free article] [PubMed]
- 17.Liu L, Liu Q, Lu W: Pectoral muscle detection in mammograms using local statistical features. J Digit Imaging 27 (5): 633–641, 2014 [DOI] [PMC free article] [PubMed]
- 18.Vikhe P, Thool V: Intensity based automatic boundary identification of pectoral muscle in mammograms. Proc. Comput. Sci. 79: 262–269, 2016
- 19.Sreedevi S, Sherly E: A novel approach for removal of pectoral muscles in digital mammogram. Proc. Comput. Sci. 46: 1724–1731, 2015
- 20.Yoon WB, Oh JE, Chae EY, Kim HH, Lee SY, Kim KG Automatic detection of pectoral muscle region for computer-aided diagnosis using MIAS mammograms. BioMed research international, 2016 [DOI] [PMC free article] [PubMed]
- 21.Xu W, Li L, Liu W A novel pectoral muscle segmentation algorithm based on polyline fitting and elastic thread approaching. In: 2007 The 1st international conference on bioinformatics and biomedical engineering, 2007. ICBBE. IEEE, 2007, pp 837– 840
- 22.Mustra M, Grgic M: Robust automatic breast and pectoral muscle segmentation from scanned mammograms. Signal Process 93 (10): 2817–2827, 2013
- 23.Chen C, Liu G, Wang J, Sudlow G: Shape-based automatic detection of pectoral muscle boundary in mammograms. J Med Biol Eng 35 (3): 315–322, 2015 [DOI] [PMC free article] [PubMed]
- 24.Mustra M, Grgic M, Rangayyan RM: Review of recent advances in segmentation of the breast boundary and the pectoral muscle in mammograms. Med Biol Eng Comput 54 (7): 1003–1024, 2016 [DOI] [PubMed]
- 25.Suckling J, Parker J, Dance D, Astley S, Hutt I, Boggis C, Ricketts I, Stamatakis E, Cerneaz N, Kok S, et al. The mammographic image analysis society digital mammogram database. In: Exerpta Medica. International Congress Series, vol 1069, 1994, pp 375–378
- 26.Ma F, Bajger M, Slavotinek JP, Bottema MJ: Two graph theory based methods for identifying the pectoral muscle in mammograms. Pattern Recogn 40 (9): 2592–2602, 2007
- 27.Iglesias JE, Karssemeijer N: Robust initial detection of landmarks in film-screen mammograms using multiple FFDM atlases. IEEE Trans Med Imaging 28 (11): 1815–1824, 2009 [DOI] [PubMed]
- 28.Oliver A, Lladó X, Torrent A, Martí J One-shot segmentation of breast, pectoral muscle, and background in digitised mammograms. In: 2014 IEEE International Conference on Image Processing (ICIP). IEEE, 2014, pp 912–916
- 29.Zhou C, Wei J, Chan H.-P., Paramagul C, Hadjiiski LM, Sahiner B, Douglas JA: Computerized image analysis: Texture-field orientation method for pectoral muscle identification on MLO-view mammograms. Med Phys 37 (5): 2289–2299, 2010 [DOI] [PMC free article] [PubMed]
- 30.Masters BR, Gonzalez RC, Woods R: Digital image processing. J sBiomed Opt 14 (2): 029901, 2009
- 31.Otsu N: A threshold selection method from gray-level histograms. IEEE Trans Syst Man Cybern 9 (1): 62–66, 1979
- 32.Heath M, Bowyer K, Kopans D, Moore R, Kegelmeyer WP The digital database for screening mammography, in Proceedings of the 5th international workshop on digital mammography, Medical Physics Publishing, 2000, pp 212–218
- 33.Hammouche K, Diaf M, Siarry P: A multilevel automatic thresholding method based on a genetic algorithm for a fast image segmentation. Comput Vis Image Underst 109 (2): 163–175, 2008
- 34.Ergen B (2012) Signal and image denoising using wavelet transform. In: Advances in Wavelet Theory and Their Applications in Engineering, Physics and Technology, InTech
- 35.Yen J-C, Chang F-J, Chang S: A new criterion for automatic multilevel thresholding. IEEE Trans Image Process 4 (3): 370–378, 1995 [DOI] [PubMed]
- 36.Moreira IC, Amaral I, Domingues I, Cardoso A, Cardoso MJ, Cardoso JS: Inbreast: toward a full-field digital mammographic database. Acad Radiol 19 (2): 236–248, 2012 [DOI] [PubMed]
- 37.Gower JC: Measures of similarity, dissimilarity and distance. Encyclopedia of Statistical Sciences, Johnson and CB Read 5: 397–405, 1985
- 38.Gardner A, Kanno J, Duncan CA, Selmic R Measuring distance between unordered sets of different sizes. In: Proceedings of the IEEE Conference on Computer Vision and Pattern Recognition, 2014, pp 137–143
- 39.Jaccard P: Étude comparative de la distribution florale dans une portion des alpes et des jura. Bull Soc Vaudoise Sci Nat 37: 547–579, 1901
- 40.Kosub S (2016) A note on the triangle inequality for the Jaccard distance. arXiv:1612.02696
- 41.Henrikson J: Completeness and total boundedness of the Hausdorff metric. MIT Undergraduate J Math 1: 69–80, 1999
- 42.PyWavelets development team, Pywavelets, 2017. [Online]. Available: https://github.com/PyWavelets/pywt


