Abstract
BACKGROUND
Assessment of growth using Z-score methods is important for clinical care and research, yet growth reference Z-score data for preschool Saudi children are not available.
OBJECTIVE
Establish Z-score tables and corresponding growth charts.
DESIGN
Uses data from a national survey in 2004–2005.
SETTING
Community-based random sample of preschool Saudi children.
SUBJECTS AND METHODS
Raw data from the previous nationally representative sample were analyzed using the L, M, and S statistical methods to calculate Z-scores of growth.
MAIN OUTCOME MEASURE(S)
Z-scores reference values for weight, length/height, head circumference, weight for length/height, and body mass index for age for boys and girls from birth to 60 months of age.
RESULTS
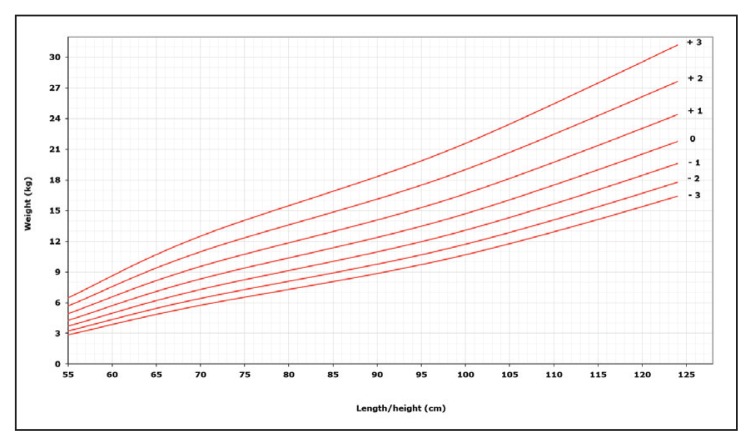
For 15 601 Saudi children (7896, 50.6 % boys) Z-score tables and graphs from birth to 60 months of age were derived for boys and girls. The tables and graphs include weight for age, length/height for age, head circumference for age, weight for length/height, and BMI for age.
CONCLUSION
Z-score reference data on the growth of preschool Saudi infants and children is essential for healthcare and research.
LIMITATION
Does not include regional variations.
Growth charts are one of the most important tools available for the assessment of growth and nutritional status of children. Although the history of growth charts dates to more than 100 years ago,1 two growth charts are commonly used worldwide at the present time. The first is the Center for Disease Control (CDC) 2000 growth charts for United States, a reference describing the growth of American children and adolescents.2 The second is the 2006 Child Growth Standards published by the World Health Organization (WHO) and used exclusively for preschool children.3 However, in view of the ethnic and environmental variations of growth between populations,4,5 many developed,6–8 and developing countries,9–11 have developed and still use at least in part their own local growth charts. In Saudi Arabia, the first national growth charts for preschool children were published in 2004.12 This was followed by another more comprehensive study published in 2007.13 Although a L M S percentile reference for Saudi preschool children has recently been published,14 no Z-score tables or charts have been reported for this age group. In view of the importance of Z-score assessment of growth and nutrition for population studies and research, we reanalyzed the raw data collected in the previous nationally representative survey.13 Our objective was to produce reference Z-score tables and charts for Saudi preschool children.
SUBJECTS AND METHODS
A complete description of the design including data collection and analysis has been reported.13 The sample size was determined by a multistage random selection of a representative sample from each of the 13 administrative regions of Saudi Arabia. Data collection was performed by field teams including nurses and physicians during house visits. Only healthy children as determined by history and clinical examination were eligible for body measurement of weight, length or height, and head circumference. The length of children below 3 years of age was measured supine and the height of those above 3 was measured upright. Therefore, the terminology length/height will be used to cover the age range from birth to 60 months. The exact age at the time of growth measurement was calculated based on official documents in the form of a birth certificate or a family card indicating the date of birth on the Hijri calendar, subsequently converted to Gregorian dates to facilitate comparison with growth charts of other populations.
Statistical analysis
To calculate the standard deviations (−3 to +3) of weight, length/height, head circumference, weight for length/height and body mass index in boys and girls from birth to 60 months, the L, M, and S method was applied to synthesize the changing distribution of these anthropometric measurements during growth as a function of age. The L, M, and S parameters are the median (M), the generalized coefficient of variation (S), and the power in the Box-Cox transformation (L). This method uses the Box-Cox transformation to adjust the distribution of anthropometric data to a normal distribution by minimizing the effects of asymmetry. The L, M, and S method is to model the data, smooth the model parameters, and then estimate smoothed percentiles from the model parameters. The parameters L, M and S were calculated according to the method of maximum penalized likelihood.15–17 All anthropometric measures were estimated from those values applying the following formula:18
P= M [1 + LSZ] 1/L, L ≠ 0 where L, M, and S are the values from the appropriate table corresponding to the age in months of the child. P is the percentile and Z is the Z-score that corresponds to the percentile. Z-scores correspond exactly to percentiles.
We calculated the 0.2nd, 2.3rd, 16th, 50th, 84th, 97.7th, and 99.8th percentiles, which are equivalent to the Z-score values of −3, −2, −1, 0, +1, +2, +3 for the weight, length/height, head circumference, weight for length/height and body mass index in boys and girls from birth to 60 months. Data processing was performed using the LMS Chart Maker Light 2.1 (Medical Research Council, London, UK). The goodness of fit of our all LMS models was assessed by using the Q-test. The details of the use of the Q-test are part of the LMS model procedure as performed by the software. Further details on the use of the Q-test and comparison with other methods of assessment of goodness of fit have been published.19
RESULTS
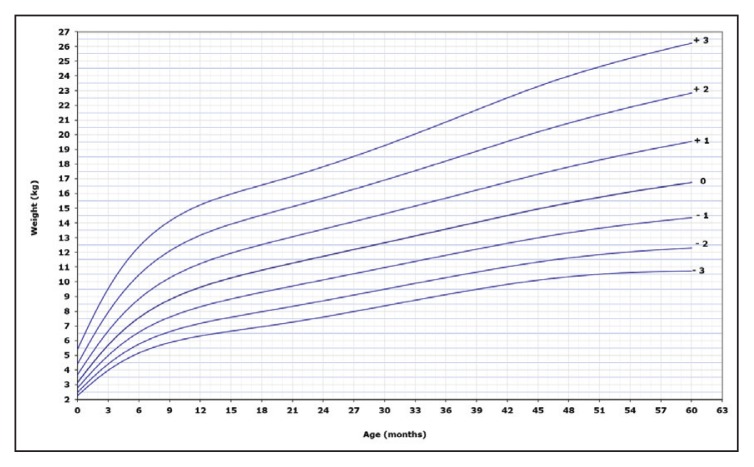
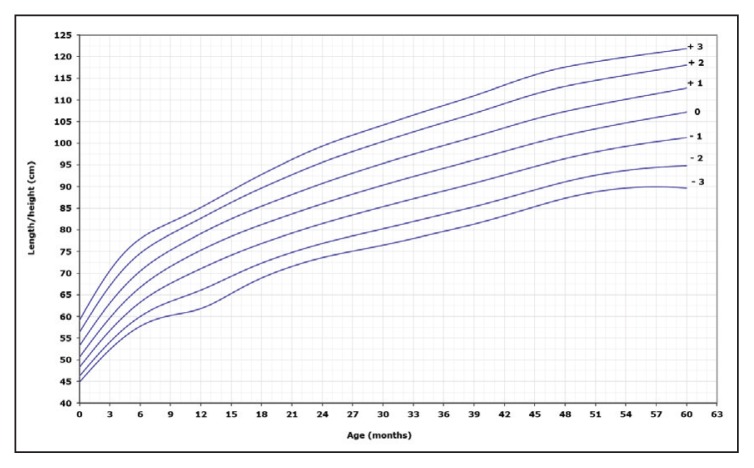
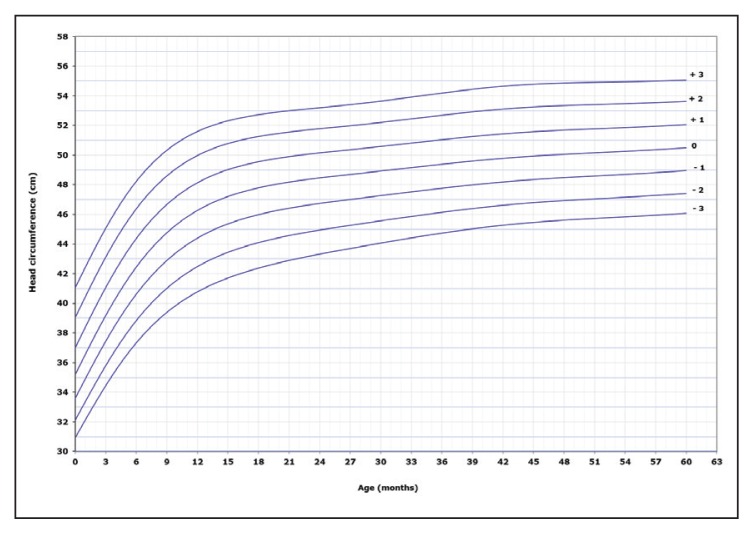
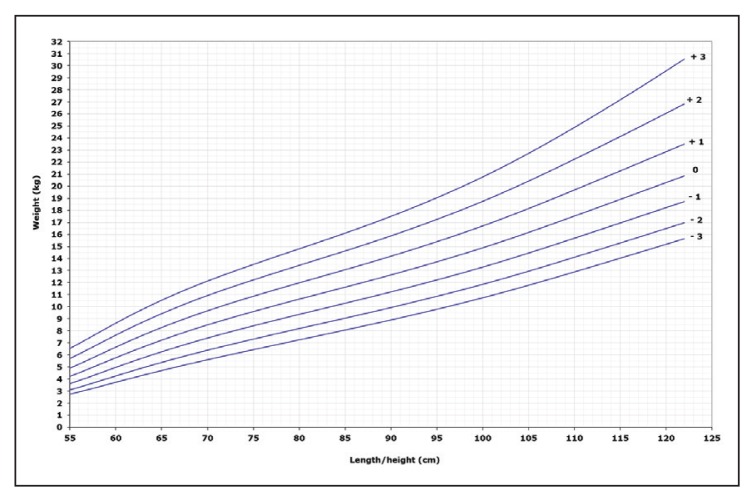
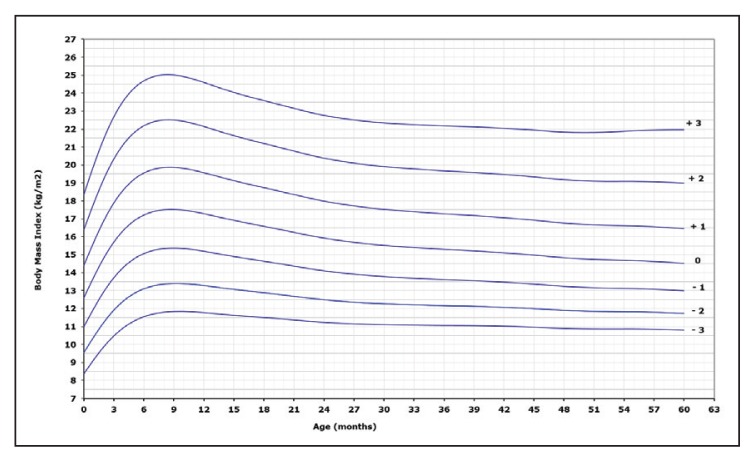
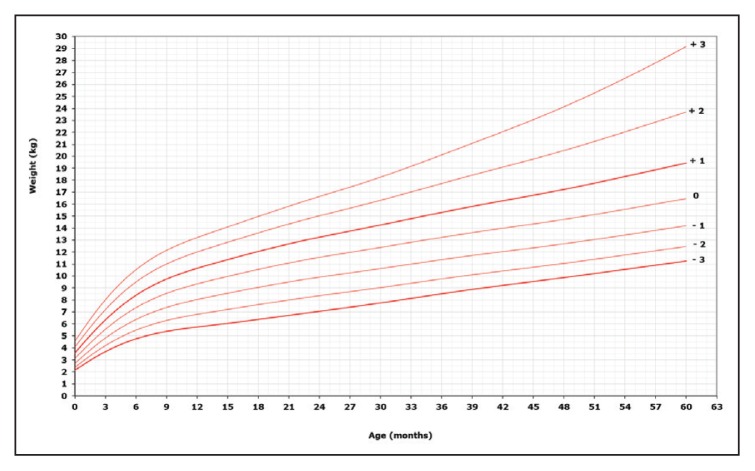
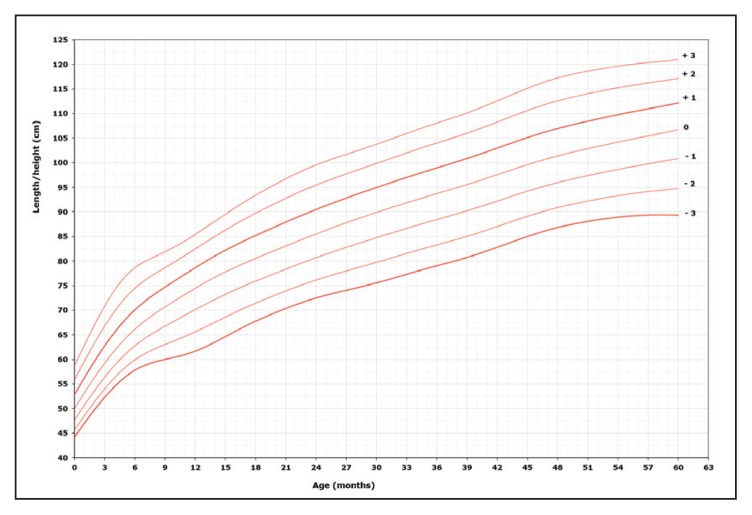
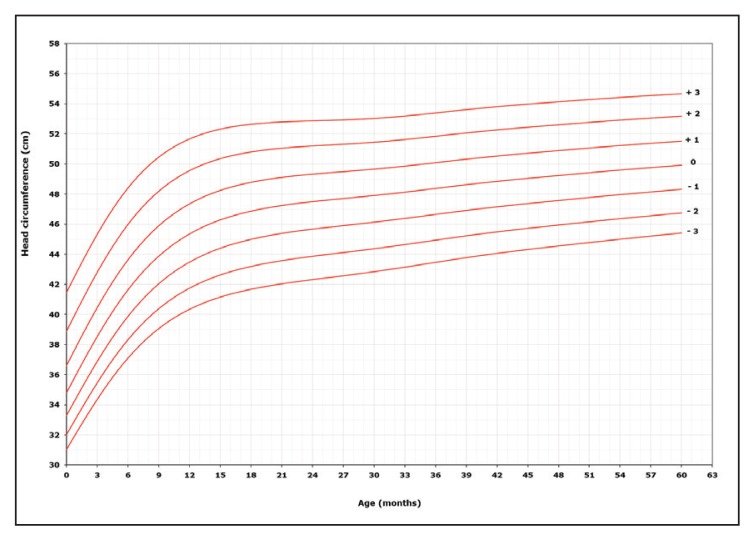
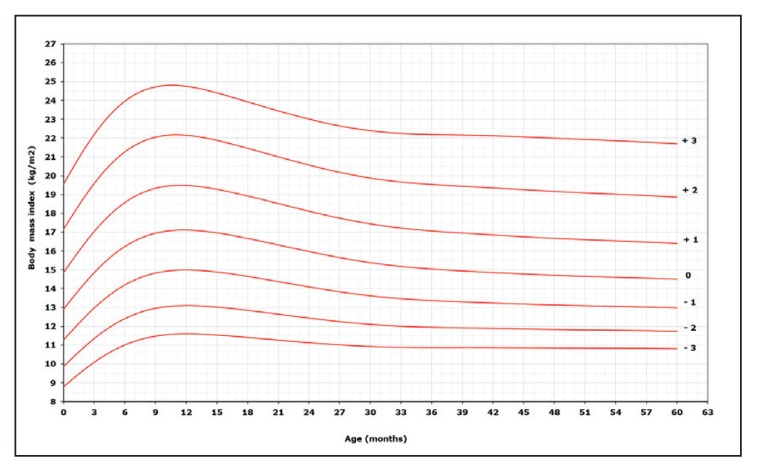
There were 15 601 Saudi children below 60 months (5 years) of age and 7896 (50.6 %) were boys. The L, M, and S parameters and Z-scores for weight for age, length/height for age, head circumference for age, weight for length/height and body mass index for age in boys are shown online in Appendices 1 to 5, respectively. Figures 1 to 5 show the corresponding graphs for Z-scores for weight for age, length/height for age, head circumference for age, weight for length/height and body mass index for age in boys.
Figure 1.
Weight for age, boys, 0–60 months ((https://goo.gl/2TZScq).
Figure 2.
Height for age, boys, 0–60 months. (https://goo.gl/2TZScq)
Figure 3.
Head circumference for age, boys, 0–60 months. (https://goo.gl/2TZScq)
Figure 4.
Weight for height, boys, 0–60 months. (https://goo.gl/2TZScq)
Figure 5.
Body mass index, boys, 0–60 months. (https://goo.gl/2TZScq)
The L, M, and S parameters and Z-scores for weight for age, length/height for age, head circumference for age, weight for length/height and body mass index for age in girls are shown in online Appendices 6 to 10, respectively. Figures 6 to 10 show the corresponding graph for Z-scores for weight for age, length/height for age, head circumference for age, weight for length/height and body mass index for age in girls.
Figure 6.
Weight for age, girls, 0–60 months. (https://goo.gl/2TZScq)
Figure 7.
Height for age, girls, 0–60 months. (https://goo.gl/2TZScq)
Figure 8.
Head circumference, girls, 0–60 months. (https://goo.gl/2TZScq)
Figure 9.
Weight for height, girls, 0–60 months. (https://goo.gl/2TZScq)
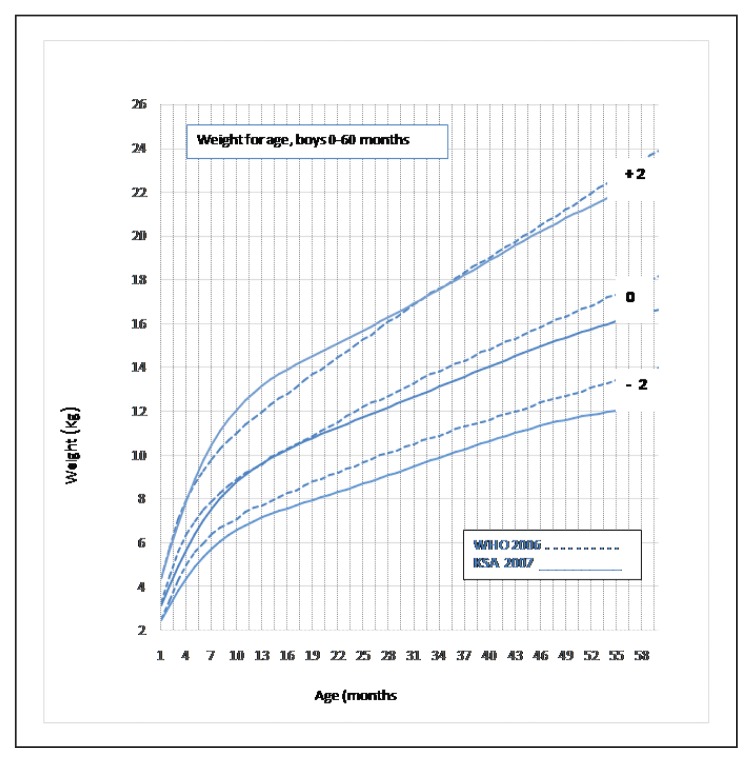
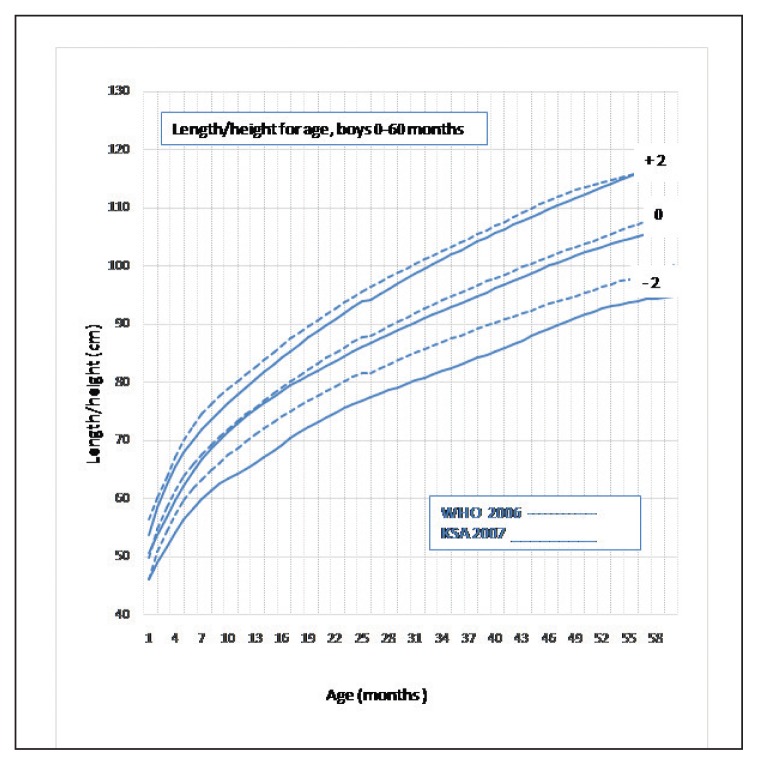
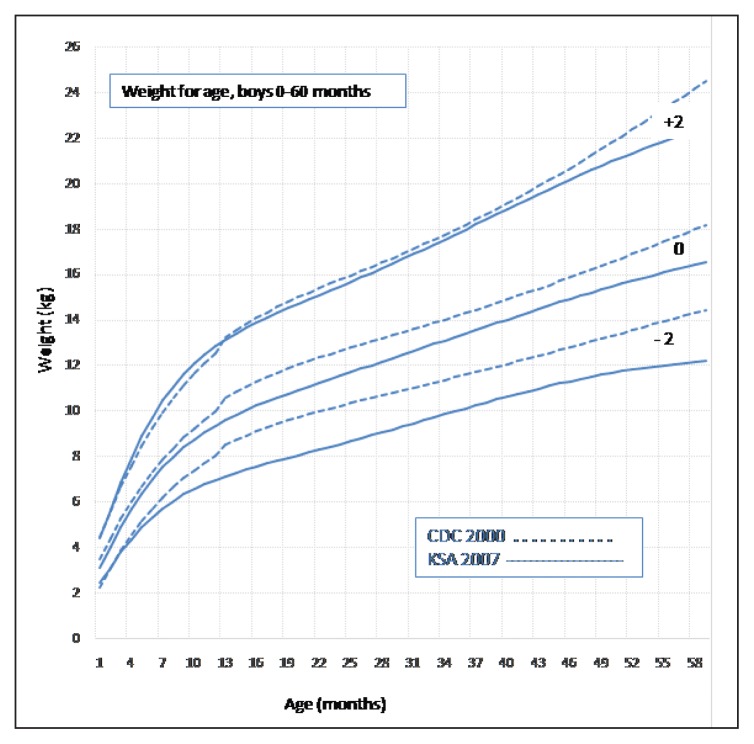
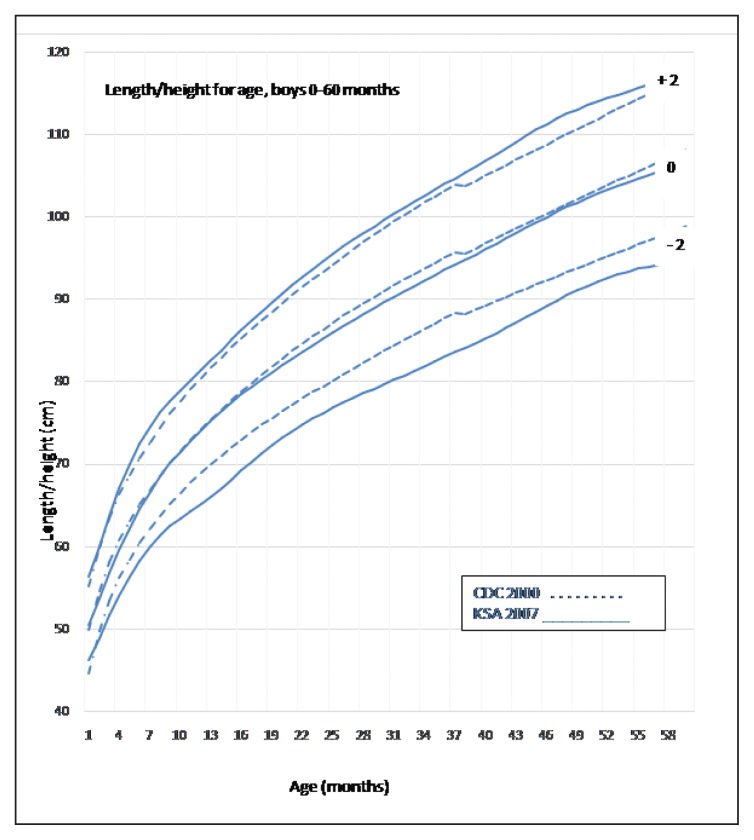
Comparison of the Saudi with the WHO Z-score standards was made for weight and length/height for age as detailed in online Appendices 11 and 12, respectively. Similarly, comparison with the CDC reference for weight and length/height for age is detailed in online Appendices 13 and 14, respectively. Figures 11 and 12 show the corresponding graphs for the WHO vs Saudi Arabia and Figures 13 and 14 show the corresponding graphs for the CDC vs Saudi Arabia.
Figure 11.
comparison of WHO and Saudi z-score reference for weight for age for boys. (https://goo.gl/2TZScq)
Figure 12.
Comparison of WHO and Saudi z-score reference for length/height for age for boys. (https://goo.gl/2TZScq)
Figure 13.
Comparison of CDC and Saudi z-score reference for weight for age for boys. (https://goo.gl/2TZScq)
Figure 14.
Comparison of CDC and Saudi z-score reference for length/height for age for boys. (https://goo.gl/2TZScq)
DISCUSSION
There are three methods available for comparison of the nutritional status of a child or group of children to a reference population: percentiles, percent of median, and Z-scores (standard deviation scores). The Z-score indicates how many standard deviations any value is from the mean. Therefore, a Z-score less than 0 represents a value less than the mean, a Z-score greater than 0 represents a value greater than the mean, and a Z-score equal to 0 represents a value equal to the mean. Similarly, a Z-score equal to 1 or 2 represent a value that is 1 and 2 standard deviations greater than the mean and a Z-score equal to −1 and −2 represent an element that is 1 and 2 standard deviations less than the mean.
At the individual level, during assessment of growth and nutrition in the clinical setting, the percentile method is commonly used because of its simplicity. However, the Z-score method is more accurate for individual and population-based assessment.20 In other words, the Z-score system is preferred in research settings and surveillance of nutritional status of groups of children.21
This report is the first national reference to describe the growth of normal Saudi preschool children, using the L, M, and S parameters, Z-score tables, and corresponding growth charts. In view of the well-known differences in growth in different populations, the availability of such a reference based on a nationally representative sample is important for more accurate estimation of the growth and nutritional status of Saudi children. This is supported by comparison with international growth charts, which indicate a downward displacement of the Saudi charts by −2 SD from that of the WHO and CDC charts. The consequence of this finding is considerably important clinically as plotting Saudi children in the WHO or CDC charts will classify Saudi children as failure to thrive, whereas they are normal when using the Saudi reference. At the population level, the use of WHO or CDC growth charts for Saudi children leads to overestimation of the prevalence of underweight and stunting. This conclusion is consistent with the results of previous studies that compared percentiles, demonstrating that the use of references based on data from other populations such as the WHO Child Growth Standards or CDC 2000, for Saudi children, overestimates the prevalence of nutritional disorders and may lead to overdiagnosis and unnecessary referrals.22–24 In addition, the availability of Z-score references for Saudi children makes it possible to use the WHO definitions to determine the prevalence of malnutrition in any group or population of Saudi children. These definitions include underweight (weight for age <−2 SD), wasting (weight for length/height <−2 SD), and stunting (length/height for age <−2 SD).
Body mass index (BMI) for the normal population of Saudi preschool children has not been reported. The availability of LMS parameters and Z-scores data allows the application of the recent WHO definitions of overweight (BMI >+1 SD), obesity (BMI >+2 SD), and thinness (BMI <−2 SD). In addition, the availability of LMS parameters and Z-scores data facilitates incorporation of growth charts in electronic medical records in clinics and hospitals in Saudi Arabia. Accordingly, it is highly recommended to use this national growth reference (LMS Z-scores) rather than references from other populations.
A limitation of the present data is that regional variations are not taken into consideration. In addition, data in this analysis was collected about 10 years ago, but they are still representative as significant secular trends in growth take more time. This conclusion is supported by the fact that the data for WHO standards were collected from 1997 to 2003 and the data sources for the CDC reference were collected from 1963 to 1994 and both references are still in common use.
In conclusion, the L, M, and S parameters and Z-scores for Saudi infants and children presented in this report provide a state-of-the-art, nationally representative reference essential for individual and population health care and research. The availability of this national reference Z-score for Saudi preschool children will facilitate more accurate assessment of nutritional status of Saudi children under different clinical conditions rather than using references from other populations.
Supplementary Information
Figure 10.
Body mass index for age, girls, 0–60 months. (https://goo.gl/2TZScq)
Acknowledgments
The authors extend their appreciations to the Deanship of Scientific Research at King Saud University for funding this work through Research Group No. RGP-1436-007.
REFERENCES
- 1.Cole TJ. The development of growth references and growth charts. Ann Hum Biol. 2012;39:382–394. doi: 10.3109/03014460.2012.694475. [DOI] [PMC free article] [PubMed] [Google Scholar]
- 2.Kuczmarski RJ, Ogden CL, Guo SS, Grummer-Strawn LM, Flegal KM, Mei Z, et al. 2000 CDC Growth Charts for the United States: methods and development. Vital Health Stat. 2002;246:1–190. [PubMed] [Google Scholar]
- 3.Mercedes DO, Onyango A, Borghi E, Siyam A, Pinol A. The WHO Child Growth Standard: Methods and development. Department of Nutrition for Health and Development; Geneva, Switzerland: WHO; 2006. [Google Scholar]
- 4.Freedman DS, Khan LK, Serdula MK, Ogden CL, Dietz WH. Racial and ethnic differences in secular trends for childhood BMI, weight, and height. Obesity. 2006;14:301–308. doi: 10.1038/oby.2006.39. [DOI] [PubMed] [Google Scholar]
- 5.Deaton A. Height, health, and development. Proc Natl Acad Sci. 2007;104:13232–13237. doi: 10.1073/pnas.0611500104. [DOI] [PMC free article] [PubMed] [Google Scholar]
- 6.Wright CM, Booth IW, Buckler JM, Cameron N, Cole TJ, Healy MJ, et al. Growth reference charts for use in the United Kingdom. Arch Dis Child. 2002;86:11–14. doi: 10.1136/adc.86.1.11. [DOI] [PMC free article] [PubMed] [Google Scholar]
- 7.Tinggaard J, Aksglaede L, Sørensen K, Mouritsen A, Wohlfahrt-Veje C, Hagen CP, et al. The 2014 Danish references from birth to 20 years for height, weight and body mass index. Acta Pædiatrica. 2014;103:214–224. doi: 10.1111/apa.12468. [DOI] [PubMed] [Google Scholar]
- 8.Scherdel P, Botton J, Rolland-Cachera MF, Léger J, Pelé F, Ancel PY, et al. Should the WHO Growth Charts Be Used in France? PLoS One. 2015;10(3):e0120806. doi: 10.1371/journal.pone.0120806. [DOI] [PMC free article] [PubMed] [Google Scholar]
- 9.Bong Y, Shariff AA, Mohamed AM, Merican AF. Malaysian growth centiles for children under six years old. Ann Hum Biol. 2015;42:108–115. doi: 10.3109/03014460.2014.912679. [DOI] [PubMed] [Google Scholar]
- 10.Payande A, Tabesh H, Shakeri MT, Saki A, Safarian M. Growth Curves of Preschool Children in the Northeast of Iran: A Population-Based Study Using Quantile Regression Approach. Global Journal of Health Science. 2013;5:9–15. doi: 10.5539/gjhs.v5n3p9. [DOI] [PMC free article] [PubMed] [Google Scholar]
- 11.Zong XN, Li H. Construction of a New Growth References for China Based on Urban Chinese Children: Comparison with the WHO Growth Standards. PLOS ONE. 2013;8(3):e59569. doi: 10.1371/journal.pone.0059569. [DOI] [PMC free article] [PubMed] [Google Scholar]
- 12.Al-Amoud MM, Al-Mazrou YY, El-Gizouli SE, Khoja TA, Al-Turki KA. Clinical growth charts for preschool children. Saudi Med J. 2004;25:1679–1682. [PubMed] [Google Scholar]
- 13.El Mouzan MI, Al-Herbish AS, Al-Salloum AA, Qurachi MM, Al-Omar AA. Growth charts for Saudi children and adolescents. Saudi Med J. 2007;28:1555–1568. [PubMed] [Google Scholar]
- 14.Shaik SA, El Mouzan MI, AlSalloum AA, AlHerbish AS. Growth reference for Saudi preschool children: LMS parameters and percentiles. Ann Saudi Med. 2016;36:2–6. doi: 10.5144/0256-4947.2016.2. [DOI] [PMC free article] [PubMed] [Google Scholar]
- 15.Cole TJ, Freeman JV, Preece MA. British 1990 growth reference centiles for weight, height, body mass index and head circumference fitted by maximum penalized likelihood. Stat Med. 1998;17:407–429. [PubMed] [Google Scholar]
- 16.Rigby RA, Stasinopoulos DM. Generalized additive models for location, scale and shape. Appl Stat. 2005;64:507–554. [Google Scholar]
- 17.Cole TJ, Green PJ. Smoothing reference percentile: The LMS method and penalized likelihood. Stat Med. 1992;11:1305–1319. doi: 10.1002/sim.4780111005. [DOI] [PubMed] [Google Scholar]
- 18.Cole TJ. The British, American NCHS, and Dutch weight standards compared using the LMS method. Am J Hum Biol. 1989;1:397–408. doi: 10.1002/ajhb.1310010402. [DOI] [PubMed] [Google Scholar]
- 19.Pan H, Cole TJ. A comparison of goodness of fit tests for age-related reference ranges. Statist Med. 2004;23:1749–65. doi: 10.1002/sim.1692. [DOI] [PubMed] [Google Scholar]
- 20.Report of a WHO Expert Committee. Geneva: World Health Organization; 1995. Physical status: the use and interpretation of anthropometry. (WHO Technical Report Series No. 854). [PubMed] [Google Scholar]
- 21.WHO Working Group on Infant Growth: The use and interpretation of anthropometry in infants. Bull World Health Org. 1995;73:165–174. [PMC free article] [PubMed] [Google Scholar]
- 22.Al-Mazrou YY, Al-Amoud MM, El-Gizouli SE, Khoja TA, Al-Turki KA, Tantawi NE, et al. Comparison of the growth standards between Saudi and American children aged 0–5 years. Saudi Med J. 2003;24:598–602. [PubMed] [Google Scholar]
- 23.El Mouzan MI, Al-Herbish AS, Al-Salloum AA, Foster PJ, Al-Omar AA, Qurachi MM, et al. Comparison of the 2005 growth charts for Saudi children and adolescents to the 2000 CDC growth charts. Ann Saudi Med. 2008;28:334–340. doi: 10.5144/0256-4947.2008.334. [DOI] [PMC free article] [PubMed] [Google Scholar]
- 24.El Mouzan MI, Foster PJ, Al-Herbish AS, Al-Salloum AA, Al-Omar AA, Qurachi MM, et al. The implication of using the World Health Organization Child Growth Standards in Saudi Arabia. Nutrition Today. 2009;44:62–70. [Google Scholar]
Associated Data
This section collects any data citations, data availability statements, or supplementary materials included in this article.


