

Summary
Cerebral cortex in mammals contains a mosaic of cortical areas that differ in function, architecture, connectivity, and/or topographic organization. A combination of local connectivity (within-area microcircuitry) and long-distance (between-area) connectivity enables each area to perform a unique set of computations. Some areas also have characteristic within-area mesoscale organization, reflecting specialized representations of distinct types of information. Cortical areas interact with one another to form functional networks that mediate behavior, and each area may be a part of multiple, partially overlapping networks. Given their importance to understanding brain organization, mapping cortical areas across species is a major objective of systems neuroscience and has been a century-long challenge. Here we review recent progress in multi-modal mapping of mouse and nonhuman primate cortex, mainly using invasive experimental methods. These studies also provide a neuroanatomical foundation for mapping human cerebral cortex using non-invasive neuroimaging, including a new map of human cortical areas that we generated using a semi-automated analysis of high quality multi-modal neuroimaging data. We contrast our semi-automated approach to human multi-modal cortical mapping with various extant fully automated human brain parcellations that are based on only a single imaging modality, and offer suggestions on how to best advance the non-invasive brain parcellation field. We discuss the limitations as well as strengths of current non-invasive methods of mapping brain function, architecture, connectivity, and topography and of current approaches to mapping the brain’s functional networks.
eTOC Blurb
Van Essen and Glasser review recent progress in subdividing cerebral cortex in mice and monkeys and explain how this work laid the foundation for a new multimodal human cortical map based on MRI data from the Human Connectome Project.
Introduction
The cerebral cortex is the dominant structure of the mammalian brain and is largely responsible for a diverse range of functions related to sensory perception, volitional movements, cognition, memory, and emotion. In humans, it mediates human-specific behaviors such as language, tool use, and abstract thought. This functional diversity is all the more remarkable given the relative uniformity of cortical structure, especially for the neocortex, its dominant subdivision. The neocortex is a sheet-like layered structure (6 layers in most areas) whose thickness varies across regions but on average is 2.6 mm in humans (Glasser et al., 2016b), 2.0 mm in macaque monkeys (Donahue et al., 2018) and 0.89 mm in mice (Lerch et al., 2008). Other key features of cerebral cortex include enormous species differences in the complexity of cortical convolutions as well as in surface area, which ranges from 920 cm2 per hemisphere in humans and 96 cm2 in the macaque (Donahue et al., 2018) to 0.84 cm2 in mice (Herculano-Houzel et al., 2013). These differences largely underlie the differences in cognitive abilities across species and lead to basic questions of how species differ in number of cortical areas and in their organization and function.
Lesion studies in the 19th century by Broca, Wernicke, and Lichtheim provided early evidence for regional functional specialization of human language (reviewed (Geschwind, 1974)), leading classical anatomists to attempt to map distinct cortical areas that might be associated with specific functions. The most famous such parcellation (but not necessarily the most accurate) was by Brodmann (1909), who identified 47 areas in humans based on cytoarchitectonics – that is, the density, size, and laminar distribution of neuronal cell bodies. Many other human cortical parcellation schemes were proposed early in the 20th century, including a 107-area cytoarchitectonic parcellation (von Economo and Koskinos, 1925) and another with about 200 areas as delineated by Cécile and Oskar Vogt based on myeloarchitectonics – that is, the density, orientation, and laminar distribution of myelinated axons (Vogt, 1919; Nieuwenhuys et al., 2015) This diversity of maps began a century-old field of research to more accurately, comprehensively, and objectively delineate human cortical areas, which is the central focus of this review.
To develop a more informed perspective on non-invasive human parcellation, we first consider parcellation of cerebral cortex in several intensively studied model species. We start with the mouse, where recent progress has provided a parcellation that is arguably the most accurate for any species and that reveals several general principles of areal organization. We then discuss New World and Old World monkeys, including the macaque, where key methodological as well as conceptual groundwork was laid for modern cortical parcellations. We then focus on parcellation of human cortex, which has been studied using a wide range of MRI-based in vivo methods as well as postmortem architectonic approaches, but where we face unique challenges given the more limited experimental methods available and the complexities of human cortical neuroanatomy. In particular, human brains prove more challenging to compare across individuals because of the variability in cortical folding patterns and in locations of areas relative to these folds (Amunts et al., 2000; Glasser et al., 2016b; Coalson et al., 2018). Nonetheless, recent advances in tackling these challenges resulted in a 180-area per hemisphere multimodal parcellation (Glasser et al., 2016a) generated using a semi-automated algorithmic approach based on data from the Human Connectome Project (HCP) (Van Essen et al., 2013). A variety of unimodal parcellations have also been reported in humans, but we discuss how indirect, non-invasive measures of brain function or connectivity can be problematic when used in isolation to infer cortical areal borders, especially with fully automated, unsupervised methods. Finally, we consider the relationship between cortical areas and functional networks and suggest that specific behaviors reflect particular sets of cortical areas engaging in specific computations as a part of functional networks.
What is a cortical area?
Because definitions vary, it is useful to begin by stating what we mean by a cortical area, as adapted from earlier definitions (Van Essen and Maunsell, 1983; Van Essen, 1985; Felleman and Van Essen, 1991; Glasser et al., 2016a); A cortical area is a distinctive region of cortex that differs reliably from neighboring areas in one or more neurobiological properties from four basic categories: function, architecture, connectivity, and/or topographic organization. As shorthand, we will sometimes refer to these as the “FACT” categories. A cortical area represents a fundamental organizational unit, but is one of many levels of brain organization (Churchland and Sejnowski, 1988); (Nassi and Calllaway, 2009). Applying this definition in practice brings up many specific issues that differ across cortical areas and across species. These include examples of incomplete topographic maps within an area and of internal heterogeneity in function, architecture, or connectivity that in some cases provide evidence for distinct subareas or repeating modules within areas. Despite these complexities (and sometimes differing interpretations), we contend that the notion of cortical areas remains central to progress in deciphering cortical function
How is mammalian cortex organized and connected?
The following six principles of mammalian cortical organization were first articulated for the macaque, but apply to the mouse as well and may be general to mammalian neocortex, including humans. 1) Neocortex contains a large number of cortical areas distinguishable using the FACT categories. 2) Some areas have internal heterogeneity, containing distinct ‘subareas’ or repeating internal modules 3) Most sensory and motor areas contain complete maps of their corresponding sensory surface (e.g., contralateral visual hemifield) but some maps may be incomplete. 4) Cortical areas are densely and reciprocally interconnected, with a weight profile that follows a lognormal distribution. 5) Cortical areas can be arranged in a distributed hierarchy based on laminar differences between forward vs feedback connections. 6). Sensory systems contain multiple cortical processing streams that process different types of information and use this information for different behavioral tasks. We focus on the first two principles and touch upon the others to varying degrees in the main text and further in several SI sections.
Parcellation and connectivity of mouse cortex.
In discussing specific parcellations, we begin with the mouse because its cortical organization is relatively simple, and it has recently been carefully mapped. The smooth mouse neocortex can be physically flattened, then viewed in tangential sections (Wang and Burkhalter, 2007) using multiple markers for architecture and cortico-cortical connectivity. Figure 1A shows a recent parcellation that includes 41 areas of neocortex and transitional cortex (periallocortex), overlaid on a map of parvalbumin (PV) positive inhibitory interneurons (Gămănut et al., 2018). Twenty-five areas were mapped based on the PV expression pattern; the remaining areas were identified using other architectonic markers (see Figure legend) plus information about topographic organization and connectivity.
Figure 1.

A. A parcellation of mouse cortex containing 41 cortical areas and including seven subareas of primary somatosensory (SSp): barrel field [SSp-bfd], nose and mouth [SSp-nm], lower jaw [SSp-lj], upper limb [SSp-ul], lower limb [SSp-ll], trunk [SSp-tr], and unassigned [SSp-un] (Gămănut et al., 2018). The illustrated section shows genetically encoded fluorescent “tdTomato” labeling in parvalbumin expressing interneurons (PVtdT). Other architectonic markers used for this parcellation include cytochrome oxidase (CO), M2 muscarinic acetylcholine receptor, and vesicular glutamate transporter VGluT2. B. Visuotopic organization of 9 extrastriate visual areas revealed by triple-color anterograde tracer injections (Wang and Burkhalter, 2007). A slightly different parcellation for mouse visuotopic areas was reported by (Garrett et al., 2014) using intrinsic optical imaging. C. A 19 × 47 area+subarea quantitative connectivity matrix based on retrograde tracers injected into 18 areas, with two sub-areas for SSp, (Gămănut et al., 2018). Green entries indicate the injected area. Reproduced with permission from Wang and Burkhalter, 2007 and Gămănut et al., 2018.
Consistent with the importance of tactile information in the mouse, its largest cortical area is the primary somatosensory cortex (SSp, S1) in the center of Figure 1A. SSp is distinguished by all four FACT categories, which we present here and below in order of the clarity or incisiveness of the evidence but preface with lettered abbreviations. (T) It contains a complete, topographically organized map of the contralateral body surface as charted neurophysiologically, with an expanded representation of the nasal vibrissae (whiskers) (Watson et al., 2012; Ebner and Kaas, 2015) (A) It has a distinctive cellular architecture (e.g., a “granular” layer 4 containing small, densely packed neurons (Paxinos and Franklin, 2008). (F) Its neurons have distinctive receptive fields and response properties, most intensively studied for the vibrissal representation (reviewed Petersen, 2007). (C) It has distinctive connections with subcortical nuclei and with other cortical areas, particularly the secondary somatosensory cortex (SSs) and primary motor cortex (reviewed Aronov et al., 2010). However, it also has striking internal inhomogeneity, most notably the distinctive ‘barrel field’ (SSp-bfd) that represents each vibrissa (large whisker) as a distinct ‘barrel’ (Woolsey and Van der Loos, 1970). Altogether, seven architectonically distinct subareas (Figure 1A), each representing a different body part, are discernible in tangentially sliced histochemical sections (Gămănut et al., 2018)
Visual cortex in the mouse lies posterior and medial to SSp (down in Figure 1A). It includes a large primary visual cortex (V1, area 17) surrounded by a belt of higher visual areas. Like SSp, V1 is distinguishable from neighboring areas by each of the FACT categories. (A) Its distinctive architectonic features include heavy myelination and high PV labeling (Figure 1A). (T) It contains an orderly retinotopic map1 of the contralateral visual hemifield as assessed anatomically and physiologically. (C) It receives visuotopically precise projections from the lateral geniculate nucleus (LGN) and has many other distinctive connections. (F) Its receptive field properties include a high incidence of orientation and direction selectivity that to some degree are inherited from their subcortical inputs (see Glickfield and Olsen, 2017; Seabrook et al., 2018). In contrast to primate V1 (see below), orientation selectivity lacks columnar organization, yet there is evidence for repeating modular patterns in superficial layers of V1 based on anatomical and neurophysiological data (Ji et al., 2015).
A longstanding debate over whether mouse area V1 is surrounded by few or many visual areas has been resolved in favor of the latter using neurophysiological receptive field mapping, multicolor anterograde tracers in V1, and in vivo optical imaging (see Glickstein and Olsen, 2017; Laramee and Boire, 2015; Seabrook et al., 2017). Figure 1B shows nine retinotopically organized extrastriate visual areas (Wang and Burkhalter, 2007), which have been largely confirmed and further characterized by others (Marshel et al., 2011; Garrett et al., 2014; Glickfield and Olsen, 2017) Some of these areas are less than 1 mm across in both dimensions, i.e., comparable to average cortical thickness (0.89 mm, see above). Importantly, several higher visual areas have biased or incomplete representations of the contralateral visual hemifield (Garrett et al., 2014).
Not all mouse cortical areas are like V1 and SSp in being distinguishable from all neighbors by each of the four FACT categories. For example, some higher visual areas are well-defined by criteria of topographic organization and connectivity, but as yet cannot be fully delineated using existing architectonic or functional markers even though they reveal some differences between areas. Still others have been primarily identified based on architectonic criteria and may be revised by future multimodal analyses. Note also that the mouse Common Coordinate Framework (CCF) atlas from the Allen Institute (help.brain-map.org/download/attachments/2818171/MouseCCF.pdf) is similar but not identical to the pan-hemispheric parcellation shown in Figure 1A (Gămănut et al., 2018).
Analyses of cortico-cortical connectivity reveal several important principles meriting brief discussion. Anterograde tracers injected into 10 mouse visual areas show that each area projects to dozens of other cortical areas (Wang et al., 2012). The estimated ‘weight’ of connections2 for each area varies over several orders of magnitude (inferred from the optical density of anterograde label, representing mainly axon terminals), and the connectivity weight profile conforms to a lognormal distribution that is distinct for each injected area. Figure 1C shows a 19 × 47 connectivity matrix (fraction of retrogradely labeled neurons extrinsic to the injected area in which 97% of all pathways that could exist actually do exist (Gămănut et al., 2018), indicating an ‘ultra-dense’ connectivity exceeding that in other recent studies (Oh et al., 2014; Zingg et al., 2014; Ypma and Bullmore, 2016) The high graph density and enormous range of connection strengths highlights the importance of quantifying connection weights rather than just analyzing binary connectivity graphs. Pathways linking nearby areas tend to be strongest, whereas long-distance connections tend to be sparser. Sparse connections arguably might have special functional significance, e.g., as an ‘early warning’ line of communication (cf. (Markov et al., 2012; Goulas et al., 2015)) or to promote complex network dynamics. (Betzel and Bassett, 2018). A plausible ‘devil’s advocate’ alternative is that they are of minimal functional significance and instead represent stochastic wiring errors during the processes of axonal pathfinding and subsequent pruning of connections (Innocenti and Price, 2005).
Connectivity patterns in the mouse also reveal evidence for hierarchical organization based on the laminar differences between feedforward and feedback pathways (D’Souza et al., 2016; Betzel and Bassett, 2018; Harris et al., 2018) that are analogous to those in the macaque but different in many specifics (see SI section 2.2). Also, mouse visual areas are organized into ‘dorsal’ and ‘ventral’ processing streams based on connectivity profiles (Wang et al., 2011; Wang et al., 2012).
Parcellation and connectivity of monkey cortex.
We first consider three notably well-defined visual areas, V1, V2, and MT, followed by early somatosensory areas, additional extrastriate visual areas, and finally an overview of pan-hemispheric monkey cortical parcellations. Many of these studies have benefited from methods for ‘surface-based’ visualization and analysis of the convoluted cerebral cortex using manual methods of generating cortical “flat maps” in the early days and computerized methods in recent decades (see (Van Essen, 2012; Van Essen, 2013) and SI Section 1)
Area V1 – a quintessential ‘poster child’ area.
Primary visual cortex (a.k.a. area 17, OC, V1, and striate cortex) is the largest cortical area (11 % of macaque neocortex; Donahue et al., 2018), consistent with the importance of visual information to primates but shows two-fold variability in surface area across individuals (Van Essen et al., 1984). (A) V1 has a unique laminar architecture, with complex sublayers of layer 4 (Callaway, 1998) that include the heavily myelinated stria of Gennari (layer 4B). The V1 boundary is razor sharp3 when visualized by cytoarchitecture, myeloarchitecture, and ‘chemoarchitectonic’ methods such as cytochrome oxidase histochemistry (Horton and Hubel, 1981). (T) V1 contains a precise retinotopic (visuotopic) map of the contralateral visual field in each hemisphere (Daniel and Whitteridge, 1961; Van Essen et al., 1984). (F) Many V1 neurons have emergent “classical” receptive field properties, including selectivity for orientation, direction of motion, color, and/or binocular disparity (stereoscopic depth). (C) These arise from highly specific local connections (microcircuitry) plus “non-classical” receptive field surrounds presumably mediated by longer-distance tangential connections and feedback from higher visual areas (REF reviews - Nassi and Callaway, 2009?).
Modularity within V1 is manifested by ocular dominance stripes, sharpest in layer 4C - the main target of LGN projections (LeVay et al., 1985), by cytochrome-oxidase (CO) ‘blobs’ and ‘interblobs’ (see (Sincich and Horton, 2005; Nassi and Callaway, 2009), and by radially oriented orientation columns (Hubel and Wiesel, 1974). Altogether, V1 contains about 1,000 modules (‘hypercolumns’) per hemisphere (Hubel and Wiesel, 1977)). Each module is about 1 mm across and includes a pair of ocular dominance stripes, a pair of CO blobs and associated interblobs, and a full set of orientation columns. The ×2 × 10⁵ neurons within a module analyze local features within a small patch of the visual field with a granularity dictated by the receptive field sizes of the LGN inputs (which increase progressively with eccentricity – distance from the center of gaze). V1 is connected with 25 cortical areas (Markov et al., 2011), including strong bidirectional, retinotopic connections with area V2 (Van Essen et al., 1986), and with many subcortical nuclei (see (Peters and Rockland, 2013)). Importantly, some pathways show heterogeneity in connection weights across V1, such as inputs from auditory cortex to peripheral V1 but not to central V1 (Falchier et al., 2002).
Area V2 – a reflected visuotopic map.
In contrast to the many areas surrounding V1 in the mouse, in primates area V2 adjoins nearly all of V1 except along the representation of the far periphery, where the small prostriate area directly abuts V1 (Morecraft et al., 2000). (A) V2 has a standard 6-layer neocortical cytoarchitecture; its outer border with neighboring extrastriate areas is subtle by conventional cytoarchitecture (except where it adjoins prostriate cortex). Macaque area V2 is nearly as large as V1 {Olavarria et al., 1997) and is approximately co-extensive with area OB (Bonin and Bailey, 1947) but not with Brodmann’s area 18 (unlike in humans)4. (T) In retinotopic organization, V2 shares a representation of the vertical meridian with V1 (inferior meridian dorsally and superior meridian ventrally). Progressing across the V1/V2 border neuronal receptive fields reverse in sign (towards the vertical meridian, then away from it) (Sereno et al., 1994; Sereno et al., 1995); such sign reversals are useful indicators for other visual area boundaries, including the anterior border of V2, which has a split representation of the horizontal meridian (Cragg, 1969; Zeki, 1969; (Allman and Kaas, 1974). (F) Receptive fields in V2 are on average two-fold larger than V1 in linear dimensions (Gattass et al., 1981), consistent with the modest convergence in the anatomical projection from V1 to V2 (Van Essen et al., 1986). V2 neurons preserve many types of stimulus selectivity observed in area V1 but can also show properties that are emergent or more prevalent, such as dual-orientation selectivity (Anzai et al. 2007), texture selectivity (Ziemba et al., 201)6 and ‘border ownership’ (Zhou et al., 2000). (C) The interareal connectivity profile of V2 compared to V1 is qualitatively similar but quantitatively different (e.g. V2 is more strongly connected to V3, whereas V1 is more strongly connected to LGN) (Markov et al., 2011). Importantly, the projections of peripheral vs central representations of V2 differ markedly, with the periphery more strongly connected with parietal cortex and the central representation more strongly connected with temporal cortex (Ungerleider and Desimone, 1986a; Ungerleider and Desimone, 1986b).
The modularity of V2 is evident in tangential sections stained for CO or Cat-301 immunoreactivity (Livingstone and Hubel, 1984b; Livingstone and Hubel, 1984a; Olavarria and Van Essen, 1997) but can also be mapped using functional MRI and myelin-sensitive MRI (Li et al., 2017). Like V1, V2 has a repeating modular organization, but with striking differences: V2 modules are stripe-like, with a repeat cycle of ×4 mm for a full set (a thick stripe, thin stripe, and two interstripes), indicating a much coarser periodicity than the ×1 mm module size of V1; also, dorsal and ventral V2 are not simple mirror images of one another, insofar as their stripe trajectories differ markedly (Olavarria and Van Essen, 1997).
Area MT – an extrastriate poster child, of sorts.
Beyond area V2 lies a mosaic of smaller extrastriate visual areas that were progressively revealed starting in the early 1970’s, supplanting the notion that V1 and V2 are surrounded by a third concentric ring - area 19 (Brodmann, 1905) or OA (Bonin and Bailey, 1947). The best defined and most intensively studied of these higher visual areas is the Middle Temporal area (MT), also known as area V5 (Zeki, 2004) and overlapping with cytoarchitectonic area OAa (Seltzer and Pandya, 1978). In the macaque, MT is a small visual area, about 3% of the surface area of V1 (Maunsell and Van Essen, 1987), though its exact location and extent is still debated (see SI Section 1.3). MT is distinct by all four FACT categories. (A) It is heavily myelinated, which contrasts strongly with more lateral areas but less so with the MST complex more medially (Van Essen et al., 1981). (C) It receives a direct input from layer 4B of V1 and has other distinctive inputs and outputs (Maunsell and Van Essen, 1983). (T) It has a map of the contralateral visual hemifield, albeit somewhat disorderly and with a bias for the lower visual quadrant (Maunsell and Van Essen, 1987). (F) It has a very high incidence of direction selective neurons) (Zeki, 1974; Van Essen et al., 1981). The functional specialization of MT has been further explored by chemical lesion, and electrical stimulation experiments that implicate MT in motion perception, stereoscopic depth perception, and pursuit eye movements (Newsome et al., 1985; Newsome and Pare, 1988; Salzman et al., 1992; DeAngelis et al., 1998). SI Section 1 discusses additional aspects of area MT, including challenges in mapping its location and extent accurately, comparing it across individuals in the macaque, and comparing its organization across species, where there is strong evidence for evolutionary homology across primates despite some interspecies differences.
Somatosensory and motor areas.
Somatosensory cortex illustrates additional general principles of cortical areal organization in monkeys (Kaas, 1983; Kaas, 2013). Brodmann identified area 3 as a strip of granular cortex (cell dense layer 4) in the posterior bank of the central sulcus that was later shown to be primary somatosensory cortex (Woolsey, 1958) and is now recognized to include distinct architectonic areas 3a and 3b. In contrast to visual cortex, which maps a two-dimensional visual field onto the cortical sheet via smooth gradations in cortical magnification, primate somatosensory cortex maps a highly irregular body surface, with large variations in the density of sensory receptors, onto a smooth cortical sheet (e.g., see classic images of the homunculus). Area 3b (S1) has a precise map of cutaneous receptors for the contralateral body surface that includes sharp topographic discontinuities (e.g., between face and hand representations and between adjacent digit representations discernible even in myelin stains (Jain et al., 1998)). Area 3b is highly elongated - only a few mm wide but 10-fold longer, extending the length of the central sulcus and onto the medial aspect of the hemisphere (Nelson et al., 1980). Adjacent somatosensory areas include area 3a anteriorly (representing proprioceptive inputs, including muscle spindles), and areas 1 and 2 posteriorly, each representing the body surface (or musculature) with a coarser-grained mapping than in 3b (analogous to the progressive increase of receptive field sizes across visual areas). Thus, similar body parts are represented side by side in four distinct somatosensory areas that are also approximately aligned with the body parts represented in primary motor cortex (area 4) (Jones et al., 1978; Nelson et al., 1980). Area 3b is reciprocally interconnected with somatosensory areas 1 and 2 posteriorly; area 4 is reciprocally connected with corresponding somatotopic subregions of areas 3a, 1,2, and 5, but less so with area 3b (Jones et al., 1978) (Markov et al., 2014). Despite their anisotropic overall shape, connectional heterogeneity, and some internal architectonic heterogeneity (Jones et al., 1978; Jain et al., 1998), areas 3a, 3b, 1, 2, and 4 are each appropriately considered distinct cortical areas distinguishable by architecture, functional characteristics, connectivity, and a complete somatotopic map of the contralateral body surface or skeletal musculature. As in the mouse, these areas have architectonic inhomogeneities, including the aforementioned myelin discontinuities between body parts in somatosensory cortex plus a size gradient for layer 5 Betz cells in (human) area 4, which are larger medially (long projections to lumbar spinal cord subserving the lower limb) than laterally (short projections to trigeminal nuclei subserving the face (Lassek, 1940; Rivara et al., 2003)).
Other extrastriate visual areas in New World and Old World monkeys.
Besides areas V1, V2, and MT discussed above, approximately half of occipital, parietal, and temporal cortex in monkeys is visually responsive (Felleman and Van Essen, 1991), and most of this expanse shows visuotopic organization. However, despite intensive study, a complete, consensus map of higher visual areas has yet to be attained for any non-human primate. The reasons include methodological limitations, inherent complexity in what constitutes a visuotopic area, individual variability in visuotopic organization, and small sample sizes.
Some of these complexities become evident in considering cortex immediately anterior to V2. This was first revealed in the owl monkey, which contains a “third tier” of multiple areas (Allman and Kaas, 1975; Allman and Kaas, 1976) (Newsome and Allman, 1980). Figure 2 shows a schematic summary map of 24 visuotopic areas, based on extensive high-density invasive neurophysiological receptive field mapping in three owl monkeys (Sereno et al., 2015). The map shows five areas adjoining area V2 (M, DM, DI, DLp, and VP). Of these, the two most dorsal (M and DM) each contain complete representations (upper- and lower-field), whereas areas DI and VP represent only upper fields. Area DLp contains a complete representation in the summary map, but in one monkey it lacked a clear upper-field component (see Figs. 5 – 7 of Sereno et al., 2015). Thus, some visual areas evidently lack a complete representation of the contralateral visual hemifield (as noted above for the mouse), and individual variability can extend to important aspects of visuotopic organization and areal borders. Moreover, alternative groupings of neighboring quadrants are plausible and indeed have been proposed by others (see legend to Figure 2). The realization that ambiguities can arise in parcellating cortex when using a single FACT category—even fine-grained topographic maps—increases the motivation for multimodal parcellations coupled with accurate intersubject registration of a large number of individuals (see SI Sections 3, 4).
Figure 2.

Schematic representation of 24 retinotopic areas in owl monkey visual cortical areas overlaid on a myelin-stained flatmount. Purple and yellow-green represent areas with opposite field signs. Retinotopy of areas M, ventral VP and VA, and ITi, and IT r were taken from Allman and Kaas (1975), Newsome and Allman (1980), and (Weller and Kaas, 1987). Note that Angelucci and Rosa (Angelucci and Rosa, 2015) proposed an alternative parcellation, with VP+ and DLp-grouped into area VLP for the owl monkey as well as the marmoset (analogous to a “V3” occupying much but not all of the cortex outside of V2), as might also be consistent with the discordant case of Sereno et al. (Sereno et al., 2015). Reproduced, with permission, from Sereno et al., (Sereno et al., 2015).
For the macaque, it is currently debated whether V2 is adjoined by a single area V3 or multiple third-tier areas (Angelucci et al., 2015; Zhu and Vanduffel, 2018). A recent high-resolution fMRI retinotopy study (Zhu and Vanduffel, 2018) provides strong evidence for at least three (and possibly four or five) third-tier areas in a pattern similar but not identical to New World monkeys in the six hemispheres (3 monkeys) that were studied. In contrast, many fMRI studies in humans point to a simpler arrangement in which a single V3 adjoins most of V2 and lacks a comparable degree of dorso-ventral asymmetry (see SI section 4.1.3).
Macaque area V4 is a major intermediate in the ventral visual stream and has been extensively studied, in part because much of it is exposed on the prelunate gyrus. Its lower-field dorsal (V4d) and upper-field ventral (V4v) subdivisions likely correspond to DLI and VA of the owl monkey (Figure 2; see SI section 4.2.1). V4 has a coarse modular organization that includes color-selective ‘globs’ and form-selective ‘interglobs’, (Conway et al., 2007), likely arising via preferential inputs from V2 thin stripes and interstripes, respectively (DeYoe et al, 1994; Felleman et al., 1997). These prominent but irregular internal features, coupled with irregularities and individual variability in visuotopic organization (Maguire and Baizer, 1984), make it challenging to precisely delineate the boundaries of area V4 or its putative anterior and posterior subdivisions based on the currently available data in the macaque (see SI Section 4.2).
More recent fMRI and neurophysiological studies report additional visuotopic areas in occipitotemporal cortex (Kolster et al., 2009; Janssens et al., 2014; Kolster et al., 2014; Orban et al., 2014; Arcaro and Livingstone, 2017) and in parietal cortex (Patel et al., 2010; Arcaro et al., 2011; Gamberini et al., 2011), but an accurate overall tally is challenging given the incomplete brain coverage in individual studies combined with limitations in accurate alignment across subjects and studies. Indeed, comparing these maps across studies would be facilitated by registering them to a common surface atlas as was described for area MT in SI Section 1.2.
Higher levels of the ventral stream include inferotemporal (IT) complex, which includes a single area TE or a pair of areas (TEO and TE) by some parcellations (Desimone and Ungerleider, 1989) but up to six areas in studies that identify posterior (PITd/v), central (CITd/v or TEpd/v) and anterior (AITd/v or TEad/v) areas (Felleman and Van Essen, 1991; Kolster et al., 2014; Markov et al., 2014). Importantly, the IT complex has a finer-grained modularity revealed by fMRI studies coupled with fMRI-guided single-unit recordings. This includes six face-selective ‘patches’ (yellow-orange in Figure 3) that differ in their selectivity for facial identity, pose, and expression (Tsao et al., 2008; Freiwald and Tsao, 2010; McMahon et al., 2014; Meyers et al., 2015) and in anatomical connectivity (Grimaldi et al., 2016), thus identifying them by two of the FACT categories. Four of these face patches are adjoined ventrally by color-biased patches (blue in Figure 3) containing many neurons selective for or biased for one or another hue (Lafer-Sousa and Conway, 2013). Additional modularity in IT includes ‘body-selective’ patches adjacent to face patches in the STS (Lafer-Sousa and Conway, 2013; (Vanduffel et al., 2014) and disparity-biased patches interspersed among the others (Verhoef et al., 2015). These face, color, body, and disparity patches represent ‘islands’ or modules within a larger domain of the IT complex, which also includes regions selective for inanimate objects and for places, or scenes. Also, face patches respond better to central stimuli and place patches to peripheral stimuli, suggesting an eccentricity-based organization as well (Lafer-Sousa and Conway, 2013). Altogether, these findings raise intriguing issues about what constitutes the fundamental units of parcellation in inferotemporal cortex. By one hypothesis, face, color, disparity, and body patches represent functionally distinct subareas within a larger areal mosaic. By another, each patch is sufficiently distinct to warrant being considered a cortical area in its own right. Addressing this important distinction will benefit from more extensive multimodal mapping, particularly in individual subjects. If a given pair, triplet, or quadruplet of functionally different patches share other important commonalities with one another and with the object-processing domain in which they are embedded, it would strengthen the argument for considering them as sub-parcels of larger areas.
Figure 3.

Color-biased fMRI activations (blue and cyan) found near face patches (orange and red), displayed on an inflated right hemisphere surface rotated up to show the ventral surface. Abbreviations for face patches (orange): PL, posterior lateral; ML, middle lateral; MF, middle fundus; AF, anterior fundus; AL, anterior lateral; AM, anterior medial; for color patches, PVc, posterior ventral color; CLc, central lateral color; and ‘c’ after other abbreviations stands for color., Reproduced, with permission, from (Lafer-Sousa and Conway, 2013)
A summary of pan-hemispheric NHP parcellations.
We have focused on parcellation of visual and somato-motor cortex in monkeys because these regions have been intensively studied using surface-based approaches. However, numerous parcellation schemes have been reported for other regions in macaques and other NHPs, some spanning only part of neocortex, but others encompassing the entire hemisphere. They differ in the types of architectonic or other criteria used to identify areas and in the methods used for analysis, visualization, and comparison across subjects. Here, we briefly consider estimates of the overall number of cortical areas in the macaque and marmoset.
The most fine-grained pan-hemispheric parcellation of macaque cortex is a 161-area parcellation based on cytoarchitecture and cholinesterase histochemistry (Paxinos et al., 2000). Some of its parcels are transitional regions (e.g., area ‘2/1’ between areas 2 and 1) and thus may not constitute well-defined areas. On the coarser side is the 91-area Markov parcellation (Markov et al., 2014), based on cytoarchitecture plus areal boundaries estimated from other atlases (Paxinos et al., 2000; Saleem and Logothetis, 2006); it is an underestimate in at least some regions (e.g., area 3 vs. 3a and 3b. In between are two parcellations that we suspect are closer to a neurobiologically accurate value. The D99 atlas (Saleem and Logothetis, 2006; Reveley et al., 2017) contains 137 areas, based on cytoarchitecture plus four immunocytochemical stains.). (Van Essen et al., 2012) generated a composite of three architectonic parcellations (Ferry et al., 2000; Lewis and Van Essen, 2000; Paxinos et al., 2000), resulting in a 129 area parcellation spanning 93% of the cortical sheet and an estimated ×140 areas for all of neocortex and transitional cortex, with a more than 100-fold range in size across different areas.
All but the Saleem and Logothetis parcellations have been registered to the F99 surface-based atlas (Van Essen et al., 2012) and more recently to the Yerkes19 population-average atlas (Donahue et al., 2018). Comparisons reveal numerous discrepancies in the topology of areal boundaries and the size and location of specific areas even when they have the same name (see SI section 1.3). Thus, no extant parcellation can be considered a gold standard or ground truth for the macaque, as there are uncertainties and controversies regarding many areal boundaries. Future high quality multi-modal datasets analyzed by cutting-edge methods will hopefully transcend these obstacles.
Marmoset cortical parcellations include the 117-area Paxinos atlas (Paxinos et al., 2011); (Majka et al., 2016); http://marmoset.braincircuits.org), the Hashikawa atlas (Hashikawa et al., 2015); http://brainatlas.brain.riken.jp/marmoset/), and the 54-area (and 106 ‘sub-region’) MRI-based Liu atlas (Liu et al., 2017). Thus, marmosets may have slightly fewer cortical areas than the macaque.
Human cortical parcellation – a 21st century perspective.
Studies of cerebral cortex in humans face fundamental challenges beyond those encountered in NHP studies. Invasive experiments are off limits except in rare clinical cases. Post-mortem brains are difficult to obtain, and, even when available, the brain tissue is often incomplete and/or of imperfect quality. That said, the advent of in vivo imaging methods starting in the 1980s initiated a new era of human systems neuroscience, and the number of brain mapping studies in humans far exceeds those in NHPS. The profusion of human neuroimaging studies has exposed a third major challenge, however: Humans have tremendous individual variability in cortical convolutions and in locations of areas relative to folds {Amunts, 2000; Coalson, 2018; Glasser, 2016b}, making the identification of corresponding locations across individuals especially challenging in regions of high variability.
In the 1990s, two methodological approaches emerged that have very different capacities to address individual variability in human cortical areal locations. The first is the “traditional” in vivo neuroimaging approach that emphasizes 3D volume-based analyses for all structures: the voxels (volume elements) used for data acquisition are the primary elements used for analysis, alignment, and visualization, even for the sheet-like cerebral cortex. This approach typically also involves a deleterious level of unconstrained 3D smoothing. The second approach focuses on 2D surface-based representations for cerebral cortex, modeling it as a set of 2D ‘vertices’ that respect the topology of cortical folds. More recently, this ‘surface-based’ approach has been extended to incorporate hybrid ‘grayordinate-based’ representations of cortical surface vertices and subcortical gray matter voxels, thereby respecting the intrinsic geometry of gray matter structures. We refer to this approach as ‘surface-based’ for its early years and ‘HCP-style’ or ‘grayordinate-based’ for its more recent refinements in the context of the Human Connectome Project. Deleterious smoothing is avoided in this approach. SI section 3.1 summarizes the history and key distinctions of these methodological approaches (see also (Glasser et al., 2016b; Coalson et al., 2018)).
Modern parcellation of the human brain has largely proceeded along five paths that are conceptually grounded in animal studies described above but have been adapted for human non-invasive neuroimaging. (i) Observer-independent estimation of areal boundaries uses architectural properties from post-mortem tissue or from in vivo measures of architecture. (ii) Functional tasks can localize functionally distinct areas. (iii) Topographic analyses can delineate visuotopy of visual cortex, somatotopy of somatosensory and motor cortex, and tonotopy of auditory cortex. (iv) Indirect measures of connectivity can reveal areal boundaries based on sharp spatial gradients in connectivity. Each of these four paths contributed to the semi-automated multi-modal approach that we used to generate a new comprehensive map of the human cerebral cortex (Glasser et al., 2016a). Finally, we contrast this multi-modal approach to parcellation with a fifth path of fully automated, unsupervised, and unimodal methods of parcellation, generally based on functional or structural connectivity data.
Observer-independent architectonics.
Classical architectonic studies relied upon subjective delineation of borders by neuroanatomists according to transitions in cytoarchitecture or myeloarchitecture delineated using visual inspection under the microscope and portrayed on drawings of histological sections and/or schematic drawings of the external surface of the brain (e.g., (Brodmann, 1909; Petrides et al., 2012; Nieuwenhuys, 2013)). These methods, together with the high variability of cortical folds and areal relationships to folds made it difficult to resolve differences of opinion on the number and boundaries of brain areas. In the late 1990s, semi-automated, supervised methods were developed for identifying areal boundaries based on objectively defined peaks in within-section cytoarchitectural change (Schleicher et al., 1999; Schleicher et al., 2009; Zilles and Amunts, 2010). These labor-intensive analyses yielded a systematic characterization of 47 human cytoarchitectonic areas and their variability across many (typically 10) individuals (Zilles and Amunts, 2010; Amunts and Zilles, 2015). These parcellations were aligned to volumetric atlas space using postmortem MRI and used to generate volume-based probabilistic maps and maximum-probability maps. However, volume-aligned parcellations are inherently challenging to accurately compare across subjects or studies (Glasser and Van Essen, 2011; Glasser et al., 2016b; Coalson et al., 2018) (see SI sections 3.2, 3.3). To date, 16 areas defined by observer-independent architectonics have been aligned using surface reconstructions generated from postmortem MRIs followed by folding-constrained surface registration to a surface-based atlas (Fischl et al., 2008; Rosenke et al., 2017). Such alignment enables precise comparisons with modern high quality neuroimaging data (Glasser and Van Essen, 2011; Glasser et al., 2016a; Rosenke et al., 2017). Another challenge in post-mortem architectural analyses is that areal boundaries may be less accurately identified in regions where 2D histological sections slice the convoluted cortex very obliquely (Fischl and Sereno, 2018). 3D histological representations such as the BigBrain (Amunts et al., 2013) and polarized light imaging (Axer et al., 2011; Magnain et al., 2015; Wang et al., 2018) may lead to improved areal definitions based on postmortem cyto- and/or myeloarchitecture. Additional architectural contrast mechanisms, such as neurotransmitter receptor architecture (Zilles and Amunts, 2009), can confirm cytoarchitectural and myeloarchitectural boundaries and may reveal additional areal boundaries (Palomero-Gallagher et al., 2009; Ding et al., 2016).
Cortical architectonics can also to some extent be measured using in vivo neuroimaging. A conceptually simple architectonic measure is cortical thickness (von Economo and Koskinos, 1925; Triarhou, 2007) and cortical thickness can be estimated non-invasively (Fischl and Dale, 2000). Structural MRI sequences with contrast for T1, T2* or magnetization transfer can reveal differences in cortical myelin and iron content (reviewed Glasser et al., 2014; see SI section 3.4). We used the T1w/T2w ratio to map estimated myelin content to the cortical surface, and used objectively defined spatial gradient ‘ridges’ (where myelin content changes rapidly) that agreed with areal boundaries defined by the aforementioned observer-independent architectonics and revealed additional previously unmapped areas (Glasser and Van Essen, 2011). In-vivo delineation of cortical areas using myelin and thickness maps requires a surface-based approach and benefits from high-resolution MRI (ideally better than 0.8 mm, half of the minimum cortical thickness of 1.6 mm) (Glasser et al., 2014). Even higher resolution, ultra-high field MRI scans (7T field strength or greater) can reveal laminar differences in myelination (Marques et al., 2017; Edwards et al., 2018) and cortical microarchitecture may also be revealed using diffusion imaging (Nagy et al., 2013; Ganepola et al., 2017).
Task-based functional mapping.
As an alternative to the traditional task-based fMRI analysis paradigm (critiqued in SI Sections 3.2, 3.5), some studies use “functional localizer” ROIs to identify and further analyze task-specific regions in individual subjects e.g.,(Saxe et al., 2006; Berman et al., 2010). This approach circumvents the problem of inaccurate alignment of individuals to an atlas but it typically includes unconstrained volumetric spatial smoothing that erodes spatial fidelity. It also uses significance thresholds for noisy single-subject data to delineate functional ROIs that are often implicitly or explicitly identified as functional ‘areas’, though such thresholds do not represent areal boundaries. Still other studies use surface-based analysis to circumvent problems with alignment and spatial blurring. However, the problems with defining areal borders based on statistical significance typically persist in surface-based functional localizer studies (e.g., Filimon et al., 2009). The locations of statistical significance thresholds are much less reproducible across datasets than are locations of maximal activation change, i.e., gradients in task fMRI beta (effect-size) maps (Glasser et al 2016b)), Nonetheless, such surface-based studies are more amenable to accurate cross-study comparisons (if results are freely shared) than are traditional volume-based analyses (see SI Section 3.5 for a brief review of the surface-based task fMRI literature).
Topographic studies of areas.
A pioneering early fMRI study (Sereno et al., 1995) used a surface-based approach to map representations of visual field eccentricity and polar angle, identifying five human visual areas previously identified using invasive methods in macaques. Many additional human visual areas have subsequently been identified using this approach (Wang et al., 2015; (Wandell and Winawer, 2011; Abdollahi et al., 2014) (Sereno et al., 2013)). Wang et al. (2015) used pan-hemispheric retinotopic mapping and surface alignment in dozens of subjects to identify 25 retinotopic ‘regions’; these included separate dorsal and ventral subdivisions of V1, V2, and V3, which are generally considered single areas (except perhaps V3; see SI section 4.1). Thus, their reckoning provides evidence for 22 or 23 human retinotopic areas. Other studies report some significant differences in the layout of some of these areas ((Hansen et al., 2007; Abdollahi et al., 2014); see SI section 4.1.1 for a discussion of HCP retinotopy results) as well as additional retinotopic areas (V6 and V6Av) that emphasize the visual periphery (Pitzalis et al., 2015).
Somatotopically organized cortex (especially somatosensory area 3b and motor area 4) have also been mapped using fMRI. Imaging at 7T reveals individual finger representations in areas 3b, 1,4 (and perhaps 3a and 2), plus an orthogonally oriented proximal-to-distal gradient (Sanchez-Panchuelo et al., 2012; Besle et al., 2013; Besle et al., 2014; Sanchez-Panchuelo et al., 2014), similar to that in monkeys (Nelson et al., 1980). Somatosensory and motor areas also contain discrete subdivisions between major body parts (Yeo et al., 2011); Meier et al., 2008; Glasser et al., 2016a; see below). Auditory cortex has been mapped tonotopically according to frequency (Humphries et al., 2010; Dick et al., 2012; Gardumi et al., 2017). However, unlike visual and somatosensory cortex, auditory cortex lacks an identified second orthogonal axis of topographic organization (Moerel et al., 2014). More generally, the concept of topographic organization is not restricted to sensory or motor areas and indeed extends to higher cognitive areas (see below).
Connectivity-based parcellation – Introduction.
Lipophilic dyes have been used as anatomical tracers in postmortem human brains (Burkhalter and Bernardo, 1989; Galuske et al., 2000), but are not effective for mapping long-distance pathways. Instead, extensive efforts to parcellate human cortex using the ‘C’ in the FACT categories have been based on two powerful but indirect measures of connectivity. Resting-state ‘functional connectivity’5 relies on temporal correlations in the fMRI signal measured between all possible gray matter locations, but is influenced by indirect as well as direct anatomical connections (Smith et al., 2013) and is very sensitive to non-neural noise sources, such as those from motion or physiology (Glasser et al 2018). Tractography-based ‘structural connectivity’ relies on estimating the orientation of one or more ‘fiber bundles’ in each white matter voxel based on diffusion imaging, which is sensitive to anisotropic water diffusion along the length of axons (Jbabdi et al., 2015). However, it too has major limitations within regions of complex fiber architecture and in accurately mapping connectivity transitions on the surface. largely reflecting difficulties in discerning fiber bundle mixing, axonal branching, and sharp (sub-voxel) curvature of axonal trajectories (Glasser et al., 2016b). We consider both functional and structural connectivity approaches in the section below on automated unimodal connectivity-based parcellations. Although most connectivity-based parcellation approaches have used some form of clustering algorithm (see below), another powerful approach to identifying candidate areal boundaries is a gradient-based approach similar in spirit to that used in modern post-mortem cytoarchitectural studies. An important early study correlated functional connectivity maps on a flattened patch of cortex, computed spatial gradients in 2D on the surface, and identified potential areal boundaries as ridges in the resulting mean gradients (Cohen et al., 2008). We improved upon this approach, enabling gradient computations on the full 3D anatomical surface for the architectonic parcellation noted above (Glasser and Van Essen, 2011) and in the multimodal parcellation (Glasser et al., 2016a) summarized in the next section.
The HCP_MMP1.0 multimodal cortical parcellation.
The availability of high quality multi-modal data from hundreds healthy young adults provided by the HCP afforded an unprecedented opportunity to generate a population average multimodal cortical parcellation together with parcellations of these individuals (Glasser et al., 2016a). The parcellation was enabled by four key advances together with integration of the preceding four human parcellation paths. (i) It used extensive multi-modal data of exceptional quality from each of hundreds of individuals, acquired at high resolution and processed with minimal blurring within subjects and precise alignment across subjects. (ii) It integrated complementary and converging information from all 4 FACT categories, including task-based functional MRI, architectural modalities of cortical thickness and T1w/T2w myelin maps, resting-state connectivity, and resting-state-based visuotopic maps. Using a semi-automated, supervised approach, two neuroanatomists (MFG and DCVE) selected multiple modality maps with useful information for each border between a pair of candidate areas, drew an initial border trajectory, and then used an algorithm to automatically adjust the final border to maximize agreement with the selected modalities. Further, the vast majority of identified boundaries had large across-border effect sizes in each of multiple independent modalities, and all showed statistically significant differences in multiple independent modalities after correcting for multiple comparisons. Importantly, the areas differed significantly across boundaries and had robust effect sizes across multiple modalities for the 210V group parcellation. (iii) The multimodal boundaries identified were meticulously compared with the prior neuroanatomical literature to identify 83 previously described cortical areas and characterize 97 new areas (often subdivisions of existing areas) for a total of 180 areas per hemisphere. Thus, areas reported in the literature were useful for naming purposes but did not contribute to border delineation. Each cortical area’s properties were also documented in detail in the supplemental material accompanying the study. (iv) After generating the parcellation on 210 subjects (210P group), we trained a machine learning classifier on this data to recognize each cortical area using its unique fingerprint. We then used this fully automated supervised areal classifier to replicate the parcellation on an independent group of 210 subjects (210V). We call this map (Figure 4) the HCP’s multi-modal parcellation version 1.0 (HCP_MMp1.0), anticipating that it is not the final parcellation of human cerebral cortex.
Figure 4.

The HCP’s multi-modal parcellation, version 1.0 (HCP_MMP1.0). The 180 areas delineated and identified in both left and right hemispheres are displayed on inflated and flattened cortical surfaces. Black outlines indicate areal borders. Colors indicate the extent to which the areas are associated in the resting state with auditory (red), somatosensory (green), visual (blue), task positive (towards white), or task negative (towards black) groups of areas. The bottom right illustrates the 3D color space used in the figure. Reproduced with permission from Glasser et al. (Glasser et al., 2016a). Data at http://balsa.wustl.edu/WN56
The colors in Figure 4 reflect each area’s association in the resting state data with five functionally specialized sets of areas. The early auditory (red), early somatosensory/motor (green), and early visual areas (blue) represent the three dominant input streams to the brain. The other two groups were a set of strongly anti-correlated cognitive areas, the task positive network (towards white) and task negative (also called the default mode) network (towards black). The bilateral symmetry of functional organization is striking, as nearly all areas have similar hues in the left and right hemispheres. Each area was identified independently in each hemisphere (based on the data, rather than symmetry being imposed as a required criterion), yet most areal boundaries are located in the same relative position in each hemisphere (though some areas such as a10p and p10p have different neighbor relationships for the left vs right hemispheres). However, interesting color (functional connectivity) asymmetries occur in a few areas, especially language-related areas 55b, PSL, SFL, and 44 and their right hemisphere homologues, which also have asymmetric task-fMRI functional profiles (Glasser et al 2016a).
As expected from the aforementioned mouse and monkey studies, internal heterogeneity is evident in some well-defined human cortical areas, particularly those with topographically organized representations. In the somatosensory-motor strip (somatosensory and motor areas 3a, 3b, 1,2, and 4 that were defined largely by multiple architectural measures), we identified five clearly defined topographic subregions in resting state and task fMRI data, including the face (with a separate eye-related sub-region), upper extremity, trunk, and lower extremity (Figure 5). The intersection of these subregional borders with the areal borders could be used to make a set of subareas in each cortical area. For visual cortex, we used resting state functional connectivity to infer the visuotopic organization of 16 visual areas, most of which are in approximate agreement with the aforementioned task-based retinotopic mapping studies (see (Glasser et al., 2016a) Supplemental Neuroanatomical Results sections 1-5, 16, 17, and Table 1). Connectivity patterns that respect visuotopic organization inherently contribute to the internal heterogeneity of many areas, yet, as noted above, represent a powerful approach to delineating these areas.
Figure 5.
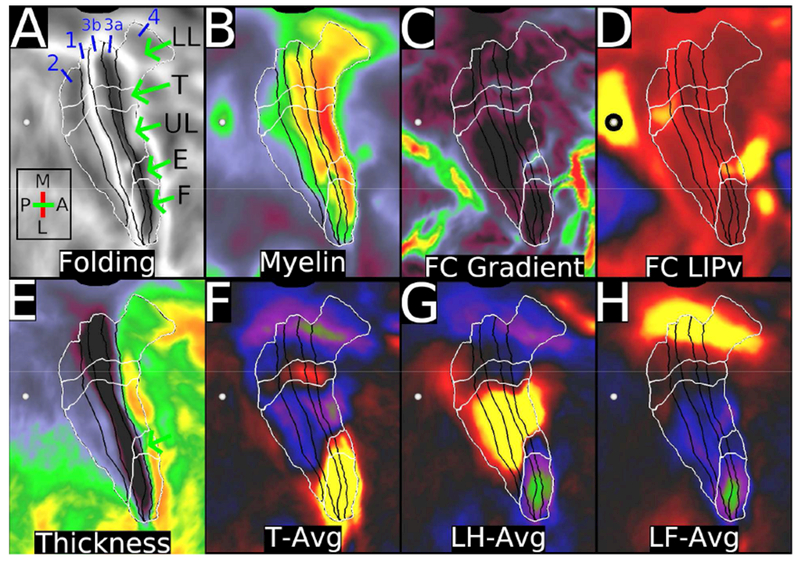
shows areas (black borders) and subregions (white borders) of the sensorimotor strip, displayed on cortical flatmaps of the right hemisphere. The intersection of these two sets of borders represent subareas. A. Folding maps with abbreviations for lower limb (LL), trunk (T), upper limb (UL), eye (E), and face (F). B. Myelin map, with contrast adjusted to illustrate correspondence with subareas, e.g. a reproducible dip in myelin content between the upper limb and face subregions of area 3b and between the upper limb, eye, and face subareas of area 4 (Glasser et al., 2016a). Areal boundaries for areas 4, 3a, 3b, 1, and 2 are black. C. Resting state functional connectivity (FC) gradients that were used to define the subregions using the semiautomated border drawing approach. D. Functional connectivity from the heavily myelinated LIPv seed (black circle, which has functional connectivity with some parts of the sensorimotor strip. E. Thickness map. F, G, and H show the task fMRI contrasts for moving the tongue (T-AVG), left hand (LH-AVG), and left foot (LF-AVG). Data at https://balsa.wustl.edu/PLx0.
Outside the early sensory and motor cortical areas, we found evidence of topographic organization such as that illustrated in Figure 6 for the areas that comprise the language network. This constitutes another intriguing example of internal areal heterogeneity, though its functional significance remains unclear. We anticipate that as cognitive neuroscientific studies increasingly use HCP-style methods, they will reveal additional examples of topographic organization in higher order cortical areas (e.g.. (Jbabdi et al., 2013; Huth et al., 2016; Tobyne et al., 2017);(Sereno and Huang, 2006; Hagler et al., 2007; Pinsk et al., 2009; Harvey et al., 2013; Sood and Sereno, 2016). Also relevant is a detailed characterization of spatially varying gradients in resting state functional connectivity (Margulies et al., 2016), some of which appear to represent sharp areal boundaries and others within-area connectivity gradients of the kind illustrated in Figure 6. Because within-area meso-scale organization is likely more variable across subjects than areal organization (which itself varies as described below), areal-feature-based surface registration will be invaluable for analyzing these patterns, as will methods that do not enforce a spatially consistent mapping, such as MVPA (Multi-Voxel, or MultiVariate, Pattern Analysis (Haxby, 2012; Haxby et al., 2014)). Thus, we disagree with the suggestion that orderly topographic organization is lacking in higher multimodal regions (Eickhoff et al., 2017), an inference that may reflect overreliance on studies using the blurry traditional brain imaging paradigm. As non-invasive imaging achieves progressively greater precision, critical goals of future research will be to distinguish between subareal vs areal organization using multiple modalities and to improve our understanding of the functional significance of each aspect of cortical organization.
Figure 6.

shows the topographic organization of the left hemisphere language network (column 1, d=40 ICA RSN). Four seeds are placed along the anterior-posterior axis of area PSL in the left hemisphere (marked by white arrows from posterior to anterior). The functional connectivity pattern shows corresponding changes in the other major nodes of the language network, including 55b, SFL, and 44. The pattern is present when seeded in either hemisphere, but stronger in the left hemisphere and is also present if any of the four highlighted areas is used as the seed. Data at https://balsa.wustl.edu/7Z3k.
We consider the 180 areas per hemisphere of the HCP_MMP1.0 parcellation to be a lower bound. Some existing parcels may end up split into finer-grained areas with better data or methods, particularly in restricted regions of reduced MRI signal quality, or regions with unusually variable individual topography even after areal feature-based surface registration. This includes the orbitofrontal complex (OFC), which contains multiple architectonic areas (Ongur et al., 2003); the ventral visual complex (VVC), which contains multiple visuotopic areas (Wang et al., 2015) only hinted at in our data; and the fusiform face complex (FFC), which contains multiple face patches (Kanwisher and Yovel, 2006; Tsao et al., 2008) not clearly discernible in our group-average data but evident in many individual HCP subjects (see SI section 4.2.2). Future analyses of topographic maps in higher cognitive regions might also reveal that some of the HCP_MMP1.0 areal boundaries are more appropriately considered borders between subareas. Higher resolution data from the HCP subjects scanned at 7T and from other sources will likely enable refinements to the map; however, we predict that most of HCP_MMP1.0 areal identities and borders will stand the test of time.
Given that the HCP_MMP1.0 parcellation has many more areas than have been identified to date in monkeys (see above), it is natural to wonder which human areas lack monkey homologues and thus may reflect emergence in the human lineage. However, these are challenging questions to resolve incisively (see SI Section 4 and also Van Essen et al., 2018).
A surprising finding pertains to the neighborhood relationships of cortical areas in individuals compared to the group average parcellation. For example, in the language-related area 55b in the left hemisphere 11% of areas had atypical topologies relative to neighboring areas FEF and SEF (Glasser et al., 2016a). Area 55b may be a hotspot of such variability, but it is by no means unique. Indeed, it is plausible that not all individuals have all cortical areas, and some individuals might have additional cortical areas. Unraveling such mysteries will require careful attention to methods, high quality data, and critical scrutiny of the results.
Comparisons with Unimodal parcellations.
In recent years, many parcellations of human cerebral cortex have been produced using unimodal neuroimaging data – mostly functional connectivity, but some using structural connectivity. Here, we offer some general comments about the trade-offs of different parcellation approaches. We focus first on ‘hard’ (binary) and topologically discrete (unitary) parcellations akin to the HCP_MMP1.0, then briefly discuss ‘soft’ (‘fuzzy’) and spatially distributed networks.
Two fundamental observations provide important context when evaluating any cortical parcellation. (i) Bilateral symmetry. The fine-grained (‘dense’) data used to generate the HCP_MMP1.0 parcellation shows striking bilateral symmetry in the maps obtained for each modality: myelin and thickness, functional activation, ‘dense’ functional connectivity, and visuotopic organization (see Glasser et al. Supplementary Results, Figures 1,2, and 4). This is consistent with the high degree of bilateral symmetry reported for observer-independent cytoarchitectonic maps (see above). Besides accounting for the correspondingly high degree of symmetry in our 180-area-per-hemisphere parcellation (Figure 4), bilateral symmetry in the underlying data sets expectations regarding other parcellations: they should also show a high degree of symmetry to the extent that they accurately reflect the underlying neurobiological organization (as noted above, bilateral symmetry was not “forced upon” our parcellation). Stated differently, a lack of bilateral symmetry in any given parcellation raises a concern that the asymmetries may reflect inaccurate intersubject alignment, noise, or other confounds, rather than neurobiologically robust distinctions (unless they are explicitly accounted for by demonstrable multi-modal asymmetries).
(ii) Within-area inhomogeneity. Many human cortical areas show striking internal heterogeneity, particularly in task activations and in functional connectivity of early sensory and motor areas (Figure 5). This is strongly consistent with observations discussed above on heterogeneity of analogous areas in mice and monkeys, which nonetheless are each considered well-defined areas having complete topographic maps, consistent internal architecture, and other area-specific functional and connectional characteristics. An alternative perspective (Kuehn et al., 2017) is that the major body part representations of areas 4 and 3b constitute distinct ‘fields’ or ‘meso-maps’ that are in effect separate areas (Amunts and Zilles, 2015) or “atoms”6 (Eickhoff et al 2017; Schaefer et al 2017). However, we contend that these human subareas, like mouse area SSp and monkey somatosensory and motor areas, have similar local connectional architecture and undertake similar computations across subareas, even though there are important differences across subareas in functional connectivity (and presumably also anatomical connectivity) and in the pattern of task activations (just as central vs peripheral visual cortex differ in connectivity and activation patterns).
These observations on intra-areal inhomogeneities raise important conceptual as well as practical issues for interpreting parcellations that are based on homogeneity of a single measure or modality. Many fMRI-based unimodal approaches identify parcels based on maximizing one or another measure of internal homogeneity using various clustering algorithms (e.g., (Power et al., 2011; Yeo et al., 2011; Craddock et al., 2012; Blumensath et al., 2013; Shen et al., 2013; Finn et al., 2015), surface-gradient-based boundary-mapping algorithms (Wig et al., 2014) coupled with a watershed transform (Laumann et al., 2015; Gordon et al., 2016) or a combination of the two (Schaefer et al., 2017). However, fMRI coactivation or “functional connectivity” (FC) is fundamentally an indirect measure that largely reflects the degree to which any pair of cortical locations are jointly activated or deactivated over a time frame of seconds to minutes (not milliseconds) given the slowness of neurovascular coupling via the hemodynamic response function (Lindquist et al., 2009). However, a high correlation (FC) value by no means implies that two locations have the same function or are undertaking the same neural computations. For example, both somatosensory and motor regions associated with the upper limb are coactivated during tasks involving hand and/or arm movements (and to a higher degree than the hand vs foot regions within an area), yet the nature of the signals conveyed by areas 3a (proprioceptive), 3b and 1 (cutaneous tactile), and 4 (volitional movement) are profoundly different across areas yet similar throughout each area. For visual cortex, an analogous situation involves FC-based parcels spanning multiple early areas (e.g., V1 – V3) but only central or peripheral portions of the visual field, with boundaries that are not neurobiologically-based (i.e., akin to somatotopic body parts), but instead depend on the paradigm e.g. eyes are open vs closed (Laumann et al., 2015) and may be influenced by visual fixation crosshairs.
In general, such ‘non-areal’ parcellations may be useful for dimensionality reduction, but their neuroanatomical interpretability depends on the extent to which they reflect important and consistent aspects of neurobiological organization (including the bilateral symmetry constraint noted above). Moreover, dimensionality reduction aimed at maximizing homogeneity need not (and perhaps optimally should not) use hard parcel boundaries. Alternative approaches, such as spatial ICA combined with multiple regression (Beckmann et al., 2005; Smith et al., 2009), use soft boundaries that distinguish spatially overlapping processes better than hard parcellations, insofar as they generate maximally “pure” homogeneous time courses. However, soft parcellations are also challenging to interpret neurobiologically. Thus, the spectrum of parcellation approaches ranges from cortical areal maps that tolerate topographic inhomogeneity yet are most interpretable neurobiologically to soft parcellations that maximize homogeneity but are the least interpretable. Conceptually and semantically, unimodal parcellations (soft or hard, but especially unsupervised and fully automated, see below) should in general not be considered equivalent to cortical areas, though they may serve other useful purposes.
Unsupervised and automated unimodal parcellation methods (including those cited above) warrant additional cautionary comments. Automation offers the enticing prospect of objective, purely data-driven outcomes with much less investigator effort than semi-automated approaches. However, automated approaches often have a very wide solution space, with many parcellation algorithms and approaches (see above), and multiple parcellation versions within each approach when there are free parameters to adjust. Automated parcellations may be sensitive to small variations in the data, leading to asymmetric areal boundaries across hemispheres that may not be neurobiologically driven. Even multi-modal automated parcellation approaches struggle to identify well known cortical areas (Parisot et al., 2017), suggesting it will be extremely difficult to generate accurate cortical parcellations without expert intervention and quality control, as remains the neuroanatomical gold standard (Schleicher et al., 2009).
To evaluate different parcellations, another seductive idea is to use automated quantitative metrics, such as measures of within-parcel homogeneity of functional connectivity or the Silhouette measure that compares within-parcel versus cross-parcel connectivity similarity (Gordon et al., 2016; Arslan et al., 2017). However, unimodal homogeneity is a problematic measure insofar as well-defined cortical areas can have significant heterogeneity in connectivity, reflecting neurobiologically relevant topographic organization in cognitive as well as sensorimotor areas (Figures 6 and 5). For the Silhouette measure, well-defined topographically organized areas (e.g., visual and somatosensory-motor) will perform poorly because they have strong topographic functional connectivity across areal boundaries, but weaker connectivity spanning the entire area. Alternative validation approaches that may be less biased include quantitative measures that evaluate parcellations based on neurobiologically relevant performance, e.g., using parcellated functional connectivity matrices to predict gender (Arslan et al 2017) or fluid intelligence (Dubois, 2017). In our view, semi-automated, supervised approaches with neuroanatomist-driven quality control offer a better chance at generating neurobiologically interpretable parcellations than do approaches that complete rely on fully automated parcellation and evaluation methods.
Tractography based on diffusion imaging allows estimation of long-distance tracts within white matter and of ‘structural connectivity’ between gray matter regions (Jbabdi et al., 2015). Early studies used volumetric approaches to parcellate cingulate cortex (Johansen-Berg et al., 2004; Beckmann et al., 2009) and parietal cortex (Mars et al., 2011) and to demonstrate correlations with functional connectivity. These efforts have been extended to tractography-based parcellation of the entire cortex and even the whole brain (e.g., (Moreno-Dominguez et al., 2014; Tungaraza et al., 2015; Fan et al., 2016; Lefranc et al., 2016; Wang et al., 2016). However, tractography suffers from several serious limitations as an approach to cortical parcellation, including biases related to gyral and sulcal folding patterns (Van Essen et al., 2014; Reveley et al., 2015; Donahue et al., 2016). These limitations are especially problematic for detecting areal boundaries on surfaces that reflect genuine connectivity gradients rather than folding-related geometric effects (Glasser et al 2016b). For these reasons, we did not use structural connectivity as one of the modalities in the HCP_MMP1.0 parcellation, and we consider it important to evaluate tractography-based parcellation boundaries with great care—ideally by validating against other modalities.
As noted above, some aspects of areal and subareal or subregional organization are best revealed by anatomical measures (e.g., myelin maps and thickness maps) and others by functional measures (e.g., FC and task activation gradients), and not all FACT properties agree on every areal border. However, it is important not to over interpret discordances between different FACT properties by making an unwarranted simplification that the cortex contains separable “anatomical” and “functional” parcellations that are in some sense orthogonal to each other, or to go further by asserting that multi-modal parcellations are undesirable relative to uni-modal parcellations because of such disagreements. We believe that brain function is inseparable from the underlying neuroanatomy, including local circuitry and distant connections of brain areas (see also SI section 4.3).
From Cortical Areas to Functional Networks and the Generation of Human Behavior.
Cortical areas represent a fundamental level of cortical organization that is particularly accessible to non-invasive brain imaging in humans. During natural behavior, cortical areas do not operate in isolation, but instead interact with one another and with cerebellar and subcortical structures at the level of functional networks. Functional networks have been extensively analyzed using resting-state fMRI data and various approaches to define “resting state networks” using clustering, (e.g., (Power et al., 2011; Yeo et al., 2011)) or ‘soft’ (non-binary) methods such as spatial ICA (see above). Functional networks reflect correlations in fMRI signal in spatially separated brain regions. One way to study these networks is to correlate the fMRI signal of all brain parcels to all other parcels, yielding a parcellated functional “connectome”. This is often done using resting-state data to generate the parcels (network ‘nodes’) as well as to characterize the networks. A pitfall is that the unimodally defined network nodes may not be accurately defined or neurobiologically interpretable for reasons discussed above. Alternatively, the HCP_MMP1.0 multimodal parcellation provides an attractive substrate for computing parcellated functional connectomes (e.g., Fig. 4 in Glasser et al., 2016a), particularly when the areas are defined by the areal classifier in individual subjects, thereby representing area to area connectivity, though not within-area heterogeneity (see also (Bijsterbosch et al., 2018)).
A very different approach to characterizing functional networks involves temporal ICA, which generates a set of temporally independent (uncorrelated) components, or Temporal Functional Modes (TFMs) (Smith et al., 2012; Glasser et al., 2018). In temporal ICA, the resulting component spatial maps contain all of the connectivity information, as by definition the “functional connectome” of the component timeseries is the identity matrix (ones along the diagonal and zeros elsewhere) (See Glasser et al 2018 Main Supplementary Information Section #1). An initial application of temporal ICA to early HCP-style data provided an informative proof of concept using a small number of subjects (Smith et al., 2012). A recent temporal ICA analysis (Glasser et al., 2018) used both resting state and task fMRI from 449 HCP subjects and demonstrated how temporal ICA can remove global structured noise that contaminates estimates of functional connectivity without removing global neural signal and thereby biasing connectivity estimates. The TFM signal components from that study warrant brief description here, as they suggest a fresh perspective on functional networks more generally.
(i) Some TFMs are nearly identical between resting state and task fMRI paradigms and are very similar to standard task fMRI GLM effect size maps. For example, Figure 7A shows nearly identical TFMs representing the right upper extremity from task (TFM #6) and resting-state (TFM #33); four additional TFM pairs represent somatosensory-motor networks for the bilateral face, left upper extremity, bilateral eye and trunk, and bilateral lower extremity; each component includes a complete set of motor and sensory topographic subareas (see legend and also Glasser et al 2018 supplementary materials). The complete representation of somatotopic subareas suggests that these components reflect synchronized activity of brain areas within entire functional networks during specific subject behaviors. These components are also very similar to the corresponding effect size maps from the task GLM analysis (aside from the eye/trunk component which was not a part of the explicit task). (ii) More generally, similar correlations were evident for some task TFMs and task GLM maps from all seven HCP task paradigms (Glasser et al 2018), but none of the others were also present in the resting state data, suggesting that subject movement is the only task-driven behavior in the HCP task paradigms that closely mirrors aspects of behavior during the resting state.
Figure 7.

A. TFMs related to the right hand sensorimotor network from task fMRI data concatenated across the 7 HCP tasks (left) and resting-state fMRI data (right). Each includes relevant portions of primary motor and sensory areas, SII, pre-motor cortex, insular cortex, supplementary and cingulate motor areas, plus the thalamus, the caudate and putamen, two distinct hotspots in the cerebellum, and in the case of the face component, cranial nerve nuclei in the brainstem. Aside from the motor task, none of these other task-specific task temporal ICA components matched resting state components very closely. B. TFMs related to the lateralized language network. Data at https://balsa.wustl.edu/6w32.
(iii) Some task TFMs differ from any task GLM map, but nonetheless show highly similar patterns in both resting state fMRI and task fMRI, such as components that represent portions of the default mode (task negative) network. Other TFMs shared between resting state and task are related to higher-level functions such as language (Figure 7B). (iv) Many TFM patterns are present only in one or the other dataset. For example, the strongest neural component in the task data was the main effect of the social task (visual motion). The strongest TFM in the resting state is not present at all in the task fMRI data and appears to be related to subjects becoming drowsy or falling asleep during the long resting state scans, which does not occur while subjects are actively engaged in a task (Glasser et al 2018). Though sleep and drowsiness is undesirable during a scan intended to measure awake brain activity (and strongly affects functional connectivity) it is neurally generated and thus is not “noise” in the same sense as fMRI signal intensity fluctuations from movement, physiology, or MR physics effects. Altogether, in each signal temporal ICA component, multiple cortical areas/subareas are either activated or deactivated in a temporally correlated pattern, likely in relation to some ongoing behavior or mental process.
It is widely presumed that the brain can be parcellated into functional networks, and similar spatial patterns are often found across resting state studies and have been assigned widely used names. This includes cognitive networks (the default mode, fronto-parietal, dorsal attention, cingulo-opercular, parieto-occipital, medial parietal, and left-language/right-ventral-attention networks), and many studies also segregate visual, sensorimotor, and auditory domains into varying numbers of subdivisions reflecting topographic organization. However, a hard parcellation into discrete functional networks may not yield a complete and accurate delineation of well-defined networks. We consider it neurobiologically more plausible that functional networks often overlap spatially and may be more finely dissected by invoking temporal independence and allowing soft boundaries. Indeed, our resting state temporal ICA analysis allows spatial overlap of TFMs and reveals TFMs similar to all of the functional networks mentioned above (Glasser et al 2018), however some networks are split into multiple similar but not identical TFMs (e.g., the default mode network, the fronto-parietal network, and the language network). Additionally, not all resting state networks are evident in the task data, which instead includes many task-specific components. This striking finding suggests that the typically reported set of “resting state networks” may be far from a comprehensive catalog of human functional networks. They may instead mainly represent a subset of ‘behaviors’ (or their mental ‘processes’ uncoupled from overt actions) that commonly occur during resting state scans. The additional TFMs induced by diverse tasks in the scanner provide a glimpse, or preview, of what may be a much wider range of functional networks that occur naturally during daily life. Any specific behavior might have a distinctive functional network, similar behaviors may have largely overlapping functional networks, and each cortical area may be responsible for a portion of the computations necessary to produce a behavior when working in concert with its partners in that behavior’s functional network.
Concluding Comments
Here, we have discussed cortical parcellation from both historical and methodological perspectives, and we have summarized recent progress in parcellating mammalian neocortex, particularly in the intensively studied mouse, monkey, and human. The most convincing areal delineations are based on a convergence of multimodal information from four FACT categories (function, architecture, connectivity, and topography) as initially described in nonhuman primate studies. The aspiration of achieving a well-defined multi-modal parcellation has remained elusive for all species, but the field is closest for the mouse (41 areas per hemisphere) and human (180 areas). Macaques (×140 areas) and marmosets (×100+ areas) have intermediate numbers of areas per hemisphere, but are farther from having well characterized multi-modal maps.
Progress in human neuroimaging has been hampered by a traditional analysis approach that produces blurry blobs and 3D coordinates that are inherently challenging to compare accurately across studies or with modern brain maps and should not be equated with cortical areas. The HCP-Style surface-based approach emphasizes multi-modal mapping of human cortical areas and precise comparisons across individuals and studies. We have noted the popularity of many unimodal parcellations, including those generated by automated unsupervised methods; however, we also discussed major limitations of such approaches in relation to neurobiological robustness and interpretability. Such parcellations are intermediate along the continuum between non-overlapping cortical areas and highly overlapping functional networks and provide incomplete descriptions of either neurobiological entity. In our view, the most promising path for improved delineations of human cortical areas will involve semi-automated parcellations that use better multimodal data, engage additional imagers with neuroanatomical expertise to work on the problem, and are based on careful comparisons across studies and with the prior neuroanatomical literature. Projects currently providing data well suited for this approach include the large-scale Lifespan HCP Aging and Development efforts, the 14 NIIH-funded Connectomes Related to Human Disease projects, the Adolescent Brain and Cognitive Development (ABCD) project (https://abcdstudy.org), and other ‘R01-style’ projects that acquire and process multimodal data in sufficient amount and quality to enable HCP-style processing (Glasser et al., 2016b). Collectively, these studies will further our understanding of brain organization, function, and connectivity in different groups as well as individuals across the lifespan and in health and disease.
Supplementary Material
Highlights.
Cerebral cortex contains many anatomically and functionally distinct cortical areas.
Progress in parcellating mouse and monkey cortex laid a foundation for mapping human cortex.
A semi-automated, multi-modal approach identified 180 areas per human hemisphere.
Unimodal, fully automated parcellation approaches have substantial limitations.
Acknowledgments.
We thank Susan Danker for assistance with manuscript preparation and Andreas Burkhalter, Chad Donahue, Daniel Margulies, Wim Vanduffel, and two anonymous reviewers for valuable comments on the manuscript. Supported by grants RO1 MH-60974 (DCVE) and NIH F30 MH097312 (MFG). Human datasets were provided by the Human Connectome Project, WU-Minn Consortium (Principal Investigators: David Van Essen and Kamil Ugurbil; 1U54MH091657) funded by the 16 NIH Institutes and Centers that support the NIH Blueprint for Neuroscience Research; and by the McDonnell Center for Systems Neuroscience at Washington University.
Footnotes
’Retinotopic’ and ‘visuotopic’ are largely synonymous, and both terms are widely used. Retinotopic is appropriate when the mapping method involves visual stimulation via the retina. Visuotopic is more appropriate when the analysis involves connections or interactions between topographically organized visual areas, but without overt retinal stimulation.
We prefer “weight” to the commonly used term “strength.” The latter is more suggestive of the magnitude of a functional relationship between the areas, which depends not only on the number of synapse (for anterograde tracers) or of retrogradely labeled neurons but on where synapses are located on dendritic arbors and how they are distributed across excitatory vs inhibitory target neurons.
Although the transition from V1 to V2 is indeed extremely sharp, there is an architectonic transition region on either side; on the V2 side it is known as OBγ (Von Economo, 1927).
In the macaque area 18 is much wider than V2 (Brodmann, 1905; Van Essen and Maunsell, 1980)
It is widely recognized (but not always remembered) that functional connectivity is a highly indirect reflection of direct anatomical connectivity, because correlations in the BOLD signal can reflect polysynaptic inputs via one or more intervening area and also common inputs to areas that are not directly connected (Smith et al., 2013). Direct comparisons of anatomical vs functional connectivity in nonhuman primates may help clarify the similarities and differences.
Since ‘atom’ is derived from the Greek word for indivisible, it seems an infelicitous term for neurobiological domains that are in reality divisible at multiple levels of granularity, including cortical columns, layers, and neurons (Churchland and Sejnowski, 1988).
Publisher's Disclaimer: This is a PDF file of an unedited manuscript that has been accepted for publication. As a service to our customers we are providing this early version of the manuscript. The manuscript will undergo copyediting, typesetting, and review of the resulting proof before it is published in its final citable form. Please note that during the production process errors may be discovered which could affect the content, and all legal disclaimers that apply to the journal pertain.
Declaration of Interests
The authors declare no competing interests.
References
- Abdollahi RO, Kolster H, Glasser MF, Robinson EC, Coalson TS, Dierker D, Jenkinson M, Van Essen DC, and Orban GA. (2014) Correspondences between retinotopic areas and myelin maps in human visual cortex. Neuroimage. 99, 509–524. [DOI] [PMC free article] [PubMed] [Google Scholar]
- Allman JM, and Kaas JH. (1974) The organization of the second visual area (V II) in the owl monkey: a second order transformation of the visual hemifield. Brain Res 76, 247–265. [DOI] [PubMed] [Google Scholar]
- Allman JM, and Kaas JH. (1975) The dorsomedial cortical visual area: a third tier area in the occipital lobe of the owl monkey (Aotus trivirgatus). Brain Res 100, 473–487. [DOI] [PubMed] [Google Scholar]
- Allman JM, and Kaas JH. (1976) Representation of the visual field on the medial wall of occipital-parietal cortex in the owl monkey. Science. 191, 572–575. [DOI] [PubMed] [Google Scholar]
- Amunts K, Lepage C, Borgeat L, Mohlberg H, Dickscheid T, Rousseau ME, Bludau S, Bazin PL, Lewis LB, Oros-Peusquens AM, Shah NJ, Lippert T, Zilles K, and Evans AC. (2013) BigBrain: an ultrahigh-resolution 3D human brain model. Science. 340, 1472–1475. [DOI] [PubMed] [Google Scholar]
- Amunts K, Malikovic A, Mohlberg H, Schormann T, and Zilles K. (2000) Brodmann’s areas 17 and 18 brought into stereotaxic space-where and how variable? Neuroimage. 11,66–84. [DOI] [PubMed] [Google Scholar]
- Amunts K, and Zilles K. (2015) Architectonic Mapping of the Human Brain beyond Brodmann. Neuron. 88, 1086–1107. [DOI] [PubMed] [Google Scholar]
- Angelucci A, Roe AW, and Sereno MI. (2015) Controversial issues in visual cortex mapping: Extrastriate cortex between areas V2 and MT in human and nonhuman primates. Vis Neurosci 32, E025. [DOI] [PMC free article] [PubMed] [Google Scholar]
- Angelucci A, and Rosa MG. (2015) Resolving the organization of the third tier visual cortex in primates: a hypothesis-based approach. Vis Neurosci 32, E010. [DOI] [PMC free article] [PubMed] [Google Scholar]
- Arcaro MJ, and Livingstone MS. (2017) Retinotopic Organization of Scene Areas in Macaque Inferior Temporal Cortex. J Neurosci 37, 7373–7389. [DOI] [PMC free article] [PubMed] [Google Scholar]
- Arcaro MJ, Pinsk MA, Li X, and Kastner S. (2011) Visuotopic organization of macaque posterior parietal cortex: a functional magnetic resonance imaging study. J Neurosci 31, 2064–2078. [DOI] [PMC free article] [PubMed] [Google Scholar]
- Arslan S, Ktena SI, Makropoulos A, Robinson EC, Rueckert D, and Parisot S. (2017) Human brain mapping: A systematic comparison of parcellation methods for the human cerebral cortex. Neuroimage. [DOI] [PubMed] [Google Scholar]
- Axer M, Grassel D, Kleiner M, Dammers J, Dickscheid T, Reckfort J, Hutz T, Eiben B, Pietrzyk U, Zilles K, and Amunts K. (2011) High-resolution fiber tract reconstruction in the human brain by means of three-dimensional polarized light imaging. Front Neuroinform. 5, 34. [DOI] [PMC free article] [PubMed] [Google Scholar]
- Beckmann CF, DeLuca M, Devlin JT, and Smith SM. (2005) Investigations into resting-state connectivity using independent component analysis. Philos Trans R Soc Lond B Biol Sci 360, 1001–1013. [DOI] [PMC free article] [PubMed] [Google Scholar]
- Beckmann, M, Johansen-Berg H, and Rushworth MF. (2009) Connectivity-based parcellation of human cingulate cortex and its relation to functional specialization. J Neurosci 29, 1175–1190. [DOI] [PMC free article] [PubMed] [Google Scholar]
- Berman MG, Park J, Gonzalez R, Polk TA, Gehrke A, Knaffla S, and Jonides J. (2010) Evaluating functional localizers: the case of the FFA. Neuroimage. 50, 56–71. [DOI] [PMC free article] [PubMed] [Google Scholar]
- Besle J, Sanchez-Panchuelo RM, Bowtell R, Francis S, and Schluppeck D. (2013) Single-subject fMRI mapping at 7 T of the representation of fingertips in S1: a comparison of event-related and phase-encoding designs. J Neurophysiol 109, 2293–2305. [DOI] [PMC free article] [PubMed] [Google Scholar]
- Besle J, Sanchez-Panchuelo RM, Bowtell R, Francis S, and Schluppeck D. (2014) Event-related fMRI at 7T reveals overlapping cortical representations for adjacent fingertips in S1 of individual subjects. Hum Brain Mapp. 35, 2027–2043. [DOI] [PMC free article] [PubMed] [Google Scholar]
- Betzel RF, and Bassett DS. (2018) Specificity and robustness of long-distance connections in weighted, interareal connectomes. Proc Natl Acad Sci U S A. 115, E4880–E4889. [DOI] [PMC free article] [PubMed] [Google Scholar]
- Bijsterbosch JD, Woolrich M, Glasser MF, Robinson EC, Beckmann CF, Van Essen DC, Harrison SJ, and Smith SM. (2018) The relationship between spatial configuration and functional connectivity of brain regions. eLife (in press). [DOI] [PMC free article] [PubMed] [Google Scholar]
- Blumensath T, Jbabdi S, Glasser MF, Van Essen DC, Ugurbil K, Behrens TE, and Smith SM. (2013) Spatially constrained hierarchical parcellation of the brain with resting-state fMRI. Neuroimage. 76, 313–324. [DOI] [PMC free article] [PubMed] [Google Scholar]
- Bonin G, and Bailey P. (1947) The Neocortex of Macaca Mulatta. University of Illinois Press. [Google Scholar]
- Brodmann K (1905) Beitraege zur histologischen Lokalisation der Grosshirnrinde: dritte Mitteilung: Die Rindenfelder der niederen Affen. J fuer Psychol und Neurol 4:5/6:, 177–226. [Google Scholar]
- Brodmann K (1909) Vergleichende Lokalisationslehre der Grosshirnrinde in ihren Prinzipien dargestellt auf Grund des Zellenbaues. Barth. [Google Scholar]
- Burkhalter A, and Bernardo KL. (1989) Organization of corticocortical connections in human visual cortex. Proc Natl Acad Sci U S A. 86, 1071–1075. [DOI] [PMC free article] [PubMed] [Google Scholar]
- Callaway EM (1998) Local circuits in primary visual cortex of the macaque monkey. Annu Rev Neurosci 21, 47–74. [DOI] [PubMed] [Google Scholar]
- Catani M, and Sandrone S. (2015) Brain Renaissance: From Vesalius to Modern Neuroscience. Oxford: Oxford University Press, 304 pp. [Google Scholar]
- Churchland PS, and Sejnowski TJ. (1988) Perspectives on cognitive neuroscience. Science. 242, 741–745. [DOI] [PubMed] [Google Scholar]
- Coalson T, Van Essen DC, and Glasser MF. (2018) Lost in space: The impact of traditional neuroimaging methods on the spatial localization of cortical areas Proc Natl Acad Sci June 20, 2018. 201801582; published ahead of print: 10.1073/pnas.1801582115. [DOI] [PMC free article] [PubMed] [Google Scholar]
- Cohen AL, Fair DA, Dosenbach NU, Miezin FM, Dierker D, Van Essen DC, Schlaggar BL, and Petersen SE. (2008) Defining functional areas in individual human brains using resting functional connectivity MRI. Neuroimage. 41,45–57. [DOI] [PMC free article] [PubMed] [Google Scholar]
- Conway BR, Moeller S, and Tsao DY. (2007) Specialized color modules in macaque extrastriate cortex. Neuron. 56, 560–573. [DOI] [PMC free article] [PubMed] [Google Scholar]
- Craddock RC, James GA, Holtzheimer PE 3rd, Hu XP, and Mayberg HS. (2012) A whole brain fMRI atlas generated via spatially constrained spectral clustering. Hum Brain Mapp. 33, 1914–1928. [DOI] [PMC free article] [PubMed] [Google Scholar]
- D’Souza RD, Meier AM, Bista P, Wang Q, and Burkhalter A. (2016) Recruitment of inhibition and excitation across mouse visual cortex depends on the hierarchy of interconnecting areas. Elife. 5. [DOI] [PMC free article] [PubMed] [Google Scholar]
- Daniel PM, and Whitteridge D. (1961) The representation of the visual field on the cerebral cortex in monkeys. J Physiol 159, 203–221. [DOI] [PMC free article] [PubMed] [Google Scholar]
- DeAngelis GC, Cumming BG, and Newsome WT. (1998) Cortical area MT and the perception of stereoscopic depth. Nature. 394, 677–680. [DOI] [PubMed] [Google Scholar]
- Dick F, Tierney AT, Lutti A, Josephs O, Sereno MI, and Weiskopf N. (2012) In vivo functional and myeloarchitectonic mapping of human primary auditory areas. J Neurosci 32, 16095–16105. [DOI] [PMC free article] [PubMed] [Google Scholar]
- Ding SL, Royall JJ, Sunkin SM, Ng L, Facer BA, Lesnar P, Guillozet-Bongaarts A, McMurray B, Szafer A, Dolbeare TA, Stevens A, Tirrell L, Benner T, Caldejon S, Dalley RA, Dee N, Lau C, Nyhus J, Reding M, Riley ZL, Sandman D, Shen E, van der Kouwe A, Varjabedian A, Write M, Zollei L, Dang C, Knowles JA, Koch C, Phillips JW, Sestan N, Wohnoutka P, Zielke HR, Hohmann JG, Jones AR, Bernard A, Hawrylycz MJ, Hof PR, Fischl B, and Lein ES. (2016) Comprehensive cellular-resolution atlas of the adult human brain. J Comp Neurol 524, 3127–3481. [DOI] [PMC free article] [PubMed] [Google Scholar]
- Donahue CJ, Glasser MF, Preuss TM, Rilling JK, and Van Essen DC. (2018) A quantitative assessment of prefrontal cortex in humans relative to nonhuman primates. Proc Natl Acad Sci in revision. [DOI] [PMC free article] [PubMed] [Google Scholar]
- Donahue CJ, Sotiropoulos SN, Jbabdi S, Hernandez-Fernandez M, Behrens TE, Dyrby TB, Coalson T, Kennedy H, Knoblauch K, Van Essen DC, and Glasser MF. (2016) Using Diffusion Tractography to Predict Cortical Connection Strength and Distance: A Quantitative Comparison with Tracers in the Monkey. J Neurosci 36, 6758–6770. [DOI] [PMC free article] [PubMed] [Google Scholar]
- Dubois J, Galdi Pl., Han Y, Paul LK, Adolphs R (2017) Predicting personality traits from resting-state fMRI | bioRxiv. https://http://www.biorxiv.org/content/early/2017/11/07/215129.
- Ebner FF, and Kaas JH. (2015) Somatosensory system In: The Rat Nervous System, Paxinos G. Eed), Elsevier, London. [Google Scholar]
- Edwards LJ, Kirilina E, Mohammadi S, and Weiskopf N. (2018) Microstructural imaging of human neocortex in vivo. Neuroimage Mar 24 pii: S1053-8119. [DOI] [PubMed] [Google Scholar]
- Eickhoff SB, Constable RT, and Yeo BT. (2017) Topographic organization of the cerebral cortex and brain cartography. Neuroimage. [DOI] [PMC free article] [PubMed] [Google Scholar]
- Falchier A, Clavagnier S, Barone P, and Kennedy H. (2002) Anatomical evidence of multimodal integration in primate striate cortex. J Neurosci 22, 5749–5759. [DOI] [PMC free article] [PubMed] [Google Scholar]
- Fan L, Li H, Zhuo J, Zhang Y, Wang J, Chen L, Yang Z, Chu C, Xie S, Laird AR, Fox PT, Eickhoff SB, Yu C, and Jiang T. (2016) The Human Brainnetome Atlas: A New Brain Atlas Based on Connectional Architecture. Cereb Cortex. 26, 3508–3526. [DOI] [PMC free article] [PubMed] [Google Scholar]
- Felleman DJ, and Van Essen DC. (1991) Distributed hierarchical processing in the primate cerebral cortex. Cereb Cortex. 1, 1–47. [DOI] [PubMed] [Google Scholar]
- Ferry AT, Ongur D, An X, and Price JL. (2000) Prefrontal cortical projections to the striatum in macaque monkeys: evidence for an organization related to prefrontal networks. J Comp Neurol 425, 447–470. [DOI] [PubMed] [Google Scholar]
- Finn ES, Shen X, Scheinost D, Rosenberg MD, Huang J, Chun MM, Papademetris X, and Constable RT. (2015) Functional connectome fingerprinting: identifying individuals using patterns of brain connectivity. Nat Neurosci 18, 1664–1671. [DOI] [PMC free article] [PubMed] [Google Scholar]
- Fischl B, and Dale AM. (2000) Measuring the thickness of the human cerebral cortex from magnetic resonance images. Proc Natl Acad Sci U S A. 97, 11050–11055. [DOI] [PMC free article] [PubMed] [Google Scholar]
- Fischl B, Rajendran N, Busa E, Augustinack J, Hinds O, Yeo BT, Mohlberg H, Amunts K, and Zilles K. (2008) Cortical folding patterns and predicting cytoarchitecture. Cereb Cortex. 18, 1973–1980. [DOI] [PMC free article] [PubMed] [Google Scholar]
- Fischl B, and Sereno MI. (2018) Microstructural parcellation of the human brain. Neuroimage. [DOI] [PMC free article] [PubMed] [Google Scholar]
- Freiwald WA, and Tsao DY. (2010) Functional compartmentalization and viewpoint generalization within the macaque face-processing system. Science. 330, 845–851. [DOI] [PMC free article] [PubMed] [Google Scholar]
- Galuske RA, Schlote W, Bratzke H, and Singer W. (2000) Interhemispheric asymmetries of the modular structure in human temporal cortex. Science. 289, 1946–1949. [DOI] [PubMed] [Google Scholar]
- Gămănut R, Kennedy H, Toroczkai Z, Ercsey-Ravasz M, Van Essen DC, Knoblauch K, and Burkhalter A. (2018) The mouse cortical connectome characterized by an ultra dense cortical graph maintains specificity by distinct connectivity profiles. Neuron. 97, 698–715. [DOI] [PMC free article] [PubMed] [Google Scholar]
- Gamberini M, Galletti C, Bosco A, Breveglieri R, and Fattori P. (2011) Is the medial posterior parietal area V6A a single functional area? J Neurosci 31,5145–5157. [DOI] [PMC free article] [PubMed] [Google Scholar]
- Ganepola T, Nagy Z, Ghosh A, Papadopoulo T, Alexander DC, and Sereno MI. (2017) Using diffusion MRI to discriminate areas of cortical grey matter. Neuroimage. [DOI] [PMC free article] [PubMed] [Google Scholar]
- Gardumi A, Ivanov D, Havlicek M, Formisano E, and Uludag K. (2017) Tonotopic maps in human auditory cortex using arterial spin labeling. Hum Brain Mapp. 38, 1140–1154. [DOI] [PMC free article] [PubMed] [Google Scholar]
- Garrett ME, Nauhaus I, Marshel JH, and Callaway EM. (2014) Topography and areal organization of mouse visual cortex. J Neurosci 34, 12587–12600. [DOI] [PMC free article] [PubMed] [Google Scholar]
- Gattass R, Gross CG, and Sandell JH. (1981) Visual topography of V2 in the macaque. J Comp Neurol 201, 519–539. [DOI] [PubMed] [Google Scholar]
- Geschwind N (1974) Disconnexion syndromes in animals and man In Selected papers on language and the brain (pp. 105–236). Springer; Netherlands. [Google Scholar]
- Glasser MF, Coalson T, Bijsterbosch JD, Harrison SJ, Harms MP, Anticevic A, Van Essen DC, and Smith SM. (2018) Using temporal ICA to selectively remove global noise while preserving global signal in functional MRI data. Proc Natl Acad Sci (submitted). [DOI] [PMC free article] [PubMed] [Google Scholar]
- Glasser MF, Coalson TS, Robinson EC, Hacker CD, Harwell J, Yacoub E, Ugurbil K, Andersson J, Beckmann CF, Jenkinson M, Smith SM, and Van Essen DC. (2016b) A multi-modal parcellation of human cerebral cortex. Nature. 536, 171–178. [DOI] [PMC free article] [PubMed] [Google Scholar]
- Glasser MF, Goyal MS, Preuss TM, Raichle ME, and Van Essen DC. (2014) Trends and properties of human cerebral cortex: correlations with cortical myelin content. Neuroimage. 93 Pt 2, 165–175. [DOI] [PMC free article] [PubMed] [Google Scholar]
- Glasser MF, Smith SM, Marcus DS, Andersson JL, Auerbach EJ, Behrens TE, Coalson TS, Harms MP, Jenkinson M, Moeller S, Robinson EC, Sotiropoulos SN, Xu J, Yacoub E, Ugurbil K, and Van Essen DC. (2016a) The Human Connectome Project’s neuroimaging approach. Nat Neurosci 19, 1175–1187. [DOI] [PMC free article] [PubMed] [Google Scholar]
- Glasser MF, and Van Essen DC. (2011) Mapping human cortical areas in vivo based on myelin content as revealed by T1- and T2-weighted MRI. J Neurosci 31, 11597–11616. [DOI] [PMC free article] [PubMed] [Google Scholar]
- Glickfield LL, and Olsen SR. (2017) Higher-order areas of he mouse visual cortex. Ann Rev Vis Neurosci 3, 251–273. [DOI] [PubMed] [Google Scholar]
- Gordon EM, Laumann TO, Adeyemo B, Huckins JF, Kelley WM, and Petersen SE. (2016) Generation and Evaluation of a Cortical Area Parcellation from Resting-State Correlations. Cereb Cortex. 26, 288–303. [DOI] [PMC free article] [PubMed] [Google Scholar]
- Goulas A, Schaefer A, and Margulies DS. (2015) The strength of weak connections in the macaque cortico-cortical network. Brain Struct Funct 220, 2939–2951. [DOI] [PubMed] [Google Scholar]
- Grimaldi P, Saleem KS, and Tsao D. (2016) Anatomical Connections of the Functionally Defined “Face Patches” in the Macaque Monkey. Neuron. 90, 1325–1342. [DOI] [PMC free article] [PubMed] [Google Scholar]
- Hagler DJ Jr., Riecke L, and Sereno MI. (2007) Parietal and superior frontal visuospatial maps activated by pointing and saccades. Neuroimage. 35, 1562–1577. [DOI] [PMC free article] [PubMed] [Google Scholar]
- Hansen KA, Kay KN, and Gallant JL. (2007) Topographic organization in and near human visual area V4. J Neurosci 27, 11896–11911. [DOI] [PMC free article] [PubMed] [Google Scholar]
- Harris JA, Mihalas S, Hirokawa KE, Whitesell JD, and Knox J. (2018) The organization of intracortical connections by layer and cell class in the mouse brain https://http://www.biorxiv.org/content/early/2018/04/01/292961.
- Harvey BM, Klein BP, Petridou N, and Dumoulin SO. (2013) Topographic representation of numerosity in the human parietal cortex. Science. 341, 1123–1126. [DOI] [PubMed] [Google Scholar]
- Hashikawa T, Nakatomi R, and Iriki A. (2015) Current models of the marmoset brain. Neurosci Res 93, 116–127. [DOI] [PubMed] [Google Scholar]
- Haxby JV (2012) Multivariate pattern analysis of fMRI: the early beginnings. Neuroimage. 62, 852–855. [DOI] [PMC free article] [PubMed] [Google Scholar]
- Haxby JV, Connolly M, and Guntupalli JS. (2014) Decoding neural representational spaces using multivariate pattern analysis. Annu Rev Neurosci 37, 435–456. [DOI] [PubMed] [Google Scholar]
- Herculano-Houzel S, Watson C, and Paxinos G. (2013) Distribution of neurons in functional areas of the mouse cerebral cortex reveals quantitatively different cortical zones. Front Neuroanat 7, 35. [DOI] [PMC free article] [PubMed] [Google Scholar]
- Horton JC, and Hubel DH. (1981) Regular patchy distribution of cytochrome oxidase staining in primary visual cortex of macaque monkey. Nature. 292, 762–764. [DOI] [PubMed] [Google Scholar]
- Hubel DH, and Wiesel TN. (1977) Ferrier lecture. Functional architecture of macaque monkey visual cortex. Proc R Soc Lond B Biol Sci 198, 1–59. [DOI] [PubMed] [Google Scholar]
- Humphries C, Liebenthal E, and Binder JR. (2010) Tonotopic organization of human auditory cortex. Neuroimage. 50, 1202–1211. [DOI] [PMC free article] [PubMed] [Google Scholar]
- Huth AG, de Heer WA, Griffiths TL, Theunissen FE, and Gallant JL. (2016) Natural speech reveals the semantic maps that tile human cerebral cortex. Nature. 532, 453–458. [DOI] [PMC free article] [PubMed] [Google Scholar]
- Innocenti GM, and Price DJ. (2005) Exuberance in the development of cortical networks. Nat Rev Neurosci 6, 955–965. [DOI] [PubMed] [Google Scholar]
- Jain N, Catania KC, and Kaas JH. (1998) A histologically visible representation of the fingers and palm in primate area 3b and its immutability following long-term deafferentations. Cereb Cortex. 8, 227–236. [DOI] [PubMed] [Google Scholar]
- Janssens T, Zhu Q, Popivanov ID, and Vanduffel W. (2014) Probabilistic and single-subject retinotopic maps reveal the topographic organization of face patches in the macaque cortex. J Neurosci 34, 10156–10167. [DOI] [PMC free article] [PubMed] [Google Scholar]
- Jbabdi S, Sotiropoulos SN, and Behrens TE. (2013) The topographic connectome. Curr Opin Neurobiol 23, 207–215. [DOI] [PMC free article] [PubMed] [Google Scholar]
- Jbabdi S, Sotiropoulos SN, Haber SN, Van Essen DC, and Behrens TE. (2015) Measuring macroscopic brain connections in vivo. Nat Neurosci 18, 1546–1555. [DOI] [PubMed] [Google Scholar]
- Ji W, Gămănut R, Bista P, D’Souza RD, Wang Q, and Burkhalter A. (2015) Modularity in the Organization of Mouse Primary Visual Cortex. Neuron. 87, 632–643. [DOI] [PMC free article] [PubMed] [Google Scholar]
- Johansen-Berg H, Behrens TE, Robson MD, Drobnjak I, Rushworth MF, Brady JM, Smith SM, Higham DJ, and Matthews PM. (2004) Changes in connectivity profiles define functionally distinct regions in human medial frontal cortex. Proc Natl Acad Sci U S A. 101, 13335–13340. [DOI] [PMC free article] [PubMed] [Google Scholar]
- Jones EG, Coulter JD, and Hendry SH. (1978) Intracortical connectivity of architectonic fields in the somatic sensory, motor and parietal cortex of monkeys. J Comp Neurol 181, 291–347. [DOI] [PubMed] [Google Scholar]
- Kaas JH (1983) What, if anything, is SI? Organization of first somatosensory area of cortex. Physiol Rev 63, 206–231. [DOI] [PubMed] [Google Scholar]
- Kaas JH (2013) Scholarpedia. 8, 8238. [Google Scholar]
- Kanwisher N, and Yovel G. (2006) The fusiform face area: a cortical region specialized for the perception of faces. Philos Trans R Soc Lond B Biol Sci 361, 2109–2128. [DOI] [PMC free article] [PubMed] [Google Scholar]
- Kolster H, Janssens T, Orban GA, and Vanduffel W. (2014) The retinotopic organization of macaque occipitotemporal cortex anterior to V4 and caudoventral to the middle temporal (MT) cluster. J Neurosci 34, 10168–10191. [DOI] [PMC free article] [PubMed] [Google Scholar]
- Kolster H, Mandeville JB, Arsenault JT, Ekstrom LB, Wald LL, and Vanduffel W. (2009) Visual field map clusters in macaque extrastriate visual cortex. J Neurosci 29, 7031–7039. [DOI] [PMC free article] [PubMed] [Google Scholar]
- Kuehn E, Dinse J, Jakobsen E, Long X, Schafer A, Bazin PL, Villringer A, Sereno MI, and Margulies DS. (2017) Body Topography Parcellates Human Sensory and Motor Cortex. Cereb Cortex. 27, 3790–3805. [DOI] [PMC free article] [PubMed] [Google Scholar]
- Lafer-Sousa R, and Conway BR. (2013) Parallel, multi-stage processing of colors, faces and shapes in macaque inferior temporal cortex. Nat Neurosci 16, 1870–1878. [DOI] [PMC free article] [PubMed] [Google Scholar]
- Lassek AM (1940) The human pyramidal tract. II. A numerical investigation of the Betz cells of the motor area. Arch. Neurol. Psych 46, 718–724. [Google Scholar]
- Laumann TO, Gordon EM, Adeyemo B, Snyder AZ, Joo SJ, Chen MY, Gilmore AW, McDermott KB, Nelson SM, Dosenbach NU, Schlaggar BL, Mumford JA, Poldrack RA, and Petersen SE. (2015) Functional System and Areal Organization of a Highly Sampled Individual Human Brain. Neuron. 87, 657–670. [DOI] [PMC free article] [PubMed] [Google Scholar]
- Lefranc S, Roca P, Perrot M, Poupon C, Le Bihan D, Mangin JF, and Riviere D. (2016) Groupwise connectivity-based parcellation of the whole human cortical surface using watershed-driven dimension reduction. Med Image Anal 30, 11–29. [DOI] [PubMed] [Google Scholar]
- Lerch JP, Carroll JB, Dorr A, Spring S, Evans AC, Hayden MR, Sled JG, and Henkelman RM. (2008) Cortical thickness measured from MRI in the YAC128 mouse model of Huntington’s disease. Neuroimage. 41, 243–251. [DOI] [PubMed] [Google Scholar]
- LeVay S, Connolly M, Houde J, and Van Essen DC. (1985) The complete pattern of ocular dominance stripes in the striate cortex and visual field of the macaque monkey. J Neurosci 5, 486–501. [DOI] [PMC free article] [PubMed] [Google Scholar]
- Lewis JW, and Van Essen DC. (2000) Mapping of architectonic subdivisions in the macaque monkey, with emphasis on parieto-occipital cortex. J Comp Neurol 428, 79–111. [DOI] [PubMed] [Google Scholar]
- Li X, Zhu Q, Janssens T, Arsenault JT, and Vanduffel W. (2017) In Vivo Identification of Thick, Thin, and Pale Stripes of Macaque Area V2 Using Submillimeter Resolution (f)MRI at 3 T. Cereb Cortex. [DOI] [PubMed] [Google Scholar]
- Lindquist MA, Meng Loh J, Atlas LY, and Wager TD. (2009) Modeling the hemodynamic response function in fMRI: efficiency, bias and mis-modeling. Neuroimage. 45, S187–198. [DOI] [PMC free article] [PubMed] [Google Scholar]
- Liu C, Ye FQ, Yen CC, Newman JD, Glen D, Leopold DA, and Silva AC. (2017) A digital 3D atlas of the marmoset brain based on multi-modal MRI. Neuroimage. 169, 106–116. [DOI] [PMC free article] [PubMed] [Google Scholar]
- Livingstone MS, and Hubel DH. (1984a) Anatomy and physiology of a color system in the primate visual cortex. J Neurosci 4, 309–356. [DOI] [PMC free article] [PubMed] [Google Scholar]
- Livingstone MS, and Hubel DH. (1984b) Specificity of intrinsic connections in primate primary visual cortex. J Neurosci 4, 2830–2835. [DOI] [PMC free article] [PubMed] [Google Scholar]
- Magnain C, Augustinack JC, Konukoglu E, Frosch MP, Sakadzic S, Varjabedian A, Garcia N, Wedeen VJ, Boas DA, and Fischl B. (2015) Optical coherence tomography visualizes neurons in human entorhinal cortex. Neurophotonics. 2, 015004. [DOI] [PMC free article] [PubMed] [Google Scholar]
- Maguire WM, and Baizer JS. (1984) Visuotopic organization of the prelunate gyrus in rhesus monkey. J Neurosci 4, 1690–1704. [DOI] [PMC free article] [PubMed] [Google Scholar]
- Majka P, Chaplin TA, Yu HH, Tolpygo A, Mitra PP, Wojcik DK, and Rosa MG. (2016) Towards a comprehensive atlas of cortical connections in a primate brain: Mapping tracer injection studies of the common marmoset into a reference digital template. J Comp Neurol 524, 2161–2181. [DOI] [PMC free article] [PubMed] [Google Scholar]
- Margulies DS, Ghosh SS, Goulas A, Falkiewicz M, Huntenburg JM, Langs G, Bezgin G, Eickhoff SB, Castellanos FX, Petrides M, Jefferies E, and Smallwood J. (2016) Situating the default-mode network along a principal gradient of macroscale cortical organization. Proc Natl Acad Sci U S A. 113, 12574–12579. [DOI] [PMC free article] [PubMed] [Google Scholar]
- Markov NT, Ercsey-Ravasz MM, Lamy C, Ribeiro Gomes AR, Magrou L, Misery P, Giroud P, Dehay C, Toroczkai Z, Knoblauch K, Van Essen DC, and Kennedy H. (2012) The role of distance on the specificity of inter-areal connectivity in macaque cerebral cortex. Proc Natl Acad Sci 110, 5187–5192. [DOI] [PMC free article] [PubMed] [Google Scholar]
- Markov NT, Ercsey-Ravasz MM, Ribeiro Gomes AR, Lamy C, Magrou L, Vezoli J, Misery P, Falchier A, Quilodran R, Gariel MA, Sallet J, Gămănut R, Huissoud C, Clavagnier S, Giroud P, Sappey-Marinier D, Barone P, Dehay C, Toroczkai Z, Knoblauch K, Van Essen DC, and Kennedy H. (2014) A weighted and directed interareal connectivity matrix for macaque cerebral cortex. Cereb Cortex. 24, 17–36. [DOI] [PMC free article] [PubMed] [Google Scholar]
- Markov NT, Misery P, Falchier A, Lamy C, Vezoli J, Quilodran R, Gariel MA, Giroud P, Ercsey-Ravasz M, Pilaz LJ, Huissoud C, Barone P, Dehay C, Toroczkai Z, Van Essen DC, Kennedy H, and Knoblauch K. (2011) Weight consistency specifies regularities of macaque cortical networks. Cereb Cortex. 21, 1254–1272. [DOI] [PMC free article] [PubMed] [Google Scholar]
- Marques JP, Khabipova D, and Gruetter R. (2017) Studying cyto and myeloarchitecture of the human cortex at ultra-high field with quantitative imaging: R1, R2(*) and magnetic susceptibility. Neuroimage. 147, 152–163. [DOI] [PubMed] [Google Scholar]
- Mars RB, Jbabdi S, Sallet J, O’Reilly JX, Croxson PL, Olivier E, Noonan MP, Bergmann C, Mitchell AS, Baxter MG, Behrens TE, Johansen-Berg H, Tomassini V, Miller KL, and Rushworth MF. (2011) Diffusion-weighted imaging tractography-based parcellation of the human parietal cortex and comparison with human and macaque resting-state functional connectivity. J Neurosci 31, 4087–4100. [DOI] [PMC free article] [PubMed] [Google Scholar]
- Marshel JH, Garrett ME, Nauhaus I, and Callaway EM. (2011) Functional specialization of seven mouse visual cortical areas. Neuron. 72, 1040–1054. [DOI] [PMC free article] [PubMed] [Google Scholar]
- Maunsell JH, and Van Essen DC. (1987) Topographic organization of the middle temporal visual area in the macaque monkey: representational biases and the relationship to callosal connections and myeloarchitectonic boundaries. J Comp Neurol 266, 535–555. [DOI] [PubMed] [Google Scholar]
- McMahon DB, Jones AP, Bondar IV, and Leopold DA. (2014) Face-selective neurons maintain consistent visual responses across months. Proc Natl Acad Sci U S A. 111, 8251–8256. [DOI] [PMC free article] [PubMed] [Google Scholar]
- Meyers EM, Borzello M, Freiwald WA, and Tsao D. (2015) Intelligent information loss: the coding of facial identity, head pose, and non-face information in the macaque face patch system. J Neurosci 35, 7069–7081. [DOI] [PMC free article] [PubMed] [Google Scholar]
- Moerel M, De Martino F, and Formisano E. (2014) An anatomical and functional topography of human auditory cortical areas. Front Neurosci 8, 225. [DOI] [PMC free article] [PubMed] [Google Scholar]
- Morecraft RJ, Rockland KS, and Van Hoesen GW. (2000) Localization of area prostriata and its projection to the cingulate motor cortex in the rhesus monkey. Cereb Cortex. 10, 192–203. [DOI] [PubMed] [Google Scholar]
- Moreno-Dominguez D, Anwander A, and Knosche TR. (2014) A hierarchical method for whole-brain connectivity-based parcellation. Hum Brain Mapp. 35, 5000–5025. [DOI] [PMC free article] [PubMed] [Google Scholar]
- Nagy Z, Alexander DC, Thomas DL, Weskopf N, and Sereno MI. (2013) Using high angular resolution diffusion imaging data to discriminate cortical regions. PLoS ONE. 8, e63842. [DOI] [PMC free article] [PubMed] [Google Scholar]
- Nassi JJ, and Callaway EM. (2009) Parallel processing strategies of the primate visual system. Nat Rev Neurosci 10, 360–372. [DOI] [PMC free article] [PubMed] [Google Scholar]
- Nelson RJ, Sur M, Felleman DJ, and Kaas JH. (1980) Representations of the body surface in postcentral parietal cortex of Macaca fascicularis. J Comp Neurol 192, 611–643. [DOI] [PubMed] [Google Scholar]
- Newsome WT, and Allman JM. (1980) Interhemispheric connections of visual cortex in the owl monkey, Aotus trivirgatus, and the bushbaby, Galago senegalensis. J Comp Neurol 194, 209–233. [DOI] [PubMed] [Google Scholar]
- Newsome WT, and Pare EB. (1988) A selective impairment of motion perception following lesions of the middle temporal visual area (MT). J Neurosci 8, 2201–2211. [DOI] [PMC free article] [PubMed] [Google Scholar]
- Newsome WT, Wurtz RH, Dursteler MR, and Mikami A. (1985) Deficits in visual motion processing following ibotenic acid lesions of the middle temporal visual area of the macaque monkey. J Neurosci 5, 825–840. [DOI] [PMC free article] [PubMed] [Google Scholar]
- Nieuwenhuys R (2013) The myeloarchitectonic studies on the human cerebral cortex of the Vogt-Vogt school, and their significance for the interpretation of functional neuroimaging data. Brain Structure and Function, 218(2), pp. 303–352. [DOI] [PubMed] [Google Scholar]
- Nieuwenhuys R, Broere CA, and Cerliani L. (2015) A new myeloarchitectonic map of the human neocortex based on data from the Vogt-Vogt school. Brain Struct Funct 220, 2551–2573. [DOI] [PubMed] [Google Scholar]
- Oh SW, Harris JA, Ng L, Winslow B, Cain N, Mihalas S, Wang Q, Lau C, Kuan L, Henry AM, Mortrud MT, Ouellette B, Nguyen TN, Sorensen SA, Slaughterbeck CR, Wakeman W, Li Y, Feng D, Ho A, Nicholas E, Hirokawa KE, Bohn P, Joines KM, Peng H, Hawrylycz MJ, Phillips JW, Hohmann JG, Wohnoutka P, Gerfen CR, Koch C, Bernard A, Dang C, Jones AR, and Zeng H. (2014) A mesoscale connectome of the mouse brain. Nature. 508, 207–214. [DOI] [PMC free article] [PubMed] [Google Scholar]
- Olavarria JF, and Van Essen DC. (1997) The global pattern of cytochrome oxidase stripes in visual area V2 of the macaque monkey. Cereb Cortex. 7, 395–404. [DOI] [PubMed] [Google Scholar]
- Ongur D, Ferry AT, and Price JL. (2003) Architectonic subdivision of the human orbital and medial prefrontal cortex. J Comp Neurol 460, 425–449. [DOI] [PubMed] [Google Scholar]
- Orban GA, Zhu Q, and Vanduffel W. (2014) The transition in the ventral stream from feature to real-world entity representations. Front Psychol 5, 695. [DOI] [PMC free article] [PubMed] [Google Scholar]
- Palomero-Gallagher N, Vogt BA, Schleicher A, Mayberg HS, and Zilles K. (2009) Receptor architecture of human cingulate cortex: evaluation of the four-region neurobiological model. Hum Brain Mapp. 30, 2336–2355. [DOI] [PMC free article] [PubMed] [Google Scholar]
- Parisot S, Glocker B, Ktena SI, Arslan S, Schirmer MD, and Rueckert D. (2017) A flexible graphical model for multi-modal parcellation of the cortex. Neuroimage. 162, 226–248. [DOI] [PMC free article] [PubMed] [Google Scholar]
- Patel GH, Shulman GL, Baker JT, Akbudak E, Snyder AZ, Snyder LH, and Corbetta M. (2010) Topographic organization of macaque area LIP. Proc Natl Acad Sci U S A. 107, 4728–4733. [DOI] [PMC free article] [PubMed] [Google Scholar]
- Paxinos G, and Franklin K. (2008) The Mouse Brain in Stereotaxic Coordinates. Academic Press, 256 pp. [Google Scholar]
- Paxinos G, Huang XF, and Toga AW. (2000) The Rhesus Monkey Brain in Stereotaxic Coordinates. Academic Press, London. [Google Scholar]
- Paxinos G, Watson C, Petrides M, Rosa M, and Tokuno H. (2011) The Marmoset Brain in Stereotaxic Coordinates, 1st Edition, Academic Prss, 324 pp. [Google Scholar]
- Peters A, and Rockland KS. (2013) Cerebral Cortex Volume 10: Primary Visual Cortex in Primates, Springer, 558 pp. [Google Scholar]
- Petrides M, Tomaiuolo F, Yeterian EH, and Pandya DN. (2012) The prefrontal cortex: comparative architectonic organization in the human and the macaque monkey brains. Cortex. 48, 46–57. [DOI] [PubMed] [Google Scholar]
- Pinsk MA, Arcaro M, Weiner KS, Kalkus JF, Inati SJ, Gross CG, and Kastner S. (2009) Neural representations of faces and body parts in macaque and human cortex: a comparative FMRI study. J Neurophysiol 101,2581–2600. [DOI] [PMC free article] [PubMed] [Google Scholar]
- Pitzalis S, Fattori P, and Galletti C. (2015) The human cortical areas V6 and V6A. Vis Neurosci 32, E007. [DOI] [PubMed] [Google Scholar]
- Power JD, Cohen AL, Nelson SM, Wig GS, Barnes KA, Church JA, Vogel AC, Laumann TO, Miezin FM, Schlaggar BL, and Petersen SE. (2011) Functional network organization of the human brain. Neuron. 72, 665–678. [DOI] [PMC free article] [PubMed] [Google Scholar]
- Reveley C, Gruslys A, Ye FQ, Glen D, Samaha J, B ER, Saad Z, A KS, Leopold DA, and Saleem KS. (2017) Three-Dimensional Digital Template Atlas of the Macaque Brain. Cereb Cortex. 27, 4463–4477. [DOI] [PMC free article] [PubMed] [Google Scholar]
- Reveley C, Seth AK, Pierpaoli C, Silva AC, Yu D, Saunders RC, Leopold DA, and Ye FQ. (2015) Superficial white matter fiber systems impede detection of long-range cortical connections in diffusion MR tractography. Proc Natl Acad Sci U S A. 112, E2820–2828. [DOI] [PMC free article] [PubMed] [Google Scholar]
- Rivara CB, Sherwood CC, Bouras C, and Hof PR. (2003) Stereologic characterization and spatial distribution patterns of Betz cells in the human primary motor cortex. Anat Rec A Discov Mol Cell Evol Biol 270, 137–151. [DOI] [PubMed] [Google Scholar]
- Rosenke M, Wesiner KS, Barnett MA, Zilles K, Amunts K, and Grill-Spector K. (2017) Data on a cytoarchitectonic brain atlas: effects of brain template and a comparison to a multimodal atlas. Data Brief. 12, 237–332. [DOI] [PMC free article] [PubMed] [Google Scholar]
- Saleem KS, and Logothetis NK. (2006) A Combined MRI and Histology Atlas of the Rhesus Monkey Brain. Amsterdam: Academic Press; 2006. [Google Scholar]
- Salzman CD, Murasugi CM, Britten KH, and Newsome WT. (1992) Microstimulation in visual area MT: effects on direction discrimination performance. J Neurosci 12, 2331–2355. [DOI] [PMC free article] [PubMed] [Google Scholar]
- Sanchez-Panchuelo RM, Besle J, Mougin O, Gowland P, Bowtell R, Schluppeck D, and Francis S. (2014) Regional structural differences across functionally parcellated Brodmann areas of human primary somatosensory cortex. Neuroimage. 93 Pt 2, 221–230. [DOI] [PubMed] [Google Scholar]
- Sanchez-Panchuelo RM, Francis ST, Schluppeck D, and Bowtell RW. (2012) Correspondence of human visual areas identified using functional and anatomical MRI in vivo at 7 T. J Magn Reson Imaging. 35, 287–299. [DOI] [PubMed] [Google Scholar]
- Saxe R, Brett M, and Kanwisher N. (2006) Divide and conquer: a defense of functional localizers. Neuroimage. 30, 1088–1096; discussion 1097-1089. [DOI] [PubMed] [Google Scholar]
- Schaefer A, Kong R, Gordon EM, Laumann TO, Zuo XN, Holmes AJ, Eickhoff SB, and Yeo BTT. (2017) Local-Global Parcellation of the Human Cerebral Cortex from Intrinsic Functional Connectivity MRI. Cereb Cortex, 1–20. [DOI] [PMC free article] [PubMed] [Google Scholar]
- Schleicher A, Amunts K, Geyer S, Morosan P, and Zilles K. (1999) Observer-independent method for microstructural parcellation of cerebral cortex: A quantitative approach to cytoarchitectonics. Neuroimage. 9, 165–177. [DOI] [PubMed] [Google Scholar]
- Schleicher A, Morosan P, Amunts K, and Zilles K. (2009) Quantitative architectural analysis: a new approach to cortical mapping. J Autism Dev Disord. 39, 1568–1581. [DOI] [PubMed] [Google Scholar]
- Seltzer B, and Pandya DN. (1978) Afferent cortical connections and architectonics of the superior temporal sulcus and surrounding cortex in the rhesus monkey. Brain Res 149, 1–24. [DOI] [PubMed] [Google Scholar]
- Sereno MI, Dale AM, Reppas JB, Kwong KK, Belliveau JW, Brady TJ, Rosen BR, and Tootell RB. (1995) Borders of multiple visual areas in humans revealed by functional magnetic resonance imaging. Science. 268, 889–893. [DOI] [PubMed] [Google Scholar]
- Sereno MI, and Huang RS. (2006) A human parietal face area contains aligned head-centered visual and tactile maps. Nat Neurosci 9, 1337–1343. [DOI] [PubMed] [Google Scholar]
- Sereno MI, Lutti A, Weiskopf N, and Dick F. (2013) Mapping the human cortical surface by combining quantitative T(1) with retinotopy. Cereb Cortex. 23, 2261–2268. [DOI] [PMC free article] [PubMed] [Google Scholar]
- Sereno MI, McDonald CT, and Allman JM. (1994) Analysis of retinotopic maps in extrastriate cortex. Cereb Cortex. 4, 601–620. [DOI] [PubMed] [Google Scholar]
- Sereno MI, McDonald CT, and Allman JM. (2015) Retinotopic organization of extrastriate cortex in the owl monkey--dorsal and lateral areas. Vis Neurosci 32, E021. [DOI] [PMC free article] [PubMed] [Google Scholar]
- Shen X, Tokoglu F, Papademetris X, and Constable RT. (2013) Groupwise whole-brain parcellation from resting-state fMRI data for network node identification. Neuroimage. 82, 403–415. [DOI] [PMC free article] [PubMed] [Google Scholar]
- Sincich LC, and Horton JC. (2005) The circuitry of V1 and V2: integration of color, form, and motion. Annu Rev Neurosci 28, 303–326. [DOI] [PubMed] [Google Scholar]
- Smith SM, Fox PT, Miller KL, Glahn DC, Fox PM, Mackay CE, Filippini N, Watkins KE,Toro R, Laird AR, and Beckmann CF. (2009) Correspondence of the brain’s functional architecture during activation and rest. Proc Natl Acad Sci U S A. 106, 13040–13045. [DOI] [PMC free article] [PubMed] [Google Scholar]
- Smith SM, Miller KL, Moeller S, Xu J, Auerbach EJ, Woolrich MW, Beckmann CF, Jenkinson M, Andersson J, Glasser MF, Van Essen DC, Feinberg DA, Yacoub ES, and Ugurbil K. (2012) Temporally-independent functional modes of spontaneous brain activity. Proc Natl Acad Sci U S A. 109, 3131–3136. [DOI] [PMC free article] [PubMed] [Google Scholar]
- Smith SM, Vidaurre D, Beckmann CF, Glasser MF, Jenkinson M, Miller KL, Nichols TE, Robinson EC, Salimi-Khorshidi G, Woolrich MW, Barch DM, Ugurbil K, and Van Essen DC. (2013) Functional connectomics from resting-state fMRI. Trends Cogn Sci 17, 666–682. [DOI] [PMC free article] [PubMed] [Google Scholar]
- Sood MR, and Sereno MI. (2016) Areas activated during naturalistic reading comprehension overlap topological visual, auditory, and somatotomotor maps. Hum Brain Mapp. 37, 2784–2810. [DOI] [PMC free article] [PubMed] [Google Scholar]
- Tobyne SM, Osher DE, Michalka SW, and Somers DC. (2017) Sensory-biased attention networks in human lateral frontal cortex revealed by intrinsic functional connectivity. Neuroimage. 162, 362–372. [DOI] [PMC free article] [PubMed] [Google Scholar]
- Triarhou LC (2007) A proposed number system for the 107 cortical areas of Economo and Koskinas, and Brodmann area correlations. Stereotact Funct Neurosurg 85, 204–215. [DOI] [PubMed] [Google Scholar]
- Tsao DY, Moeller S, and Freiwald WA. (2008) Comparing face patch systems in macaques and humans. Proc Natl Acad Sci U S A. 105, 19514–19519. [DOI] [PMC free article] [PubMed] [Google Scholar]
- Tungaraza RL, Mehta SH, Haynor DR, and Grabowski TJ. (2015) Anatomically informed metrics for connectivity-based cortical parcellation from diffusion MRI. IEEE J Biomed Health Inform. 19, 1375–1383. [DOI] [PMC free article] [PubMed] [Google Scholar]
- Ungerleider LG, and Desimone R. (1986a) Cortical connections of visual area MT in the macaque. J Comp Neurol 248, 190–222. [DOI] [PubMed] [Google Scholar]
- Ungerleider LG, and Desimone R. (1986b) Projections to the superior temporal sulcus from the central and peripheral field representations of V1 and V2. J Comp Neurol 248, 147–163. [DOI] [PubMed] [Google Scholar]
- Van Essen DC (1985) Functional organization or primate visual cortex In: Cerebral Cortex, Vol. 3, Jones EG and Peters A, eds., Plenum Press, NY, pp. 259–329. [Google Scholar]
- Van Essen DC (2012) Cortical cartography and Caret software. Neuroimage. 62, 757–764. [DOI] [PMC free article] [PubMed] [Google Scholar]
- Van Essen DC (2013) Cartography and connectomes. Neuron. 80, 775–790. [DOI] [PMC free article] [PubMed] [Google Scholar]
- Van Essen DC, Glasser MF, Dierker DL, and Harwell J. (2012) Cortical parcellations of the macaque monkey analyzed on surface-based atlases. Cereb Cortex. 22, 2227–2240. [DOI] [PMC free article] [PubMed] [Google Scholar]
- Van Essen DC, Jbabdi S, Sotiropoulos SN, Chen C, Dikranian K, Coalson T, Harwell J, Behrens TEJ, and Glasser MF. (2014) Mapping connections in humans and nonhuman primates: Aspirations and challenges for diffusion imaging In: Diffusion MRI (2nd ed), pp. 337–358. [Google Scholar]
- Van Essen DC, and Maunsell JH. (1980) Two-dimensional maps of the cerebral cortex. J Comp Neurol 191, 255–281. [DOI] [PubMed] [Google Scholar]
- Van Essen DC, and Maunsell JHR. (1983) Hierarchical organization and functional streams in the visual cortex. Trends in Neurosci 6, 370–375. [Google Scholar]
- Van Essen DC, Newsome WT, and Maunsell JH. (1984) The visual field representation in striate cortex of the macaque monkey: asymmetries, anisotropies, and individual variability. Vision Res 24, 429–448. [DOI] [PubMed] [Google Scholar]
- Van Essen DC, Newsome WT, Maunsell JH, and Bixby JL. (1986) The projections from striate cortex (V1) to areas V2 and V3 in the macaque monkey: asymmetries, areal boundaries, and patchy connections. J Comp Neurol 244, 451–480. [DOI] [PubMed] [Google Scholar]
- Van Essen DC, Smith SM, Barch DM, Behrens TE, Yacoub E, and Ugurbil K. (2013) The WU-Minn Human Connectome Project: an overview. Neuroimage. 80, 62–79. [DOI] [PMC free article] [PubMed] [Google Scholar]
- Vanduffel W, Zhu Q, and Orban GA. (2014) Monkey cortex through fMRI glasses. Neuron. 83, 533–550. [DOI] [PMC free article] [PubMed] [Google Scholar]
- Verhoef BE, Bohon KS, and Conway BR. (2015) Functional architecture for disparity in macaque inferior temporal cortex and its relationship to the architecture for faces, color, scenes, and visual field. J Neurosci 35, 6952–6968. [DOI] [PMC free article] [PubMed] [Google Scholar]
- Vogt C (1919) Allgemeinere ergebnisse unserer hirnforschung. J. Psychol. Neurol 25, 279–462. [Google Scholar]
- von Economo CF, and Koskinos GN. (1925) Die cytoarchitektonik der hirnrinde des erwachsenen menschen. J. Springer. [Google Scholar]
- Wandell BA, and Winawer J. (2011) Imaging retinotopic maps in the human brain. Vision Res 51, 718–737. [DOI] [PMC free article] [PubMed] [Google Scholar]
- Wang H, Magnain C, Wang R, Dubb J, Varjabedian A, Tirrell LS, Stevens A, Augustinack JC, Konukoglu E, Aganj I, Frosch MP, Schmahmann JD, Fischl B, and Boas DA. (2018) as-PSOCT: Volumetric microscopic imaging of human brain architecture and connectivity. Neuroimage. 165, 56–68. [DOI] [PMC free article] [PubMed] [Google Scholar]
- Wang L, Mruczek RE, Arcaro MJ, and Kastner S. (2015) Probabilistic Maps of Visual Topography in Human Cortex. Cereb Cortex. 25, 3911–3931. [DOI] [PMC free article] [PubMed] [Google Scholar]
- Wang Q, and Burkhalter A. (2007) Area map of mouse visual cortex. J Comp Neurol 502, 339–357. [DOI] [PubMed] [Google Scholar]
- Wang Q, Chen R, JaJa J, Jin Y, Hong LE, and Herskovits EH. (2016) Connectivity-Based Brain Parcellation: A Connectivity-Based Atlas for Schizophrenia Research. Neuroinformatics. 14, 83–97. [DOI] [PMC free article] [PubMed] [Google Scholar]
- Wang Q, Gao E, and Burkhalter A. (2011) Gateways of ventral and dorsal streams in mouse visual cortex. J Neurosci 31, 1905–1918. [DOI] [PMC free article] [PubMed] [Google Scholar]
- Wang Q, Sporns O, and Burkhalter A. (2012) Network analysis of corticocortical connections reveals ventral and dorsal processing streams in mouse visual cortex. J Neurosci 32, 4386–4399. [DOI] [PMC free article] [PubMed] [Google Scholar]
- Watson C, Paxinos G, and Puelles L. (2012) The Mouse Nervous System. Elsevier, 814, pp. [Google Scholar]
- Weller RE, and Kaas JH. (1987) Subdivisions and connections of inferior temporal cortex in owl monkeys. J Comp Neurol 256, 137–172. [DOI] [PubMed] [Google Scholar]
- Wig GS, Laumann TO, and Petersen SE. (2014) An approach for parcellating human cortical areas using resting-state correlations. Neuroimage. 93 Pt 2, 276–291. [DOI] [PMC free article] [PubMed] [Google Scholar]
- Woolsey CN (1958) Organization of Somatic Sensory and Motor Areas of the Cerebral Cortex In: Biological and Biochemical Bases of Behavior, Harlow HF and Woolsey CN eds, University of Wisconsin Press, Madison. [Google Scholar]
- Woolsey TA, and Van der Loos H. (1970) The structural organization of layer IV in the somatosensory region (SI) of mouse cerebral cortex. The description of a cortical field composed of discrete cytoarchitectonic units. Brain Res 17, 205–242. [DOI] [PubMed] [Google Scholar]
- Yeo BT, Krienen FM, Sepulcre J, Sabuncu MR, Lashkari D, Hollinshead M, Roffman JL, Smoller JW, Zollei L, Polimeni JR, Fischl B, Liu H, and Buckner RL. (2011) The organization of the human cerebral cortex estimated by intrinsic functional connectivity. J Neurophysiol 106, 1125–1165. [DOI] [PMC free article] [PubMed] [Google Scholar]
- Ypma RJ, and Bullmore ET. (2016) Statistical Analysis of Tract-Tracing Experiments Demonstrates a Dense, Complex Cortical Network in the Mouse. PLoS Comput Biol 12, e1005104. [DOI] [PMC free article] [PubMed] [Google Scholar]
- Zeki S (2004) Thirty years of a very special visual area, Area V5. J Physiol 557, 1–2. [DOI] [PMC free article] [PubMed] [Google Scholar]
- Zhou H, Friedman HS, and von der Heydt R. (2000) Coding of border ownership in monkey visual cortex. J Neurosci 20, 6594–6611. [DOI] [PMC free article] [PubMed] [Google Scholar]
- Zhu Q, and Vanduffel W. (2018) A new view of dorsal visual cortex in macaques revealed by submillimeter fMRI. https://http://www.biorxiv.org/content/early/2018/03/15/283051. [DOI] [PMC free article] [PubMed]
- Zilles K, and Amunts K. (2009) Receptor mapping: architecture of the human cerebral cortex. Curr Opin Neurol 22, 331–339. [DOI] [PubMed] [Google Scholar]
- Zilles K, and Amunts K. (2010) Centenary of Brodmann’s map-conception and fate. Nat Rev Neurosci 11, 139–145. [DOI] [PubMed] [Google Scholar]
- Zingg B, Hintiryan H, Gou L, Song MY, Bay M, Bienkowski MS, Foster NN, Yamashita S, Bowman I, Toga AW, and Dong HW. (2014) Neural networks of the mouse neocortex. Cell. 156, 1096–1111. [DOI] [PMC free article] [PubMed] [Google Scholar]
Associated Data
This section collects any data citations, data availability statements, or supplementary materials included in this article.