Abstract
Non-hazardous solid materials from industrial processes, once regarded as waste and disposed in landfills, offer numerous environmental and economic advantages when put to beneficial uses (BUs). Proper management of these industrial non-hazardous secondary materials (INSM) requires estimates of their probable environmental impacts among disposal as well as BU options. The U.S. Environmental Protection Agency (EPA) has recently approved new analytical methods (EPA Methods 1313–1316) to assess leachability of constituents of potential concern in these materials. These new methods are more realistic for many disposal and BU options than historical methods, such as the toxicity characteristic leaching protocol. Experimental data from these new methods are used to parameterize a chemical fate and transport (F&T) model to simulate long-term environmental releases from flue gas desulfurization gypsum (FGDG) when disposed of in an industrial landfill or beneficially used as an agricultural soil amendment. The F&T model is also coupled with optimization algorithms, the Beneficial Use Decision Support System(BUDSS), under development by EPA to enhance INSM management.
Keywords: Industrial non-hazardous secondary materials, Fate and transport model, Beneficial uses, Beneficial use decision support system
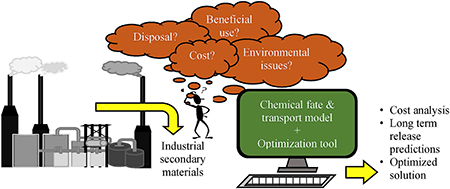
Graphical abstract
1. Introduction
The generation and accumulation of industrial non-hazardous secondary materials (INSM), historically considered “waste,” in large quantities may lead to risks for the environment. The proper management approach views these INSM as potential resources that could be put to beneficial use (BU) and lead to a better environment. Novel techniques, modeling, and quantitative decision support capabilities are tools that can be used to support decision-making on BU. The maximum use of the material with a minimum environmental and health impact and the lowest practical cost are essential components of an optimized INSM management approach. Even though the impact of beneficial uses of INSM on human and animal health is an important factor, this article focuses mainly on assessing the associated environmental release and cost.
As part of the proper INSM management approach, the Environmental Protection Agency (EPA) has identified significant beneficial uses of coal combustion residues, municipal solid waste, construction and demolition waste, mine tailings, and other materials that are often disposed in landfills. All of these applications involve the replacement of virgin/conventional materials by materials typically thought of as waste.
These INSM frequently contain constituents of potential concern (CPC) that are either toxic (e.g., As, Hg, Pg, Cd, Cr) or may have health consequences (e.g., Ba, Ni, Sr, Zn). The assessment of the extent to which these CPC might be released into the environment is of obvious importance to informed decisions regarding disposal or BU options. These CPC may accumulate in soils or be mobilized in pore water and groundwater, thereby posing risks to receptors.
Therefore, more realistic and sophisticated simulation and optimization techniques are essential to support decision-making on re-use of INSM. Several recent studies reported the use of simulation and optimization techniques and tools that can be used in solid waste management (Lu et al., 2009, Mir et al., 2016, Park, 2014, Park and Chertow, 2014, Puig et al., 2013). Among those, only few have considered the re-use applications of INSM. In some studies, the technical, economic and behavioral factors of INSM have been considered for optimization (Park, 2014), while some have used life cycle assessmentmethodology (Puig et al., 2013). Park and Chertow (2014) introduced a new tool named “the reuse potential indicator” to identify the re-use potential of a waste material considering the properties of the materials and the associated cost. However, a study of combined fate and transportation modeling with the optimization algorithms is not reported to the best of our knowledge.
The toxicity characteristic leaching protocol ([TCLP] EPA Method 1311) has historically been the most common leaching test used in many environmental release assessments (Kim et al., 2005, Lincoln et al., 2007, Wang et al., 2014). However, TCLP represents a single scenario that was designed to mimic landfill leaching conditions, and may cause misinterpretation of element leaching when used in BU applications (Al-Abed et al., 2006). For example, TCLP underestimates the leaching of oxyanion-forming elements (Hooper, 1998). Other methods, such as synthetic precipitation leaching protocol ([SPLP] EPA Method 1312), or acid digestion procedures, are also not necessarily indicative of these varied applications. Recently approved Leaching Environmental Assessment Framework (LEAF) EPA Methods 1313–1316 developed by Kosson et al. (2002) provide detailed information about constituents release from materials. Among these, EPA Method 1314, which assesses the liquid/solid (LS) partitioning of constituents released from materials as a function of LS ratio, mimics actual field conditions.
With the availability of EPA Method 1314, it becomes feasible to estimate chemical partitioning behavior in a variety of in situ environmental scenarios reflecting beneficial land applications and disposal options. With a combination of this experimentally determined behavior data and chemical fate and transport (F&T) modeling algorithms, it then becomes feasible to realistically simulate long-term environmental releases of chemicals in BU as well as disposal scenarios of potential interest. Finally, by combining optimization algorithms with EPA Method 1314 data and F&T predictive models, it becomes possible to assess tradeoffs among alternative BU and disposal scenarios with regard to long-term direct environmental releases, indirect releases (e.g., greenhouse gases), costs, and other criteria of management interest.
Recently, Koralegedara et al., 2017 evaluated the leaching characteristics of trace elementsin flue gas desulfurization gypsum (FGDG) and a soil-FGDG (SF) mixture under different environmental conditions of pH and LS using the recently approved EPA Methods 1313–1316. The present study explores EPA Method 1314 and TCLP data obtained for FGDG and SF by Koralegedara et al. (2017), and management uses of the LEAF data for EPA Method 1314 (LS ratio) for FGDG and SF materials, in combination with chemical F&T simulation and optimization algorithms. The objective of this paper is to demonstrate the methodologies and encourage similar applications to improve environmental management and BUs of INSM through F&T simulation coupled with optimization, using realistic model parameterization.
2. Methodology
2.1. Input data (EPA method 1314 and TCLP results) for the fate and transport model
Koralegedara et al., 2017 describe EPA Method 1314 performed for FGDG, soil, and SF. Briefly, commercially available FGDG, soil collected from an agricultural farm, and SF prepared by mixing soil:FGDG at 71:29 wt percent was used in an EPA 1314 column leaching test. Then deionized (DI) water was used as the extraction fluid and leachate was collected at different time intervals as a function of LS ratio. The same materials were used in a TCLP experiment. The extraction fluid was prepared by acidifying DI water with glacial acetic acid to reach the pH 2.88. The LS of 20 was used and the leachate was collected after 18 h. All the leachates were filtered through 0.45 μm polypropylene membrane filters, acidified with 5% HNO3 and analyzed for dissolved elements by ICP-AES analysis (EPA Method 6010 B using an IRIS Intrepid Inductively Coupled Plasma-Atomic Emission Spectrometer, Thermo Electron Corporation, CA). Among the several targeted CPC, we looked for those that were leached from at least both FGDG and SF, and ideally soil as well. Using this criterion, we selected selenium (Se) and boron (B) to be used in the F&T model. Leachate concentrations of Se and B measured during EPA Method 1314 and TCLP for the FGDG SF and soil are presented in Tables S1–S3, respectively (supplementary information). Se was not detected in the native soil sample above the method detection level.
2.2. Development of non-equilibrium partitioning coefficient (NPC (LS)) models
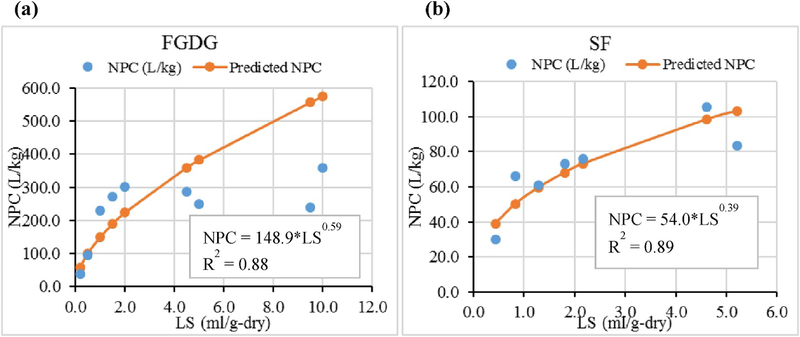
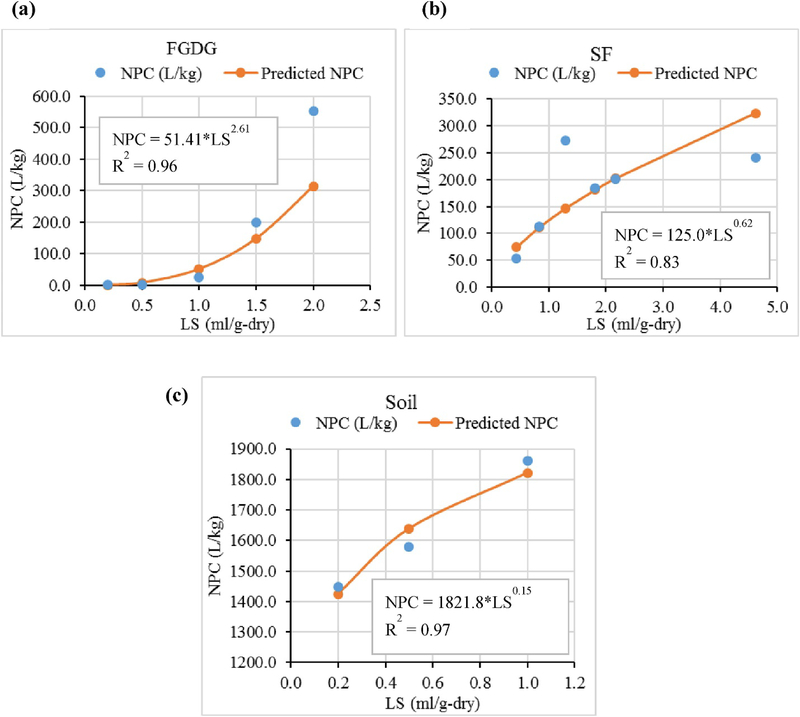
The F&T simulation modeling presented subsequently requires the actual liquid-solid partitioning at various LS ratios. The liquid-solid partitioning coefficients calculated at different LS ratios using EPA-method 1314 data (Fig. 1&2) were used in the F&T simulation model. These liquid-solid partition coefficient values obtained under non-equilibrium conditions herein named as NPC were calculated for each sampling event considering the total content of each element available in the system (after adjusting the amounts removed from the system at each sampling event) and the concentration of each element in the leachate at that time (A calculation example is given in supplementary information (S.1)). The NPC of Se and B in all the materials is increased as the LS ratio increases, but at a decreasing rate (Fig. 1, Fig. 2), except for B in FGDG. A regression model based on a power function was used to predict the partitioning of Se and B beyond the maximum LS ratio of the experiment.
Fig. 1.
Non equilibrium partitioning coefficient (NPC) versus liquid-solid ratio (LS) for Selenium (a) in flue gas desulfurization gypsum (FGDG) (b) in soil-FGDG mixture (SF).
Fig. 2.
Non equilibrium partitioning coefficient (NPC) versus liquid-solid ratio (LS) for Boron (a) in flue gasdesulfurization gypsum (FGDG), (b) in soil-FGDG mixture (SF), (c) in soil.
2.3. Development and evaluation of chemical F&T model
To enable long-term simulation and comparison of expected environmental releases for the landfill disposal option and the agricultural field BU option, we used the Generic Environmental Model (GEM), a numerical, chemical F&T model. The GEM sets up and numerically solves the classical, advective/dispersive, partial differential equation(s) describing chemical mass balance in environmental media (i.e., soil, water, or air). The GEM’s underlying theory and user instructions have been published, tested, and verified (Little, 2012).
In anticipation of coupling the GEMs representing disposal and BU options to optimization algorithms to determine cost-minimizing or environmental release-minimizing INSM management solutions, it is computationally efficient to develop “unit” models. These unit models simulate F&T in a given disposal or BU option that have a 1 m2 surface area footprint and a 1 g chemical load. The unit models are run as a pre-processing step prior to the optimization, and generate time series leachate concentration data that are specific to each disposal or BU option and saved. Because the underlying partial differential equations are linear with respect to chemical loading, the unit model time series data can be retrieved on the fly by the optimizer and scaled accordingly to represent actual loads and surface areas that are under consideration during the iterative optimization process. This approach avoids having to execute the actual GEMs repeatedly during optimization and significantly speeds the optimization process.
GEM-based, unitized, simulation models were developed for Se and B for the EPA Method 1314, bench-scale SF and FGDG experiments. The supplementary information (section S.2-Table S4) shows the parameters required for the GEM, such as surface area, depth, number of compartments comprising the column, advective flow rate, dispersion coefficient, bulk density, porosity, water content, partitioning coefficient(s) at non-equilibrium conditions (NPC), and initial condition (initial concentration).
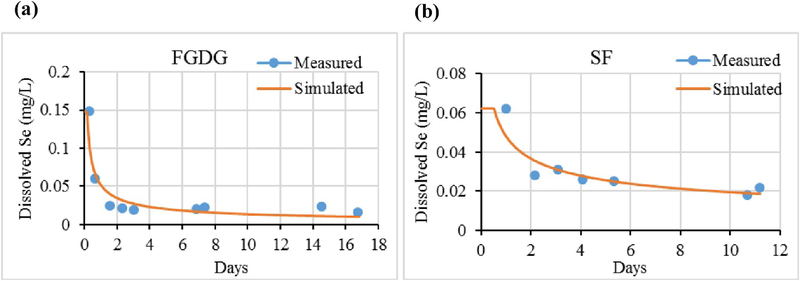
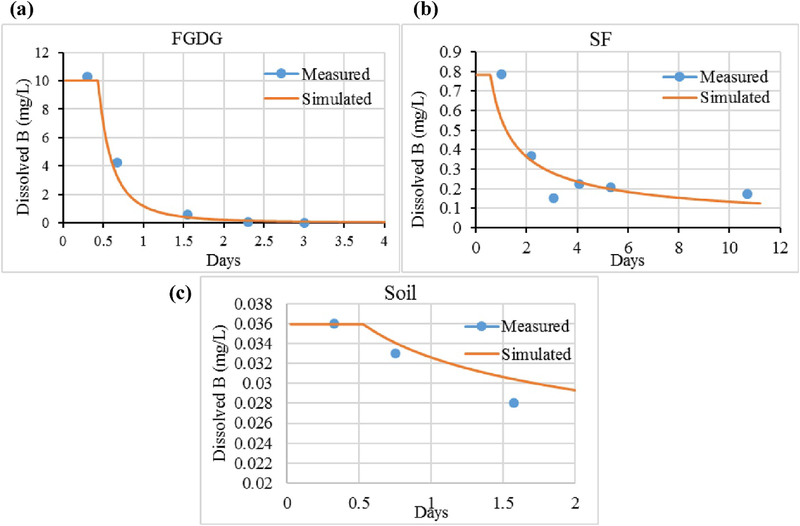
Fig. 3, Fig. 4 show the simulated leaching concentrations of Se and B predicted by the unitized GEM along with the data obtained from EPA Method 1314. The discontinuities in simulated values occurring between time 0 and the first sampling time is a consequence of not having a measured NPC value during this initial period.
Fig. 3.
Selenium scaled unit model results (solid line) and the measured concentrations (dot symbols) of (a) flue gas desulfurization gypsum (FGDG), (b) soil-FGDG mixture (SF).
Fig. 4.
Boron scaled unit model results (solid line) and the measured concentrations (dot symbols) of (a) flue gas desulfurization gypsum (FGDG), (b) soil-FGDG mixture (SF), (c) soil.
As can be seen in Fig. 3, Fig. 4, the simulated versus measured results are in relatively close agreement, thereby providing a positive evaluation of both the unit model approach as well as the underlying functionality of the GEM itself.
2.4. Simulation of long-term environmental releases
A similar, unit GEM was then developed and used to compare long-term environmental releases of Se from FGDG placed in (a) an industrial landfill disposal scenario and (b) an agricultural field amendment BU option. The NPC(LS) predictive models discussed previously and based on actual EPA Method 1314 experimental results are included in these models to enhance representativeness of modeled results to what one might expect in actual applications. (Note: The NPC(LS) model for B for FGDG [landfill cells] has an exponent > 1.0, which would result in very high NPC values with extrapolation beyond the LS values of the experimental data. Accordingly, we limited the maximum NPC used for that simulation to the NPC resulting in half the method detection level.)
2.5. Conceptual compartment model
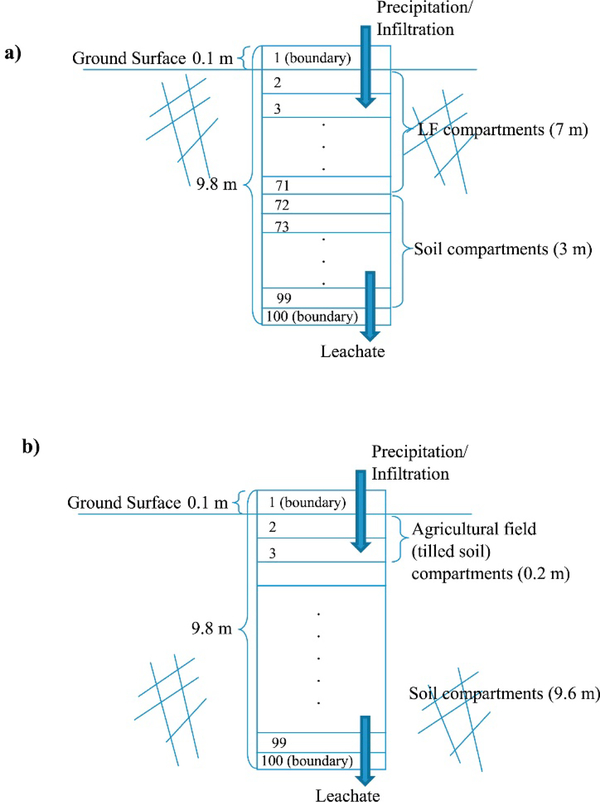
LS partitioning of a CPC is the end result of a number of geochemical and physical processes such as ion exchange, precipitation, dissolution and adsorption. Even though there are number of processes involve in a landfill such as gas and heat emission and evaporation, only the leaching through infiltration is considered as the main environmental release pathway in both landfill disposal and agricultural BU models. If one only considers concentration gradients in the vertical dimension, both of these options can be conceptualized with a conceptual compartment model (CCM) approach as a one-dimensional (vertical) “stack” of compartments (Fig. 5). A detailed description of the CCM is available in the supplementary information.
Fig. 5.
Conceptual compartment model (CCM) for (a) Landfill, (b) Agricultural field.
With the topological similarity between the two options, we used a single GEM–based simulation model in which different physical parameter values for the various compartments distinguish the two options as appropriate.
Table 1 provides a summary of the physical/chemical parameters required for the unit BU models and their assigned values. We assumed the CCM for landfill to be composed of 7 m of material that has the identical FGDG physical and chemical properties (the landfill cells include only FGDG), whereas we assumed the CCM for the agricultural field option to be composed of 0.2 m of tilled soil that has chemical/physical properties identical to the SF. The underlying soil layers have the properties of the soil used in the 1314 experiments. Chemical element-specific NPC(LS) models corresponding to the FGDG and SF were used for the GEM compartments comprising the landfill material zone and agricultural field’s tilled material zone, respectively. However, because we did not detect Se in the pure soil and no estimates of NPC(LS) were therefore possible, we used the Se NPC(LS) model of SF as a proxy for the soil.
Table 1.
Physical/chemical parameter values for unit agricultural beneficial use and disposal models.
| Material | Bulk Density (g/m3) | Porosity/Water Content | Se | B | ||
|---|---|---|---|---|---|---|
| NPC(LS) Model (L/kg) | Initial Dissolved Concentration (mg/L) | NPC(LS) Model (L/kg) | Initial Dissolved Concentration (mg/L) | |||
| Tilled Agricultural Soil (SF Material) | 1.28E06 | 3.84E-02 | NPC = 54.0*LS0.39 | 1.30E-01 | NPC = 125.0*LS0.62 | 7.37E-02 |
| Landfill Cell (FGDG Material) | 1.11E06 | 5.55E-02 | NPC = 148.9*LS0.59 | 3.32E-03 | NPC = 51.41*LS2.61 | 8.30E-02 |
| Native Soil (Soil Material) | 1.31E06 | 2.62E-02 | NPC = 54.0*LS0.39 | 0 | NPC = 1821.8*LS0.15 | 0 |
We calculated the initial dissolved chemical concentrations in the material loading zones based on the unit loading of 1 g total chemical element mass (dissolved + sorbed). The initial dissolved concentrations in Table 1 are different between the unit models due to differences in material-compartment volume, bulk density, and porosity, but the total initial chemical load is the same (1 g). Therefore, the initial unit loading of 1 g is the total concentration, and we calculated the initial dissolved concentrations to satisfy the 1 g total load. We calculated the dissolved fraction of the total load and the initial measured NPC (supplementary information S.2).
The unit model concept is well suited for addressing the relative efficiency of sequestering chemicals by landfill disposal versus agricultural field BU over different time horizons. By normalizing (to unity) both the chemical mass loading and surface area of the disposal or BU option—and using identical infiltration volumetric flow rates, the differences in the unit models’ time series of dissolved chemical mass fluxes below the material loading compartments reflect differences with regard to physical/chemical F&T characteristics between the disposal and BU options. We determined these F&T characteristics by differences in porosity, bulk density, and NPC(LS) properties between the two scenarios.
To compare the environmental impact of the disposal scenario and the BU scenario of FGDG, we used the unit landfill and agricultural field models as parameterized earlier for 1000 years to generate time series of mass fluxes in leachate at three depths (0.5, 1.0, and 2 m) below the initially contaminated zones. As leaching through infiltration is the main process removing chemical in these scenarios we chose a constant infiltration volumetric flow rate of 1 E-03 m3/day based on the approximate annual average precipitation rate for the United States and assumed that one-half of the precipitation remains after surface runoff and evapotranspiration to become infiltration. (To reflect a worst case scenario, we assumed that the landfill does not have a cover or liner.) We considered two additional, constant infiltration volumetric flow rates (0.5 E-03 m3/day and 2 E-03 m3/day) to assess sensitivity to varying precipitation amounts. In practice, of course, a better infiltration assumption would be to use time-varying infiltration rates reflecting local conditions. The GEM accepts dynamic inputs; however, our purpose here was to reflect average conditions across the United States as well as to provide a sensitivity analysis to these conditions. Each infiltration volumetric flow rate was fixed for both models. At the end of each time step, the ending leachate concentration at each depth was converted into a mass flux. The hydrodynamicdispersion coefficient used for all runs assumes only molecular diffusion and was fixed at 1E-04 m2/day.
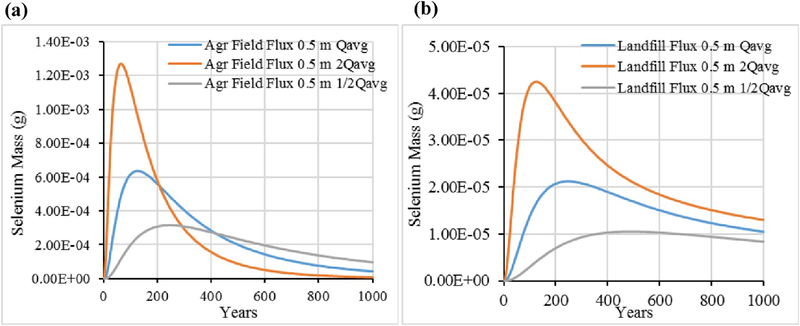
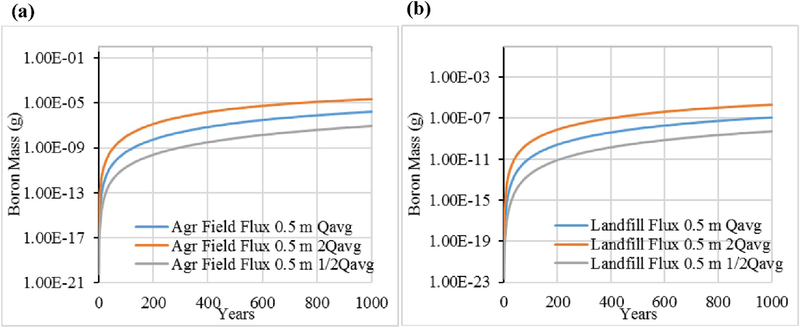
Fig. 6 for Se and Fig. 7 for B present the results for the three different infiltration volumetric flow rates for leachate flux as measured 0.5 m below the material loading zone. For both elements, the agricultural field BU scenario results in a higher release of leachate mass over time than the landfill scenario. Regarding the sensitivity to infiltration rate, higher infiltration volumetric flow rates clearly result in quicker washout of chemical from the material zones, as expected. Comparing the two chemical elements, Se is relatively less tightly sorbed than B and its total initial mass loading (1 g) is nearly completely released within the 1000-year period, for all three infiltration scenarios. For B, the mass flux release rate is still increasing at 0.5 m at 1000 years even with the highest infiltration scenario. The time to essentially complete release of B from either BU option is well beyond 1000 years.
Fig. 6.
Selenium leachate mass flux at 0.5 m below material zones for (a) Agricultural field (Agr Field), (b) Landfill, for three infiltration scenarios.
Fig. 7.
Boron leachate mass flux at 0.5 m below material zones for (a) Agricultural field (Agr Field), (b) Landfill, for three infiltration scenarios.
Table 2 gives the mass fractions of the initial 1 g total load of Se and B that is released as dissolved chemical in leachate over 1000 years. These release fractions have significance beyond our “unit” disposal and BU scenarios. They also arguably reflect the mass fraction of Se or B in any FGDG volume that would be placed in these disposal or BU options similarly configured and with similar physical/chemical characteristics and subject to the same infiltration volumetric flow rates.
Table 2.
Chemical mass fraction released as leachate 0.5 m below material zone.
| Infiltration | Mass Fraction Released |
|||
|---|---|---|---|---|
| Selenium | Boron | |||
| Ag Field | Landfill | Ag Field | Landfill | |
| Qavg | 9.17E-01 | 5.43E-02 | 1.39E-03 | 9.29E-05 |
| 2*Qavg | 9.83E-01 | 8.38E-02 | 2.15E-02 | 1.82E-03 |
| 1/2*Qavg | 7.24E-01 | 3.02E-02 | 6.97E-05 | 3.90E-06 |
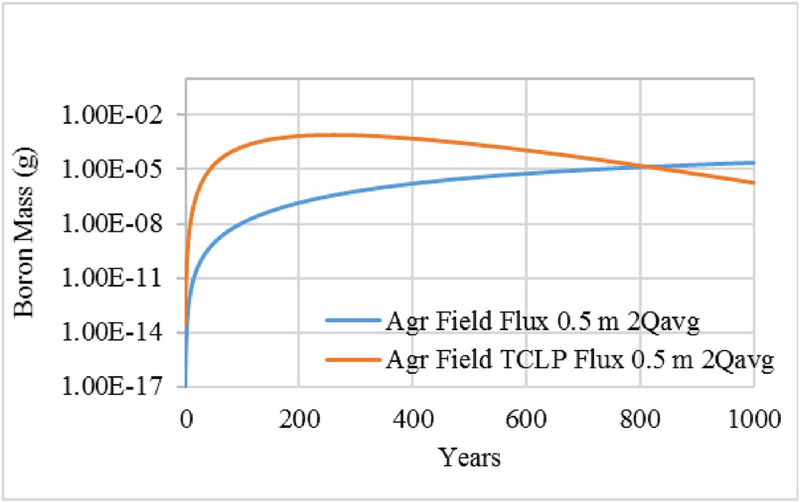
TCLP is an EPA–approved batch leaching protocol that simulates landfill leaching conditions. The leaching data obtained from EPA Method 1311 (TCLP) for FGDG, SF, and soil were also used in the model to predict the long-term environmental release of B in the two management scenarios: landfill disposal and agricultural BU (Se concentrations of the TCLP leachates of all the materials were below detection limit). As the TCLP is a batch leaching test, a single NPC value is available for a given LS ratio. We used the 2*Qavg infiltration scenario because that flow results in a higher fraction of total constituent release than does the lower flow rates and provides a more complete comparison.
As Fig. 8 shows, there is a significant difference in mass fluxes over the simulation period for the two leaching protocols: EPA Method 1314 and TCLP. The TCLP-based model has much higher leachate concentrations and the peak mass release occurs much more quickly than with the EPA Method 1314-based model. Indeed, using the TCLP-based results, the cumulative fraction release over the 1000-year period is 9.89E-01, as compared with the 1314-based value of 2.15E-02 (Table 2), an overestimate of more than an order of magnitude.
Fig. 8.
Comparison of EPA Method 1314–based non-equilibrium partitioning coefficient (NPC(LS)) versus toxicity characteristic leaching protocol (TCLP)–based, constant NPC for Boron.
2.6. Beneficial use decision support system (BUDSS)
The beneficial use decision support system (BUDSS) is a quantitative decision makingmodel that can be used to simulate the long term environmental release of CPC under disposal and BU of INSM combined with multi-objective optimization functions. This can be useful for decision makers in INSM management. The environmental effects (total mass releases as well as leachate concentrations) of alternative options are available to the optimizer through pre-processed “unit” models developed for the disposal and BU options of management interest. The optimizer scales these results to evaluate effects for the specific management decision the optimizer is currently considering, just as the unit bench model and unit BU/disposal model results were scaled previously in this paper. Objectives can be (a) minimizing total environmental mass releases of toxic substances, (b) minimizing total costs, (c) minimizing secondary environmental releases (e.g., greenhouse gases), or (d) any combination of these (multi objective optimization) with relative preferences among the objectives specified by the user via weights.
The use of optimization modeling to support INSM’s BU has been applied in a variety of waste settings, with differing objectives and optimization methods (Zhang et al., 2014, Crohn and Thomas, 1998, Sahakij, 2008, Sundburg et al., 1994, Chang and Wang, 1997, RTI International, 2002, Jin et al., 2013). The BUDSS optimizer is based on a commonly used genetic algorithm approach made popular by Goldberg (1989), because of its flexibility with respect to linear/non-linear features, constraints, robustness to finding global optima, and open source/expansibility.
2.7. Quality assurance
The acceptance criteria used to evaluate the proof-of-concept modeling approaches for beneficial reuse discussed in this paper are verification against available analytical solutions and qualitative assessment based on professional judgment. The comparison of the GEM modeling results and the verification data were essentially identical; hence the model was judged as being verified based on the author’s professional judgment.
For purposes of this project, we evaluated the genetic algorithm results by performing optimizations on problems that were either so simple as to have obvious optimal solutions, or we manipulated selected input data to force the problem to have a known optimal solution. The genetic algorithm solutions were then compared against these known solutions for evaluating the proof–of-concept model performance.
The proof-of-concept BUDSS model is not calibrated. Outputs from the model are therefore not valid except as a demonstration of the potential application and utility of a verified and fully validated model. Further research efforts to develop this model will involve using available experimental data from EPA and other sources, as appropriate, to calibrate the model.
2.8. Optimization scenario
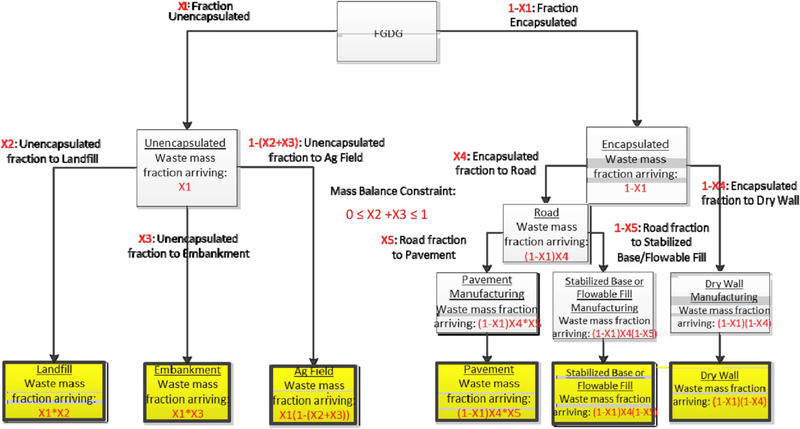
We considered the following INSM BU/landfill disposal/decision support scenarios: Given a mass of INSM containing one or more potential CPC and one or more potential BUs or landfill disposal option, what mass fraction allocation of the INSM among the competing options represents the “best” solution? To illustrate this decision scenario, consider the example possible flow network for FGDG shown in Fig. 9. The figure shows the mass flownetwork, illustrating the potential pathways that the FGDG may follow to final disposal or BU. We considered six total disposal and BU options: (a) Disposal in a landfill, BU of FGDG in either (b) an embankment or (c) land-applied to agricultural fields, and encapsulation of the material followed by BU in (d) pavement, (e) stabilized base, or (f) drywall material. The decision variables for the decision problem are the fractions of the material arriving to disposal/BU—the X1 – X5 variables—which appear in red in Fig. 9.
Fig. 9.
Flue gas desulfurization gypsum (FGDG) mass flow decision network.
Although there are many pathways, specification of these five decision variables completely specifies an INSM management solution. Although the Xi are the fundamental decision variables, as one proceeds through the flow network, the fraction of INSM arriving at each node becomes a function of Xi. For example, the fraction of the INSM arriving at the embankment node is equal to the fraction un-encapsulated (X1) times the fraction of X1 that goes to embankment (i.e., X1 * X3). We used these node-specific variables to write several terms in the optimization model, and they are termed FracArrivei. Specification of the Xivariables completely specifies the FracArrivei variables.
The optimization algorithm iterates on values of the decision variables until the optimal solution is attained. At each iteration, the costs, environmental effects, and other potentially important consequences of that candidate solution must be assessed. These decision consequences, or factors, must be quantified and made available to the optimization algorithms as it iterates on various potential solutions.
2.8.1. Decision factors and the mathematical optimization model
A number of factors influence BU INSM management decisions. Depending on the way the optimization problem is structured, these factors may enter the model as “objectives” (i.e., goals that are being sought) or as constraints on those objectives. These factors are reviewed here and modeled mathematically. Factors that are meaningful only as constraints on the optimization (e.g., mass balance), are designated as such.
2.8.1.1. Environmental releases
Environmental releases are the mass emissions of primary (as opposed to secondary, discussed later) CPC into various environmental media. We defined the total direct environmental release across BUs, CPC, environmental media, and time as:
| (1) |
where
TDER = total direct environmental releases across ultimate BU/disposal uses and CPCs (g)
t = time index, t = 1, …,T and T is the planning horizon
i = disposal/BU index, i = 1, …, NumUses (e.g., landfill, embankment, pavement, stabilized base)
j = environmental medium index, j = 1, …, NumMedia (e.g., water and air)
k = primary chemical index, k = 1, …,NumChemicals (number of chemicals jointly simulated by the coupled F&T model)
WasteMass = total mass of INSM (Mg)
Mwk = concentration of CPC k in INSM (g/Mg or mg/kg)
FracArrivei = fraction of WasteMass arriving to disposal/BU i as function of decision variables, Xi
DERijkt = direct environmental releases mass emissions (g CPC emitted/g CPC arriving) relevant to disposal/BU i, environmental medium j, CPC k, and time t;
The DER parameters refer to the mass flux of primary CPC in the INSM and are estimated dynamically by means of a numerical chemical F&T simulation model that is called during the optimization process as needed; secondary CPC emissions (e.g., greenhouse gasesfrom lifecycle considerations) are discussed later.
2.8.1.2. Costs
Costs associated with allocating a given INSM mass to a given BU will vary for every problem scenario. For example, in many situations the INSM that are historically disposed of are sometimes freely given by the generators to end users, with the only economic costs possibly associated with transportation to the BU location. In other cases, pre-processing (e.g., washing) costs or opportunity costs (e.g., construction of a new landfill if a BU is not identified) might add to costs. We assume that the cost functions can be non-linear with respect to scale—to simulate economies- or dis-economies of scale. Using a power function to model the non-linearities and WasteMass * FracArrivei to reflect the scale of BU i, the total cost (TC) may be estimated as:
| (2) |
Where
ai = the unit cost ($/Mg) and bi is the economy-of-scale factor for BU i.
2.8.1.3. Mass balance constraints
Mass balance constraints are required to ensure that the Xi variables maintain mass balance around the nodes of the network. Fig. 9 provided an example of the mass flow network that is delineated for the example optimization scenario using FGDG. In this example, an explicit constraint requiring that the sum of the mass fractions going to the landfill and embankment must be less than or equal to 1 and positive:
| (3) |
These mass balance constraints are problem-specific and in general are written in terms of the fundamental decision variables, the Xi.
2.8.1.4. Regulatory constraints
These constraints correspond to regulatory limits (RL in grams) imposed on CPC releases to various media (i.e., air, water and soil) from INSM. They vary by CPC and media and are usually established based on best available pollution control technology or human exposure and risk considerations. The following constraint limits the environmental releases of primary CPC (see next section for secondary chemicals) in the INSM to satisfy the CPC- and medium-specific regulator y limits for mass releases:
| (4) |
These constraints may also be written in terms of concentration units. In order to determine the landfill disposal of CPCs regulated under Resource Conservation and Recovery Act (RCRA), the limits obtained by TCLP should be used as regulatory constraints. In addition, maximum contamination levels (MCLs) for drinking water and regional screening levels (RSLs) can also be used as the regulatory constraints depending on the management scenario.
2.8.1.5. Lifecycle (secondary) environmental releases
The previous regulatory constraints restrict the emissions concentrations of the CPC in the INSM release during direct use which are mandatory regulatory limits. However, other secondary environmental emissions might result from processes either required by or avoided by particular BUs. For example, directing INSM toward a BU that involves some pre-processing step may generate volatile emissions of secondary CPC that are not captured in the previous discussed, direct regulatory constraints. Conversely, avoiding some BU that involves these secondary emissions may reduce potential secondary emissions simply by avoidance. These secondary mass emissions relate to CPC that differ from the CPC in the INSM that are of direct concern in the previous regulatory constraints. For example, encapsulation may emit mass releases of greenhouse gases (e.g., CO2, methane). Let the BU-specific secondary, unit mass emissions rate (g emissions/g residual material) for BU i, secondary CPC l, and time t be denoted as SERilt. The total of secondary environmental releases (TSER) across BUs, time, and secondary chemicals is:
| (5) |
Where,
SERijkt = secondary environmental releases mass emissions (g CPC emitted/Mg CPC arriving) relevant to disposal/BU i, environmental medium j, CPC k, and time t.
The SER parameters are not readily amenable to simulation by the coupled chemical F&T model; rather, their values must be estimated from the literature.
2.8.1.6. Substitution ratio constraints
These constraints correspond to the desired characteristics of the processes and materials where the INSM will be used. A good example of this type of requirement is the substitution ratio, which provides information on how much of the virgin/conventional material that is used in various processes and products can be substituted by INSM without affecting the performance of those processes and products. A constraint written in terms of the substitution ratio is:
| (6) |
Where,
Mconvi = available mass (Mg) of conventional or virgin material substituted by the INSM in BU i
SRMAXi = the maximum acceptable ratio.
The complete mathematical model is represented by the objectives and constraints presented as equations (1), (2), (3), (4), (5), (6).
Once the experimental data for all BU scenarios are available to calculate long-term environmental release, the optimal BU scenario can be identified. Further, the user can manipulate the algorithms according to the need, such as to determine the most economical BU scenario or the most environmentally friendly management scenario, over different time intervals (long term versus short term). The algorithms can also supply information on the limitations of material substitution in beneficial applications and the consequences of such applications on regulatory limits of CPC. Such information would be beneficial to the industries for material utilization and to the environmental protection authorities for regulatory purposes. However, to obtain more realistic output from the BUDSS, the experimental data of the other management scenarios are needed.
2.8.2. Example optimization problem
A relatively simple optimization problem is presented and solved in this section as an illustration of management use of BUDSS. For realism, the example is limited to data based on the EPA Method 1314 data that have been used previously throughout this paper.
As previously discussed, the landfill disposal scenario of FGDG had the potential to result in lesser environmental release of both Se and B compared with the agricultural field BU scenario. Therefore, to establish the benefit of BU of FGDG as a soil amendment over disposal, we used the optimization algorithms to analyze the problem while considering disposal and BU costs. The American Coal Ash Association ([ACAA] 2014) has estimated disposal costs of FGDG in an on-site landfill at $3 to $5 per ton and in a landfill requiring truck transportation at $20 to $40 per ton, and with landfill tipping fees of $0 to $125 per ton. Assuming the off-site disposal at mid-range values, landfilling of FGDG might cost a total of approximately $90/ton ($81.7/Mg). In contrast, the ACAA estimates “beneficial” agricultural use of FGDG at approximately $40/ton ($36.3/Mg) (ACAA, 2014), or less than half the landfill disposal costs. In addition to the lower costs that appear to be potentially associated with the BU option, one also has to consider the lifecycle benefits (economic, environmental, and social) that can be gained by using the FGDG as opposed to other virgin materials that would be applied to fields to provide the same properties.
For management purposes, clearly there is a tension between trying to minimize total environmental releases (at relatively higher cost) in a landfill and trying to minimize costs (with relatively higher environmental releases) in an agricultural BU option. For example, we considered the disposal and BU of 1 Mg of FGDG in the optimization process assuming the properties/conditions identical to EPA Method 1314. If the objective is to minimize costs and there are no constraints on the problem, all the FGDG mass would be placed in the agricultural field and a total cost of 1 Mg *$36.3/Mg = $36.3. For Se, the total mass release as leachate over 1000 years at the Qavg infiltration rate is 0.917 (from Table 2) * 1 Mg FGDG * 5.73 g/Mg = 5.25 g. Conversely, if one seeks to minimize total environmental release with no constraints, the FGDG is placed in an industrial landfill at a cost of $81.7 and a total Se release of 0.0543 * 1.0 * 5.73 = 0.311 g.
It does not take a decision support system to make those decisions. However, when there are constraints on the problem, a decision support system such as BUDSS can be very useful. In this example, a substitution ratio constraint (see equation (5)) and regulatory limit constraint (similar to equation (4)) were applied for the two management scenarios (disposal and agricultural BU). For the landfill option, we assumed that there is nearby industrial landfill capacity to accept only two-thirds of the 1 Mg of FGDG. For the agricultural BU scenario, we assumed that the demand for FGDG admixture in soils will at most attain the SF mixture ratio from the EPA Method 1314 SF experiment (i.e., 71 [soil]:29 [FGDG] by weight). For both options, the peak leachate concentration over the 1000 year planning period is limited to 0.05 mg/L, the maximum contaminant level (MCL) for Se in drinking water established by the U.S. EPA. This limit is assumed to apply 0.5 m below the material loading zone in both BU scenarios. The total Se content of FGDG (5.73 mg/kg) was used in the problem. Although the BUDSS can consider multiple CPC simultaneously, only Se was considered in the given example.
First we applied the BUDSS to minimize total costs subject to the previous constraints. The optimal solution as output by the BUDSS is shown in Table 3.
Table 3.
The optimal solution for use of 1 Mg of FGDG with minimal total cost.
| Parameters | With minimum Cost |
|
|---|---|---|
| Landfill | Agr-field | |
| Fraction of FGDG | 2.44E-03 | 0.99 |
| Total direct environmental release (g) | 7.60 E-04 | 5.24 |
| Cost | 0.20 | 36.21 |
G(1) = 2.44 E-03 mass balance constraint
G(2) = 0.29 Substitution ratio constraint for agricultural field
G(3) = 3.64 E-03 Substitution ratio constraint for landfill
G(4) = 2.70 E-03 Agricultural field leachate concentration constraint for chemical 1
G(5) = 2.30 E-05 Landfill leachate concentration constraint for chemical 1
Despite the inclusion of the constraints, the algorithm successfully placed the 1 Mg of FGDG material into the least costly option, the agricultural field. Neither the substitution constraints, “G(2)” and “G(3)”, nor the MCL constraints, “G(4)” and “G(5)”, interfered with this attempt. Thus, this BUDSS optimal solution essentially conforms with the unconstrained optimal solution discussed earlier.
Next, we applied the BUDSS to get the optimal solution to minimize total environmental releases of Se also subject to the previous constraints. The optimal solution as output by the BUDSS is shown in Table 4.
Table 4.
The optimal solution for use of 1 Mg of FGDG with minimal Se release.
| Parameters | With minimum Se release |
|
|---|---|---|
| Landfill | Agr-field | |
| Fraction of FGDG | 0.45 | 0.55 |
| Total direct environmental release (g) | 0.14 | 2.89 |
| Cost | 36.67 | 20.01 |
G(1) = 0.45 Mass balance constraint
G(2) = 0.16 Substitution ratio constraint for agricultural field
G(3) = 0.67 Substitution ratio constraint for landfill
G(4) = 8.24 E-04 Agricultural field leachate concentration constraint for chemical 1
G(5) = 4.24 E-03 Landfill leachate concentration constraint for chemical 1
This time, the optimization could place only 0.45 Mg of FGDG in the least-releasing option, the landfill. At this landfill allocation, the substitution ratio constraint for the landfill, “G(3)”, became active at the maximum ratio of 0.67. The remainder of the FGDG, 0.55 Mg was then placed in the agricultural field. Total cost for this scenario is $56.67, and the total (direct) environmental release of Se is 3.02 g. It should be noted that the MCL constraints for Se, “G(4)” and “G(5)”, are not close to the MCL (0.05 mg/L) under either optimization run, indicating that either solution would not jeopardize regulatory limits for Se.
3. Discussion and conclusions
This study discussed the use of a new modeling approach (GEM) using LS partitioning of CPC in optimization algorithms (BUDSS) to obtain more detailed information relevant for optimized material management. It was demonstrated that GEM can be used to predict the environmental release of CPC from different solid materials over the long term. These predictions are based on experimental data from new EPA laboratory test methods that more realistically represent environmental settings. The CCM represents the management scenarios, which can be altered as needed for different scenarios (e.g., embankments, mine reclamation). The modeled environmental release data, along with the other constraints, can then be input to the optimization algorithms (BUDSS), which, based on our preliminary results, has the ability to provide enhanced quantitative information to decision-makers on optimized material management, as the relatively simple numerical example showed. Therefore, the combination of the chemical F&T model (GEM) and the optimization algorithms (BUDSS) provides a highly effective, convenient tool for optimized material management and has the ability to support complex decision-making with respect to the BU of INSM previously treated solely as waste. We consider the methods presented herein as a proof-of-concept of this approach. However, some limitations and uncertainties of these methods should be noted.
Obviously, basing 1000 year predictions on experimental results that span at the most 17 days generates considerable uncertainty in long-term results. Shorter period, acute exposures to chemicals in FGDG would more reliable. It would be useful to conduct much longer Method 1314 experiments where NPC(LS) models generated using measured dissolved concentrations from early on in the experiment could be used to evaluate (or not) dissolved concentrations measured much later.
Some long-term uncertainties/biases are observable from the NPC(LS) regression models themselves. For example, the NPC(LS) regression model for Se in SF material (Fig. 1b) is a relatively poor fit (over predicts) to the data measured after day 4. That high bias will translate into more sorption with increasing time (increasing LS) than the data reflect, and predicted dissolved concentrations will be underestimated. We used the power function regression model because it has desirable properties of capturing the general trend of increasing NPC but at a decreasing rate. The power function model worked well with two exceptions. For Se in FGDG (Fig. 1a), the power function does not appear to be capable of capturing both the data before day 2 and after day 4. In addition, the B in FGDG (Fig. 2b) data are concave (increasing at an increasing rate), while all other data are convex (increasing at a decreasing rate). Other regression models, e.g. a Langmuir-type function, or perhaps a piece-wise regression model may be more appropriate for such data. Unfortunately, our data were too limited to explore these alternatives.
The methods presented in this paper for generating NPC(LS) models for long-term predictions are simplistic in at least two ways. NPC will vary not only with LS, but also with different samples of the same material. Multiple samples of the same FGDG material are likely to exhibit somewhat different NPC(LS) patterns. In addition, NPC(LS) may vary as a function of other environmental variables, such as pH, concentrations of various oxides, organic carbon, etc. Accordingly, the methods and results presented herein should be regarded as a methodological demonstration of capturing some of this environmental variability, if not all possible variability. The methodologies could be expanded to include additional, partitioning-affecting variables. For example, performing Method 1314 experiments on samples over multiple pH values could capture this variability, and multivariate regression models (NPC (LS, pH)) would replace the single variable, NPC(LS) models. pH variability over the life of the BU scenarios would of course then need to be included in the F&T simulations.
The results from the optimization model may not by themselves indicate that a specific beneficial use does not pose concerns to the human health; and that further impact assessments may be needed.
Supplementary Material
Acknowledgments
This research was initiated and funded by the U.S. EPA National Risk Management Research Laboratory (NRMRL), Cincinnati, Ohio. The experimental work was performed at NRMRL and optimization tools was developed at the RTI, International. The views expressed in this article are those of the authors and do not necessarily represent the views or policies of the U.S. Environmental Protection Agency. Mention of trade names and commercial products does not constitute endorsement or recommendation for use.
Abbreviations
- INSM
Industrial non-hazardous secondary materials
- BU
Beneficial use
- EPA
Environmental protection agency
- CPC
Constituents of potential concern
- TCLP
Toxicity characteristic leaching protocol
- SPLP
Synthetic precipitation leaching protocol
- LS
liquid/solid
- F&T
Fate and transport
- FGDG
Flue gas desulfurization gypsum
- SF
soil-FGDG mixture
- NPC
Non-equilibrium partitioning coefficient
- GEM
Generic environmental model
- CCM
Conceptual compartment model
- BUDSS
Beneficial use decision support system
- MCL
Maximum contamination level
- RSL
Regional screening levels
- RCRA
Resource conservation and recovery act
References
- Al-Abed SR, Hageman PL, Jegadeesan G, Madhavan N, Allen D, 2006. Comparative evaluation of short-term leach tests for heavy metal release from mineral processing waste. Sci. total Environ 364, 14–23. [DOI] [PubMed] [Google Scholar]
- American Coal Ash Association, 2014. Coal Combustion Product Production & Use Survey Report. http://www.acaa-usa.org/Portals/9/Files/PDFs/2013ReportFINAL.pdf.
- Chang NB, Wang SF, 1997. A fuzzy goal programming approach for the optimal planning of metropolitan solid waste management systems. Eur. J. Op. Res 99 (2), 303–321. 10.1016/S0377-2217(96)00024-0. [DOI] [Google Scholar]
- Crohn D, Thomas A, 1998. Mixed-integer programming approach for designing land application systems at a regional scale. J. Environ. Eng 124 (2), 170–177. 10.1061/(ASCE)0733-9372,170. [DOI] [Google Scholar]
- Goldberg DE, 1989. Genetic Algorithms in Search, Optimization, & Machine Learning. Addison-Wesley Publishing Company, Inc, Reading, Massachusetts. [Google Scholar]
- Hooper K, 1998. Toxicity characteristic leaching procedure fails to extract oxyanion-forming elements that are extracted by municipal solid waste leachates. Environ. Sci. Technol 32, 3825–3830. 10.1021/es980151q. [DOI] [Google Scholar]
- Jin W, Hu Z, Chan CW, 2013. A genetic-algorithms-based approach for programming linear and quadratic optimization problems with uncertainty. Math. Probl. Eng. 2013 10.1155/2013/272491. Article ID 272491. [DOI] [Google Scholar]
- Kim J-Y, Kim K-W, Ahn JS, Ilwon Ko, Lee C-H, 2005. Investigation and risk assessment modeling of as and other heavy metals contamination around five abandoned metal mines in Korea. Environ. Geochem. Health 27 (2), 193–203. [DOI] [PubMed] [Google Scholar]
- Koralegedara NH, Al-Abed SR, Arambewela MK, Dionysiou DD, 2017. Impact of leaching conditions on constituents release from FGDG and SF mixture. J. Hazard. Mater 324, 83–93. 10.1016/j.jhazmat.2016.01.019. [DOI] [PMC free article] [PubMed] [Google Scholar]
- Kosson DS, Van Der Sloot HA, Sanchez F, Garrabrants AC, 2002. An integrated framework for evaluating leaching in waste management and utilization of secondary materials. Environ. Eng. Sci 19, 159–204. 10.1089/109287502760079188. [DOI] [Google Scholar]
- Lincoln JD, Ogunseitan OA, Shapiro AA, Saphores JM, 2007. Leaching assessment of hazardous materials in cellular telephones. Environ. Sci. Technol 41 (7), 2572–2578. [DOI] [PubMed] [Google Scholar]
- Little KW, 2012. Environmental Fate and Transport Analysis with Compartment Modeling. CRC Press, Boca Raton, Florida. [Google Scholar]
- Lu HW, Huang GH, He L, Zeng GM, 2009. An inexact dynamic optimization model for municipal solid waste management in association with greenhouse gas emission control. J. Environ. Manag 90, 396–409. [DOI] [PubMed] [Google Scholar]
- Mir MA, Ghazvinei PT, Sulaiman NMN, Basri NEA, Saheri S, Mahmood NZ, Jahan A, Begum RA, Aghamohammadi N, 2016. Application of TOPSIS and VIKOR improved versions in a multi criteria decision analysis to develop an optimized municipal solid waste management model. J. Environ. Manag 166, 109–115. [DOI] [PubMed] [Google Scholar]
- Park JY, 2014. Assessing determinants of industrial waste reuse: the case pf coal ash in the United States. Resour. Conserv. Recycl 92, 116–127. [Google Scholar]
- Park JY, Chertow MR, 2014. Establishing and testing the “reuse potential “indicator for managing wastes as resources. J. Environ. Manag 137, 45–53. 10.1016/j.jenvman.2013.11.053. [DOI] [PubMed] [Google Scholar]
- Puig R, Fullana-i-Palmer P, Baquero G, Riba J, Bala A, 2013. A cumulative energy demand indicator (CED), life cycle based for industrial waste management decision making. Waste Manag. 33, 2789–2797. [DOI] [PubMed] [Google Scholar]
- RTI International, 2002. Municipal Solid Waste Decision Support Tool. http://mswdst.rti.org/.
- Sahakij P, 2008. Multi Objective Optimization Models for Distributing Biosolids to Reuse Fields. PhD Dissertation University of Maryland, College Park, Maryland. [Google Scholar]
- Sundburg J, Gipperth P, Wene CO, 1994. A systems approach to municipal solid waste management: a pilot study of Goteborg. Waste Manag. Res 12 (1), 73–91. 10.1177/0734242X9401200108. [DOI] [Google Scholar]
- Wang Y, Huang X, Hu J, 2014. Study on release potential of heavy metals in sediments from Baihua lake by dredging simulation. Adv. Mater. Res 878, 545–550. [Google Scholar]
- Zhang W, Wang C, Li Y, Wang P, Wang Q, Wang D, 2014. Seeking sustainability: multi objective evolutionary optimization for urban wastewater reuse in China. Environ. Sci. Technol 48 (2), 1094–1102. 10.1021/es404082f. [DOI] [PubMed] [Google Scholar]
Associated Data
This section collects any data citations, data availability statements, or supplementary materials included in this article.


