

Abstract
Clinically used RAF inhibitors are ineffective in RAS-mutant tumors because they enhance homo- and heterodimerization of RAF kinases, leading to paradoxical activation of ERK signaling. Overcoming enhanced RAF dimerization and the resulting resistance is a challenge for drug design. Combining multiple inhibitors could be more effective, but it is unclear how the best combinations can be chosen. We built a next-generation mechanistic dynamic model to analyze combinations of structurally different RAF inhibitors, which can efficiently suppress MEK/ERK signaling. This rule-based model of the RAS/ERK pathway integrates thermodynamics and kinetics of drug-protein interactions, structural elements, post-translational modifications and cell mutational status as model rules to predict RAF inhibitor combinations for inhibiting ERK activity in oncogenic RAS and/or BRAFV600E backgrounds. Predicted synergistic inhibition of ERK signaling was corroborated by experiments in mutant NRAS, HRAS and BRAFV600E cells, and inhibition of oncogenic RAS signaling was associated with reduced cell proliferation and colony formation.
In Brief
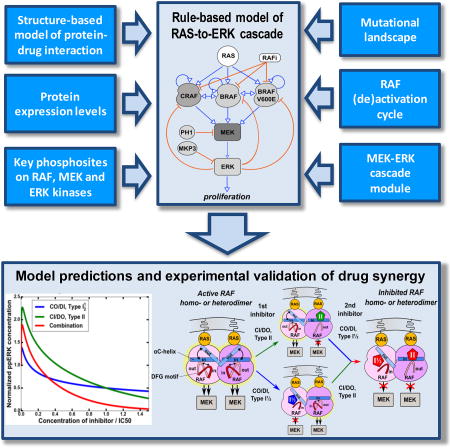
To overcome oncogenic RAS signaling, suitable combinations of conformation-selective RAF inhibitors are predicted by a structure-based model that integrates thermodynamic, kinetic, structural and cell mutation data. Predictions are validated in vitro using signaling, proliferation and colony formation assays. Generally, our data suggest that if a kinase dimerizes for full activation, two inhibitors targeting this kinase in different conformations will likely synergize for target inhibition.
Introduction
The RAS/RAF/MEK/ERK pathway is pivotal for cell proliferation and survival and is frequently hyperactivated in tumors. Oncogenic mutations in the RAS genes (H-RAS, K-RAS, and N-RAS) occur in about 30% of cancers (Prior et al., 2012; Stephen et al., 2014). Despite a three-decade long effort at developing RAS inhibitors, there is still no clinically available drug. As a result, the development of inhibitors of the kinases downstream of RAS has become a hot topic in drug development (Caunt et al., 2015; Rahman et al., 2014). Considerable efforts have focused on RAF kinases, owing to frequent BRAF mutations that drive cancer and developmental disorders (Rauch et al., 2016). The most common oncogenic BRAF mutation, BRAFV600E is found in ca 8% of human tumors and 60% of melanomas (Weinstein et al., 2013; Holderfield et al., 2014)). The ATP-competitive RAF inhibitors in clinical use, vemurafenib and dabrafenib, show high initial response rates in patients with mutant BRAFV600E malignant melanomas, but the effects are short-lived (Holderfield et al., 2014). Moreover, about 30% of patients develop secondary skin hypertrophy or malignances because of paradoxical ERK activation in wild-type (WT) BRAF cells (Yaktapour et al., 2014). Paradoxical ERK activation is particularly pronounced in mutant RAS tumors conveying intrinsic resistance to RAF inhibitors (Zhang et al., 2015), which can even accelerate tumor growth and invasion (Sanchez-Laorden et al., 2014).
Homo- and hetero-dimerization of the RAF kinases BRAF and CRAF (gene name RAF1) significantly increases their catalytic activities and represents a key event in the activation of normal and oncogenic RAF pathways (Freeman et al., 2013; Garnett et al., 2005; Rushworth et al., 2006). The binding of RAF molecules to active RAS drives RAF dimerization by inducing conformational changes, dephosphorylation of inhibitory residues and bringing RAF molecules into proximity of each other (Dhillon et al., 2002; Kholodenko et al., 2000; Weber et al., 2001). Enhanced RAF kinase dimerization driven by oncogenic RAS mutations or upregulation of upstream receptors leads to intrinsic or acquired resistance to RAF inhibitors (Lito et al., 2013; Nazarian et al., 2010). Other resistance mechanisms connected with increased RAF dimerization include CRAF overexpression (Holderfield et al., 2014; Lito et al., 2013), BRAF amplification (Shi et al., 2012), and BRAFV600E splice variants exhibiting enhanced dimerization potential (Poulikakos et al., 2011). All clinically used RAF inhibitors are ineffective against RAS mutant tumors (Hatzivassiliou et al., 2010; Poulikakos et al., 2010) and show poor performance in BRAF mutant colorectal cancers (Holderfield et al., 2014). Thus, more effective therapeutic strategies are currently needed to target mutant BRAF driven cancers.
Protein kinases toggle between inactive and active conformations that differ by the positions of the highly conserved DFG motif and αC-helix. ATP-competitive RAF inhibitors can be classified based on their preferential binding to different (IN or OUT) conformations of the DFG motif and αC-helix (IN and OUT positions correspond to active and inactive kinase conformations, respectively) (Fabbro, 2015; Karoulia et al., 2016; Roskoski, 2016). A broad classification includes three inhibitor types: αC-IN/DFG-IN (denoted CI/DI, Type I), αC-OUT/DFG-IN (CO/DI, Type I½), and αC-IN/DFG-OUT (CI/DO, Type II), see Table S1. The observation that ATP-competitive inhibitors bind with different affinities to active and inactive kinase conformations received much attention in the drug discovery effort, but mostly in terms of inhibitor structures. We have recently reported that fundamental thermodynamic principles governing allosteric inhibitor effects can explain both paradoxical RAF kinase activation and common resistance mechanisms to RAF inhibitors (Kholodenko, 2015). Our work suggested that a combination of two structurally different RAF inhibitors may offer a path to abolish resistance (Kholodenko, 2015). However, to understand which inhibitor types to combine and in which cellular contexts, we need to connect thermodynamic and structural analyses of inhibitor-RAF interactions with biochemical, mutational and pathway regulation data, including dynamics of posttranslational modifications (PTMs) and feedback loops.
Here, we present a mechanistic ERK pathway model that integrates the structural, thermodynamic and kinetic analyses of RAF kinases, inhibitors and their interactions with pathway biochemical data and cellular genetic profiles to faithfully predict RAF inhibitor responses at the network level. This comprehensive model is based on extended studies of RAF kinase regulation by multiple phosphosites and dimerization, and intensive RAF inhibitor research. Our model predicts a number of unknown, hidden properties of network responses to different types of RAF inhibitors and makes wide strides in understanding resistance to these drugs. The model suggests that synergy can emerge between Type I and Type II, as well as between Type I½ and Type II inhibitors and predicts ways of overcoming RAF inhibitor resistance in RAS mutant cells. Our experimental results on responses of MEK/ERK signaling to different RAF inhibitor types and their combinations in melanoma cells bearing oncogenic RAS, BRAFV600E mutations, or both BRAFV600E and NRAS mutations support model predictions. Inhibition of oncogenic RAS signaling in MEL-JUSO cells (NRASQ61L/WT, HRASG13D/G13D) is associated with reduced cell proliferation and colony formation. The results suggest an alternative principle of targeting the same kinase with two structurally different inhibitors that bind to different kinase conformations.
Results
Exploiting RAF dimer asymmetry as drug target
Structural studies of the BRAF and CRAF kinase domains show that dimers are asymmetric, and that RAF inhibitors often only bind one protomer. This asymmetry allows allosteric activation of a RAF protomer by a drug-bound protomer and is a critical feature of the paradoxical ERK pathway activation induced by many RAF inhibitors (Hu et al., 2013; Jambrina et al., 2014; Jambrina et al., 2016; Kholodenko, 2015; Yao et al., 2015). This asymmetry is hallmarked by different (IN-OUT) orientations of the αC-helix together with distinct IN and OUT conformations of the DFG motif (Figs. 1A and S1). These conformations occur naturally (Fig. 1B), but can be stabilized by RAF inhibitors, as suggested by crystallographic structures of BRAF with different inhibitors (Figs. 1C–D, and S1). These structural changes combined with the evidence from thermodynamic studies that dimerization can substantially change the affinity of protomers for a drug (Kholodenko, 2015), prompted us to hypothesize that combining RAF inhibitors that preferentially bind to alternative αC-helix and DFG motif conformations should be able to block RAF dimer activity. As RAF dimerization involves not only conformational changes but also is governed by dynamic PTMs, which are difficult to track by structural and biochemical studies, we developed an integrated computational model that allowed us to analyze both the phosphorylation and conformational dynamics in mechanistic detail and rigorously tested model predictions (see a workflow diagram in Fig. 1E).
Fig. 1. Asymmetry of BRAF homodimers.

(A) Definitions of the αC-helix angle (ω) IN (ω > 54°) or OUT (ω < 52°) positions (Jambrina et al., 2014) as well as the DFG-motif IN (d < 7 Å) or OUT (d > 9.5 Å) conformations via the L505-F595 distance (d). The structure is illustrated using the PDB structure 3TV4. (B) Molecular dynamics simulation showing that the αC-helix positions of two RAF protomers in a dimer dynamically adjust to asymmetric positions in BRAF homodimers (blue – αC-IN, red – αC-OUT). (C) Distribution of the αC-helix conformations in 92 BRAF kinase domain protomers based on the analysis of 46 BRAF dimer structures deposited in PDB. (Insert) Distribution of the αC-helix positions in BRAF dimers with only one inhibitor molecule bound, based on 6 PDB structures: 3OG7, 3Q4C, 4FK3, 4H58, 4XV1, 4XV3. (D) Distribution of the αC-helix and DFG motif conformations in the 90 BRAF protomers analyzed. Among 45 analyzed RAF dimer PDB structures, 6 of the structures contain only one inhibitor molecule, and the rest have two inhibitors molecules bound to the dimer. (E) Workflow diagram of this study. See also Figure S1.
Structural, thermodynamic and kinetic mechanisms integrated in our model
Protein functions are regulated by (de)phosphorylation of specific residues on multiple interacting, regulatory and catalytic domains (Pawson and Nash, 2003; Romano et al., 2014; Rubinstein et al., 2016). The ensuing protein states determine the affinities and rates of numerous interactions, including homo- and hetero dimerization, other protein associations, binding of inhibitors, and catalysis. To precisely account for the complexity of these interactions that occur sequentially or in parallel, we implement a rule-based, domain-oriented approach, which explicitly monitors the conformational and phosphorylation states of pathway kinases, including inhibiting and activating phosphosites (Borisov et al., 2008; Chylek et al., 2014; Varga et al., 2017). Our model describes conformational states of RAF monomers and dimers in terms of IN and OUT positions of the DFG motif and the αC-helix. These positions depend on RAF binding to RAS-GTP, the phosphorylation states of key residues (see below), the dimerization status (e.g., allosteric transactivation of a free RAF protomer by inhibitor-bound protomer (Hu et al., 2013)), and binding of RAF inhibitors that can stabilize the αC-helix and the DFG motif in the IN or OUT position, depending on the inhibitor structure. Each rule in our RAS/ERK pathway model determines a set of chemical reactions, whose rates depend on the conformational, phosphorylation and spatial localization states of RAS, BRAF, CRAF, MEK and ERK. Below we briefly outline the main features of the complex RAF regulation, conformational transitions and allosteric interactions with RAF inhibitors that are integrated in the model. A complete model description is given in Star*Methods and Tables S1–S5.
RAF activation cycle
Our model recapitulates how the activities of WT RAF kinases are controlled by (i) inhibitory phosphorylation on S259 for CRAF and S365 for BRAF, (ii) activating phosphorylation on S338 for CRAF, (iii) homo- and heterodimerization, and (iv) inhibitory feedback phosphorylation by ERK on several sites (including S642 on CRAF and T753 on BRAF), as illustrated in Figs. 2, S2 and S3 (Baljuls et al., 2013; Dhillon et al., 2002; Ritt et al., 2010). RAS-GTP is considered as an input to the ERK cascade. In the absence of RAS-GTP, both CRAF and BRAF reside in the cytoplasm in inactive states characterized by pS259 (p denotes phosphorylation) and S338 for CRAF and pS365 for BRAF. Active RAS recruits CRAF and BRAF to the plasma membrane. This is followed by RAF conformational changes, the dissociation of 14-3-3 proteins, dephosphorylation of inhibitory pS259 or pS365, and phosphorylation of S338, resulting in catalytic activity of RAF monomers (Chiloeches et al., 2001; Dhillon et al., 2002), Fig. S2. Catalytic activities increase more than 10-fold following RAF heterodimerization, making it a key event of full RAF kinase activation (Freeman et al., 2013; Rushworth et al., 2006).
Figure 2. Rule-based modeling of binding and phosphorylation reactions and concomitant conformational changes of RAF kinases.

(A) Illustration of rules governing RAF binding to RAS and RAF activation and dimerization cycles. Protein domains and phosphosites that are phosphorylated (p) or dephosphorylated are shown by rectangles. Switch is the RAS switch domain. RBD and DIM are the RAS-binding and dimerization domains, respectively; bI and cI are the inhibitor binding sites on BRAF and CRAF. The domains that are bound in a protein complex are colored. In the S338 rectangle the asterisk (*) indicates that the S338 phosphorylation state does not influence the CRAF association/dissociation reactions with RAS-GTP, whereas the rates of those reactions are affected by the states of the RAF residues (pS642 and pT753) that are phosphorylated by ERK. (B) Simplified BRAF-CRAF (B–C) dimerization cycle and allosteric inhibitor (I) interactions with RAF monomers and dimers. (C) The reaction of inhibitor (I) binding to BRAF (reaction 2) is expanded into 12 reactions that take into account possible positions of the DFG-motif and αC-helix. See also Figures S2 and S3.
Paramount role of ERK-RAF feedback
In the model, ERK phosphorylation affects RAF activities through three different mechanisms (see Star*Methods for details). First, it lowers the binding affinities of both CRAF and BRAF for RAS-GTP (Dougherty et al., 2005; Ritt et al., 2010). Second, it dramatically decreases the activity of CRAF monomers (Dougherty et al., 2005). Third, ERK phosphorylation lowers the affinities of monomers to dimerize. This leads to dissociation of RAF dimers, resulting in a precipitous drop in the total kinase activity (Ritt et al., 2010; Rushworth et al., 2006). Owing to these mechanisms, the activity of RAF kinases is tightly controlled by ERK-mediated feedback in the absence of oncogenic RAS and BRAF mutations (Kholodenko and Birtwistle, 2009; Sturm et al., 2010).
Oncogenic BRAF mutant
We model both WT RAF and mutant BRAFV600E heterozygous and homozygous cells (Star*Methods). In the model BRAFV600E monomers are constitutively active, irrespective of the phosphorylation state of inhibitory S365, as suggested by structural and biochemical studies (Hu et al., 2013). Similar to wild-type, BRAFV600E is recruited to the plasma membrane by active RAS. The dimerization potential of mutant BRAF is higher than that of wild-type protein, and the stability of BRAFV600E dimers is less affected by ERK feedback phosphorylation than in the case of WT BRAF (Lavoie and Therrien, 2015). A list of the relative kinase activities of CRAF, WT BRAF and BRAFV600E monomers and homo- and hetero-dimers is given in Table S4.
Allosteric interactions of RAF monomers and dimers with inhibitors
Structurally diverse RAF inhibitors preferentially bind to different specific conformations of RAF molecules. Owing to thermal motions, these conformations can spontaneously transition between IN and OUT positions of the DFG motif and αC-helix (Lavoie and Therrien, 2015; Shao et al., 2017). Therefore, the apparent dissociation constants (Kd) of inhibitor binding to RAF monomers and dimers will depend on the equilibrium constants of these transitions, which in turn critically depend on the RAF binding, phosphorylation and dimerization states captured in the model. Distinct inhibitor types differentially stabilize IN or OUT positions of the αC-helix and the DFG motif and allosterically change these equilibrium constants and Kd’s (Kholodenko, 2015), see Star*Methods, Fig. S3 and Tables S2, S3. Thus, a unique feature of our model is its inclusion of conformational transitions of the αC-helix and the DFG motif in kinase monomers and dimers, which are driven by the kinetics of RAF activation cycles, interactions with inhibitors and thermal intramolecular motions (Figs. 2, S3).
Summarizing, the model describes how the dynamic assortment of different RAF states determines the Kd of inhibitor binding within a cell. These Kd values critically depend on BRAF and RAS oncogenic mutations, thermal RAF motions, and different rate constants of inhibitor binding to distinct RAF conformations. Importantly, conformation selective RAF inhibitors will have different Kd’s for different RAF molecular states, which is a prerequisite for inhibitor synergy or antagonism in cellular dose-responses. Next, using our comprehensive, structure-based model, we will assess which combinations of structurally different RAF inhibitors can effectively suppress ERK signaling in cancer cells with distinct genetic and protein expression backgrounds and then test the model predictions in experiments.
BRAFV600E mutant-driven cells with WT RAS: what combinations of RAF inhibitors are more effective than individual inhibitors?
Signaling by BRAFV600E monomers is successfully blocked by RAF inhibitors that are used in the clinic, such as vemurafenib and dabrafenib. However, these drugs cannot effectively suppress signaling by RAF dimers, leading to paradoxical ERK activation and the emergence of resistance, when RAF dimerization is increased through different adaptive mechanisms. Importantly, model simulations suggest that in both homo- and heterozygous cells harboring mutant BRAF and WT RAS, BRAFV600E homo- and heterodimers considerably contribute to the total RAF activity (Figs. S4A–S4F). Therefore, synergy between RAF inhibitors will occur if they cooperate to efficiently inhibit RAF dimers (Kholodenko, 2015). Our hypothesis is that two RAF inhibitors binding to alternative conformations of the αC-helix and/or DFG motif could block RAF dimer activity (Fig. 3A). Binding of a CO/DI inhibitor to an inhibitor-free RAF dimer stabilizes the dimer and the αC-helix of the respective protomer in an OUT position, whereas the αC-helix of the other protomer shifts to an IN position (because two αC-OUT protomer positions are generally incompatible with the dimer structure (Karoulia et al., 2016). As drugs preferentially binding to an IN position of the αC-helix will select this protomer, a CO/DI and CI/DO inhibitor pair and a CI/DI and CO/DI pair may potentially synergize in the ERK pathway inhibition (Fig. 3A).
Figure 3. Combination of CO/DI and CI/DO drugs synergistically inhibits the ERK pathway in cells bearing BRAFV600E mutation and WT RAS.

(A) A cartoon showing how different orientations of the αC-helices and DFG motifs in asymmetric BRAFV600E homodimers enable synergy between CO/DI and CI/DO inhibitors that stabilize the protomers in different regulatory motif positions. Thermodynamically preferable positions are shown by solid fillings (αC-helix) and lines (DFG). (B) Typical (no paradoxical activation) shapes of dose-responses to two different inhibitors (blue, I1 and green, I2) and their combination (red). Positions of the red curves correspond to antagonistic (dashed, red), additive (dotted, red) and synergistic (solid red) drug interactions. Drug doses are normalized by their IC50 levels. (C) Model-predicted responses of MEK signaling to CO/DI and CI/DO inhibitors and their combinations in cells with homozygous BRAFV600E mutation. [RAS-GTP]=25 nM, [BRAFV600E]=50 nM, [BRAFWT]=0, basal ppMEK level is 609 nM. The ratio of CO/DI and CI/DO inhibitor doses is 1.2:1. The remaining parameters are given in Tables S4 and S5. (D) MEK signaling responses of growing A375 (WT RAS, BRAFV600E/V600E) cells to B0R and sorafenib and their combination measured using MESOSCALE system, 1 hr, IC50 of B0R is 0.075 µM, IC50 of sorafenib is 44 µM, in a combination the ratio of B0R and sorafenib is 1.2:1. Error bars are calculated using 4 biological replicates. The inserts (C, D) assesses drug synergy using the Talalay-Chou combination index (CI). See also Figure S4.
Using the model, we simulated the stationary dependencies of active MEK and ERK on the doses of RAF inhibitors, applied separately or in combination (these dependences are referred to as dose-responses). The levels of active MEK and ERK were normalized by their basal levels in growing cells, and drug exposure was simulated for several hours to reach the system steady state. To compare dose-response curves for different inhibitors, doses are commonly normalized by the IC50 values for each drug, which are the doses that inhibit the basal MEK or ERK activity by 50% (or by other ICZ values where 0 ≤ Z < 100%) (Chou, 2006; Greco et al., 1995; Yeh et al., 2009). Accordingly, normalized dose-response curves for two different inhibitors always cross at the point where the normalized dose of each drug equals one (see blue and green dose-response curves in Fig. 3). Several quantitative metrics exist to estimate if two different inhibitors synergize, antagonize or act independently in suppressing pathway signaling, which are discussed in detail in Star*Methods (see also Fig. 3B). The Talalay-Chou combination index (CI) identifies drug synergy, additivity or antagonism, if the CI is smaller than 1, equal 1 or greater than 1, respectively (Chou, 2006). An advantage of using CI is the smaller amount of required data points, as compared with other, more comprehensive drug interaction metrics (see below and Star*Methods).
Our simulations suggest that in BRAFV600E/WT RAS cells, two structurally distinct RAF inhibitors can synergize, if they preferably bind to protomers with different orientations of the αC-helix in a dimer (the inserts in Fig. 3 panels show that the CI is smaller than 1 over a range of doses). A combination of CO/DI and CI/DO inhibitors is most effective, suppressing ppERK with almost no paradoxical activation, whereas a combination of CO/DI and CI/DI inhibitors that can also be synergistic shows substantial paradoxical activation mainly induced by a CI/DI inhibitor (Fig. S4H). Also, in BRAFV600E/WT RAS cells, CI/DI and CI/DO inhibitors will not be synergistic (Fig S4L where the CI is greater than 1 over a range of doses), because BRAFV600E homodimers and BRAFV600E-BRAF dimers will not be effectively inhibited. A comparison of the calculated dose-responses (Fig. 3C) with experimentally measured response curves in A375 (BRAFV600E/V600E, WT RAS) cells (Fig. 3D) demonstrates that the model accurately predicts synergistic inhibition of the ERK pathway by B0R (CO/DI) and sorafenib (CI/DO).
The synergy between CI/DO and CO/DI inhibitors increases, if a CO/DI inhibitor has a low dissociation rate constant (koff), as, e.g., LGX818 with 1/koff ≥ 2 hrs (Yao et al., 2015). This low koff does not change the efficiency of this inhibitor applied separately, but greatly enhances the synergistic effect of the drug combination (Fig. S4J, cf. the CI values in Fig. 3D and S4J). By contrast, if a CI/DO drug has a low koff, this almost does not affect the efficacy of this drug applied separately or in combination with a CO/DI drug (Fig. S4K).
Inhibition of mutant RAS-driven cells with WT BRAF by combinations of RAF inhibitors: systematic search for synergy
Specific RAF inhibitors used in the clinic are ineffective against tumors harboring oncogenic RAS mutations (Heidorn et al., 2010; Zhang et al., 2015). A combination of a RAF inhibitor (dabrafenib or vemurafenib) and a MEK inhibitor (trametinib) is standard of care for BRAFV600E-driven metastatic melanoma (Grob et al., 2015; Larkin et al., 2014). However, our model simulations suggest that these drugs do not synergize to inhibit ERK signaling in oncogenic mutant RAS and WT BRAF cells (Figs. S5A–C). In fact, the model predicts that this combination increases the ppERK signal compared to MEK inhibitor alone (Fig. S5A). We tested this prediction using the oncogenic RAS mutant-driven melanoma cell line MEL-JUSO (NRASQ61L/WT and HRASG13D/G13D (Forbes et al., 2015)). The experimental results corroborate model predictions, demonstrating that in MEL-JUSO cells the addition of dabrafenib to trametinib (at the doses that do not fully inhibit ERK activation) increases rather than decreases ERK signaling (Fig. S5B). Therefore next, we explore whether RAF inhibitor combinations can effectively suppress ERK signaling in RAS mutant-driven cells.
Combination of CI/DI and CI/DO RAF inhibitors: model predictions
Oncogenic RAS increases the abundance of BRAF-CRAF dimers. Because in a dimer, the BRAF protomer is dephosphorylated on S365, the equilibrium position of its DFG motif is shifted to the DFG-IN conformation. Consequently, CI/DI inhibitors preferentially bind to this BRAF protomer, stabilizing the DFG-IN conformation. Experimental data suggest that in growing cells the CRAF protomer is not phosphorylated on S338 in a considerable fraction of BRAF-CRAF dimers (Dhillon et al., 2002; Diaz et al., 1997), which is recapitulated in our simulations (Fig. S5D). Consequently, the DFG-motif of this CRAF protomer has a higher probability to be in an OUT position than in an IN position. As a result, this protomer will preferentially bind a CI/DO inhibitor, underpinning a potential synergy between CI/DI and CI/DO inhibitors (Fig. 4A). Importantly, this mechanism of synergy does not depend on which type of inhibitor binds first to a heterodimer; a CI/DI inhibitor would predominantly bind to a BRAF S365 protomer, whereas a CI/DO inhibitor would predominantly bind to a CRAF S259, S338 protomer. The model suggests that a substantial fraction of fully inhibited CRAF-BRAF heterodimers will contain a pair of CI/DO and CI/DI inhibitor molecules instead of two copies of either inhibitor (Fig. S5E). The simulated dose-responses show that either inhibitor induces a strong paradoxical ERK activation, Fig. 4B (data for ppMEK are shown in Fig. S5F). In agreement with experimental studies (Karoulia et al., 2016), CI/DI inhibitors are predicted to show a higher paradoxical ERK activation than CI/DO inhibitors. Notably, the concentration ranges in which inhibitors lead to paradoxical activation become wider with increasing RAS-GTP levels (Fig. S5I).
Figure 4. Combination of CI/DI and CI/DO inhibitors synergistically inhibits the ERK pathway in cells harboring oncogenic RAS mutations and WT BRAF.

(A) Schematics of synergy mechanism between CI/DI and CI/DO inhibitors suppressing asymmetric BRAF-CRAF heterodimers in RAS-mutant cells. (B, C) Simulated stationary responses of ERK signaling to individual drugs and their combinations. Inhibitor doses are normalized by IC50, the total doses shown for the combination correspond to the optimal ratios of CI/DI and CI/DO doses. [RAS-GTP]=250 nM, [BRAFV600E]=0, [BRAFWT]=50 nM, basal ppERK level is 480 nM, the ratio of CI/DI and CI/DO inhibitor doses applied in combination is 2.2:1. (D–E) ERK signaling responses of growing MEL-JUSO cells (NRASQ61L/WT, HRASG13D/G13D, BRAFWT/WT) to SB-590885 (CI/DI), sorafenib (CI/DO) and their combination measured using LUMINEX system, 24 hr. In a combination, the ratio of SB590885 to sorafenib is 1:1.5. The ppERK responses are plotted vs the absolute concentrations of inhibitors applied separately and vs the sum of absolute concentrations for their combination. Areas under the dose-response curves that assess efficiency of inhibitor combination are presented as inserts (B, D). See also Figures S5 and S6.
The inhibitory effect of a two drug combination can be comprehensively assessed by calculating or measuring the ppERK response across a two-dimensional plane of drug doses, Fig. 4C (Keith et al., 2005; Yeh et al., 2009). Lines of constant ppERK inhibition are termed Loewe isoboles (Greco et al., 1995) (IC20, IC50 and IC80 isoboles are shown in Fig. 4C). For non-interacting drugs, these isoboles are straight lines. If two inhibitors synergize, Loewe isoboles are concave, since lesser doses result in the same inhibitory effect. Convex isoboles indicate antagonism between inhibitors, because their combinations require increased doses to achieve the same inhibition. Importantly, these distinctive features of Loewe isoboles do not depend on the normalization method (any ICZ value can be used), or even absolute, non-normalized inhibitor doses can be plotted (Star*Methods). The blue and green dose-response curves for separate inhibitors in Fig. 4B correspond to directions along the axes of the response plane in Fig. 4C, whereas different directions inside the plane correspond to different ratios of inhibitor doses in a combination, Fig. S5H. Different ratios result in different total doses for achieving the same ppERK inhibition. For each desired inhibition level (Z) there is a minimal total dose determined by an optimal ratio of drug doses, which together achieve the Z level of inhibition (a method for deriving optimal inhibitor ratios is given in Star*Methods). Therefore, the commonly used 1:1 ratio of normalized inhibitor doses can be suboptimal for desired inhibition levels, suggesting that in preclinical studies, a two-dimensional plane of inhibitor doses needs to be analyzed (Figs. S6C).
Whereas in BRAFV600E/WT RAS cells, a combination of CI/DI and CI/DO inhibitors does not show synergy (Fig S4L), this combination synergistically suppresses ERK activity in oncogenic RAS mutant, WT BRAF cells, Figs. 4B and Fig. S5F. The combined response shown in Fig. 4B corresponds to the 2.2:1 ratio of normalized doses of CI/DI and CI/DO inhibitors. The response plane in Fig. 4C shows that this ratio is optimal for achieving 80% inhibition of ppERK at the minimal total dose of both inhibitors (Fig. S6C). Following paradoxical ERK activity increase, the inhibitor combination becomes more effective than either inhibitor, starting at the doses around 1/2 of the IC50. For instance, when the sum of two inhibitor doses equals 1 (i.e., when each inhibitor is added at 0.5 of its IC50), the ppERK level drops more than 2-fold, compared to the level when each inhibitor is applied separately at the IC50 dose. At the same time, this inhibitor combination failed to considerably reduce paradoxical activation, suggesting that other inhibitor type combinations need to be also analyzed.
Synergy between CI/DI and CI/DO inhibitors strengthens when a CI/DO inhibitor has a low dissociation rate constant, koff, such as TAK-632 and AZ-628 with 1/koff ≥ 2 hrs (Hatzivassiliou et al., 2010; Okaniwa et al., 2013). After this CI/DO inhibitor binds to inactive RAF monomers, it facilitates RAF dimerization and remains bound, because of its low koff. This leads to the accumulation of heterodimers where one RAF protomer is bound to a CI/DO inhibitor, whereas the other protomer is inhibitor-free (Kholodenko, 2015). An inhibitor-bound and kinase-inactive RAF protomer allosterically transactivates the free RAF protomer in a dimer, which then assumes an active DFG-IN conformation and has higher affinity for a CI/DI inhibitor than for the second CI/DO inhibitor molecule. Our modeling results demonstrate that lowering koff of a CI/DO inhibitor (while keeping the Kd value the same) considerably enhances synergy between CI/DI and CI/DO inhibitors (Fig. S5G) but does not change the efficiency of this inhibitor as a single agent.
Testing modeling predictions for oncogenic RAS mutant cells
To test model predictions, we conducted experiments in the MEL-JUSO (NRASQ61L/WT and HRASG13D/G13D) melanoma cell line (Figs. 4D–E, S5J–L and S6A). In these cells, we measured the dose-responses of active MEK and ERK to increasing doses of SB-590885 (CI/DI RAF inhibitor (Heidorn et al., 2010)) and sorafenib (CI/DO RAF inhibitor (Heidorn et al., 2010; Holderfield et al., 2014)) added separately or in combination. Experimental data allowed us to reconstruct a substantial part of the dose-response plane across multiple inhibitor combinations (Figs. 4E and S5K). The data along the axes correspond to ppERK responses to each inhibitor applied separately, also shown by blue and green dose-response curves in Figs. 4E and S5K. Responses to each inhibitor show strong paradoxical ERK activation, extending into the micromolar range for either inhibitor, while in in vitro kinase assays both inhibitors inhibit all RAF isoforms in the low nM range (King et al., 2006; Wan et al., 2004; Wilhelm et al., 2004). Moreover, in mutant NRAS and HRAS MEL-JUSO cells, SB-590885 (Type I drug) did not suppress ERK activity for the dose range we analyzed. As a result, we could not normalize inhibitor doses by commonly used IC50 levels (the ppERK level did not reach even its basal level for the highest used doses of SB-590885). Therefore, we plotted dose-response curves versus absolute inhibitor doses. Consequently, for each ppERK response to a combination of SB-590885 and sorafenib shown on the dose-response plane in Fig. 4E, the total inhibitor dose is the sum of the absolute SB-590885 and sorafenib concentrations (that can be found by projections of the corresponding ERK response point onto axes). The concave shapes of the Loewe isoboles (lines of constant ppERK inhibition) in Figs. 4E confirm our model predictions, demonstrating pronounced synergy for the combination of SB-590885 with sorafenib. The optimal ratio of sorafenib to SB-590885 doses to achieve 75% ppERK inhibition was about 1.5:1. The section of the dose-response plane corresponding to this ratio is shown in Fig. 4D demonstrating that a combination of SB-590885 and sorafenib substantially inhibits ERK signaling in MEL-JUSO cells at the same total doses, for which either inhibitor on its own is unable to suppress ERK activity efficiently.
When the number of data points across the two-dimensional plane of inhibitor doses is insufficient to reconstruct the Loewe isoboles, the combination index CI is commonly used to identify synergy or antagonism (Chou, 2006). For any particular drug combination ratio, the CI detects if at this ratio the Loewe isoboles will be concave (under a straight line of non-interacting drugs), in which case CI < 1, or convex (above this line), in which case CI > 1. Importantly, the classic metrics for assessing drug interactions, such as the Chou combination index or Loewe isoboles cannot apply to the range of doses, at which individual inhibitors and their combinations paradoxically activate a pathway. An objective measure of suppressing pathway signaling is the area under the dose response curves for each inhibitor taken separately and in combination (Kholodenko, 2015). Inserts to Figs. 4B, 4D, S5G, S5J and S5L demonstrate that this area and therefore, resistance to inhibition, substantially diminishes for a combination of CI/DI and CI/DO inhibitors.
Combination of CI/DO and CO/DI RAF inhibitors
Distinct DFG motif conformations that naturally occurred in a BRAF-CRAF heterodimer motivated us to combine CI/DI and CI/DO inhibitors. Because a CO/DI inhibitor stabilizes BRAF protomer in an OUT conformation of the αC-helix, we conjectured that a CI/DO and CO/DI RAF inhibitor pair might very effectively inhibit these dimers. Therefore next, in oncogenic RAS mutant cells we analyzed combinations of RAF inhibitors that preferably bind distinct orientations of both DFG motif and αC-helix. These drugs, and also inhibitors that preferentially bind only distinct αC-helix orientations, can potentially synergize in both BRAFV600E/WT RAS cells (Fig. 3 and S4) and in RAS mutant cells. Yet, model simulations show that the best combination for RAS mutant cells is a pair of CI/DO and CO/DI inhibitors (Figs. 5A, 5B), whereas a pair of CI/DI and CO/DI inhibitors induces strong MEK/ERK paradoxical activation (Figs. S7A and S7B). Experiments in MEL-JUSO (NRASQ61L/WT, HRASG13D/G13D) and SKMEL2 (NRASQ61R/WT) cells, bearing an activating RAS mutations and WT BRAF, have corroborated modeling predictions that combinations of CO/DI and CI/DO inhibitors are more efficient than either of inhibitors alone (see Fig. 5C for ppERK dose-responses in SKMEL2 cells treated with B0R (CO/DI), sorafenib (CI/DO) and their combination, and Fig. 5D for ppERK dose-responses in MEL-JUSO cells treated with vemurafenib (CO/DI), sorafenib (CI/DO) and their combination).
Figure 5. Combination of CI/DO and CO/DI inhibitors synergistically inhibits ERK signaling, proliferation, and colony formation in cells bearing oncogenic RAS mutations and WT BRAF.

(A) Schematics of synergy mechanism between CI/DO and CO/DI inhibitors effectively suppressing asymmetric RAF homo- and heterodimers in RAS-mutant cells. B) Simulated responses of ERK signaling to CO/DI and CI/DO inhibitors and their combination. Inhibitor doses are normalized by IC50, the total doses shown for the combination correspond to the optimal dose ratio that is nearly 1:1. [RAS-GTP]=250 nM, [BRAFV600E]=0, [BRAFWT]=50 nM, basal ppERK level is 484 nM. (C) ERK signaling responses of growing SKMEL2 (NRASQ61R/WT, BRAFWT/WT) to B0R (CO/DI), sorafenib (CI/DO) and their combination measured using MESOSCALE system, 24 hr treatment. Doses are normalized by the doses that correspond to 250% of the basal ppERK level (20.7 µM for B0R and 5 µM for sorafenib). This was the minimal ppERK level, reached by either inhibitor following paradoxical ERK activation. The ratio of B0R and sorafenib applied in combination is 1:1. (D, E) ERK signaling (D) and cell proliferation (E) responses of growing MEL-JUSO cells (NRASQ61L/WT, HRASG13D/G13D, BRAFWT/WT) to vemurafenib (CO/DI), sorafenib (CI/DO) and their combination measured using MESOSCALE system, 24 hr treatment. Doses are normalized by GI50 levels, i.e. by the levels of 50% inhibition of cellular growth (32 µM for vemurafenib and 8 µM for sorafenib). The ratio of vemurafenib and sorafenib applied in combination is 1:1. (E) Error bars are calculated using 4 biological replicates. The Talalay-Chou combination index (CI) assessing drug synergy in inhibiting cell proliferation is shown as insert (E). Areas under the dose-response curves (AUC) that assess efficiency of inhibitor combinations are presented as inserts (B–E). (F) Colony formation of MEL-JUSO cells treated with vemurafenib (VEM) and sorafenib (SOR) applied separately and in combination, a representative of 3 biological replicates. See also Figures S7 and S8.
In SKMEL2 cells, following strong paradoxical activation of ERK by B0R or sorafenib (a peak value of 8 to 10 times of the basal level), none of these drugs on their own could decrease the ppERK signal back to the basal level. The best inhibition was 250% of the basal level. Therefore, the drug doses were normalized by the doses corresponding to 250% activation (also referred to as IC−250). Fig. 5C shows that the dose-response curve for the combination of inhibitors is lower than the dose-response curves of these inhibitors on their own. For example, although the maximal concentration of sorafenib and B0R each resulted in 2.5-fold higher activation of ERK than the basal level, when these drugs were combined, the same total dose reduced the ppERK signal more than 2.5-fold compared to each drug alone. Although this drug combination dramatically decreases paradoxical ERK activation, it fails to significantly decrease the basal ERK activity in SKMEL2 cells. Our simulations suggest that if a CO/DI inhibitor has a low koff (e.g. LGX818 (Yao et al., 2015)), it will increase the residence time of this inhibitor binding to a RAF dimer, promoting binding of a CI/DO or a CI/DI inhibitor (Fig. 5C). This will increase synergy between inhibitors (Figs. 5A, S7C, S7F and S7G). At the same time, decreasing koff for CI/DO and CI/DI inhibitors does not facilitate their potential synergy with a CO/DI inhibitor (Fig. S7H).
When MEL-JUSO cells are treated with vemurafenib (CO/DI inhibitor) alone, the doses up to 50 µM could only activate ppERK (Fig. 5D), as also reported for other RAS-mutant cancer cells (Adelmann et al., 2016; Karoulia et al., 2016). Our model explains this result by demonstrating that for RAS-mutant cancer cells treated with a CO/DI inhibitor, the IC50 is at least three orders of magnitude higher than the Kd of inhibitor binding to BRAFV600E monomers. This ratio substantially exceeds similar ratios for CI/DI and CI/DO RAF inhibitors (Table S6). Moreover, the IC50 value for oncogenic RAS mutant divided by the IC50 value for oncogenic BRAF mutant is about 100 for a CO/DI inhibitor (Table S6). Sorafenib applied separately could only slightly inhibit ppERK at high doses (12 µM), following paradoxical activation. However, a combination of vemurafenib and sorafenib could effectively inhibit the ERK pathway (following paradoxical ERK activation) at the total doses over 8 µM (5 µM vemurafenib and 3 µM sorafenib). In line with our model predictions, even RAF inhibitors, which on their own only activated ERK signaling, could inhibit the pathway when given in a proper combination.
Inhibition of oncogenic RAS signaling correlates with reduced cell proliferation and colony formation
A combination of CI/DO and CO/DI RAF inhibitors blocked oncogenic RAS signaling in MEL-JUSO cells. Therefore, next we explored how these combinations affect cell proliferation and colony formation potential, which tests for the ability of a single cell to survive and grow into a colony. Both vemurafenib and sorafenib applied individually inhibited MEL-JUSO cell proliferation with the GI50 (a dose inhibiting cell proliferation by 50%) of 32 µM and 8 µM, respectively (Fig. 5E). At 1:1 ratio, a combination of these drugs synergistically inhibited proliferation. When both drugs were combined at 50% of the corresponding GI50 dose, the combination inhibited the cell growth 2-fold more efficiently than each drug at its GI50 dose. Moreover, both drug synergy metrics, the CI and AUC, demonstrated a pronounced synergy between vemurafenib and sorafenib in inhibiting MEL-JUSO cell proliferation (insert to Fig. 5E demonstrates that the CI for inhibition of proliferation was smaller than 0.6 over a range of doses). The other widely used metric for functional drug effects is the Bliss independence criterion (Greco et al., 1995). Based on this criterion, synergy and antagonism scores can be calculated using the difference between the observed proliferation rate decrease for a drug combination and the expected rate decrease for independent drugs (Eq. 32, Star*Methods). The observed synergy scores for combinations of 4.5 µM sorafenib and 10 µM vemurafenib is 52 and for 6 µM sorafenib and 25 µM vemurafenib is 45 (see Figs. S7I and S7J) which are close to the strongest synergy score ca. 50 (all values are in %) found in the ALMANAC study (Holbeck et al., 2017) that assessed over 5,000 pairs of FDA-approved cancer drugs. Likewise, a combination of vemurafenib and sorafenib synergistically inhibited colony formation in MEL-JUSO cells (Figs. 5F and S7K). Similar to a combination of vemurafenib and sorafenib, our data show significant synergy between vemurafenib and TAK-632 (a specific RAF inhibitor with analogous structural properties to sorafenib, Table S1) for both signaling and functional assays (Figs. S8).
Summarizing, our data demonstrate that oncogenic RAS signaling, proliferation and the ability to form colonies are synergistically inhibited by a combination of CI/DO and CO/DI RAF inhibitors in MEL-JUSO cells (NRASQ61L/WT, HRASG13D/G13D).
Combinations of RAF inhibitors suppress ERK signaling in cells bearing both oncogenic RAS and BRAFV600E mutations
One of the common mechanisms of resistance to RAF inhibitors in BRAFV600E melanomas is the appearance of a secondary NRAS mutation in the ERK pathway (Johnson et al., 2015; Lito et al., 2013; Nazarian et al., 2010). Some melanoma patients develop secondary malignancies from cells harboring pre-existing RAS mutations, whereas for others, RAS mutations frequently occur during treatments with BRAF inhibitors (Nazarian et al., 2010). Instructively, the model predicts that inhibitor combinations that synergistically suppress ERK signaling in RAS mutant cells also synergistically inhibit ppERK in co-mutated RAS and BRAF600E cells (Figs. 6B and 6C). This model prediction is explained by the enhanced RAF dimerization and the fact that emerging dimers can be effectively inhibited only by a combination of RAF inhibitors. A combination of a CI/DO inhibitor with a low koff CO/DI inhibitor is predicted to be particularly effective in suppressing ERK activity in these cells (Fig. S9D).
Figure 6. Combinations of RAF inhibitors can synergistically inhibit ERK signaling in cells bearing both oncogenic RAS and BRAFV600E mutations.

(A) Schematics of synergy mechanism between CI/DO and
CO/DI inhibitors effectively suppressing RAF homo- and/or heterodimers in cells
bearing both RAS and RAF activating mutations. (B) Model-predicted
stationary responses of ERK signaling to CI/DO and CO/DI inhibitors and their
combination (B) and to CI/DI and CI/DO inhibitors and their combination (C).
Inhibitor doses are normalized by IC50. In combination, (B) the
ratio of CO/DI and CI/DO inhibitor doses is 1:1, (C) the ratio of
CI/DI and CI/DO inhibitor doses is 6:1. [RAS-GTP]=250 nM,
[BRAFV600E]=25 nM, [BRAFWT]=25 nM, basal ppERK level is
2151 nM. (D) ERK signaling responses to vemurafenib (CO/DI),
sorafenib (CI/DO) and a combination measured using MESOSCALE system, 24 hr
treatment for growing parental (BRAFV600E/WT/WT RAS) and resistant
(BRAFV600E/WT/NRASQ61K/WT) M249 cells. The ppERK
response is plotted vs the absolute concentrations of inhibitors applied
separately and vs the sum of absolute concentrations for combinations, in which
the ratio of vemurafenib and sorafenib doses is 1:1. (C–D)
Inserts assess drug synergy using the Talalay-Chou combination index (CI).
(E–F) Sensitivity analysis of the Talalay-Chou
combination index (CI). The response coefficients of the CI (calculated for
50% inhibition of ERK signaling) to a change in each model parameter are
determined for a combination of CO/DI (inhibitor a) and CI/DO (inhibitor b) RAF
inhibitors for cells bearing (E) both oncogenic RAS and BRAFV600E
mutations or (F) only oncogenic RAS and WT BRAF. The CI is most
sensitive to the changes in: (E) BRAFV600, ERK, and oncogenic RAS
abundances (cyan  ); Spatial
co-localization of RAF and RAS-GTP (yellow
); Spatial
co-localization of RAF and RAS-GTP (yellow  ); BRAFV600E affinities for dimerization and
RAS-GTP and the decrease in these affinities after ERK feedback phosphorylation
of RAF (magenta
); BRAFV600E affinities for dimerization and
RAS-GTP and the decrease in these affinities after ERK feedback phosphorylation
of RAF (magenta  ); Facilitation of
RAF dimerization by inhibitors (green
); Facilitation of
RAF dimerization by inhibitors (green  ); Kinase activity of semi-inhibited BRAFV600E
homodimers (red
); Kinase activity of semi-inhibited BRAFV600E
homodimers (red  ); (F)
BRAF abundance and kinetic parameters of BRAF (de)phosphorylation on S365 (cyan
); Parameters of signal
transfer between MEK and ERK (dark-purple
); (F)
BRAF abundance and kinetic parameters of BRAF (de)phosphorylation on S365 (cyan
); Parameters of signal
transfer between MEK and ERK (dark-purple  ); Decrease in RAF affinity for RAS-GTP after
RAF is phosphorylated by ERK (magenta ); Spatial co-localization of RAF and RAS-GTP
(yellow ); Thermodynamic factors
describing (i) facilitation of RAF dimerization by inhibitors
and (ii) cooperativity between IN/OUT transitions of DFG-motif
and αC-helix in BRAF (green ); Kinase activity of RAF dimers (red ). See also Figure S9.
); Decrease in RAF affinity for RAS-GTP after
RAF is phosphorylated by ERK (magenta ); Spatial co-localization of RAF and RAS-GTP
(yellow ); Thermodynamic factors
describing (i) facilitation of RAF dimerization by inhibitors
and (ii) cooperativity between IN/OUT transitions of DFG-motif
and αC-helix in BRAF (green ); Kinase activity of RAF dimers (red ). See also Figure S9.
To test these predictions, we treated parental (BRAFV600E/WT/WT RAS) and vemurafenib resistant M249 (BRAFV600E/WT/NRASQ61K/WT) cells (Nazarian et al., 2010) with vemurafenib alone, sorafenib alone and the combination of these drugs. The data confirm that a combination of CI/DO and CO/DI inhibitors effectively suppresses ERK signaling in cells bearing both RAS and RAF oncogenic mutations (Fig. 6D). NRAS mutation results in about 3.5-fold increase in the basal ppERK level compared to parental cells (Fig. 6D). After treatment with 3 µM vemurafenib, the ppERK level in resistant M249 cells reaches the value equal to the basal level in the parental cells. Increasing the doses of vemurafenib from 3 to 10 µM does not substantially decrease the ppERK level in M249 cells. Although resistant to vemurafenib, ERK signaling is effectively inhibited in these cells by a 1:1 molar combination of vemurafenib and sorafenib starting from a total drug concentration of 3 µM. These results support model predictions.
How robust are model predictions?
The predictive power of our structure-based, dynamic model of ERK signaling and inhibitor – kinase interactions was tested against experiments and corroborated by the resulting data. Yet, a question arises of how robust these model predictions are, when we go beyond the possibilities of direct experimental testing. To answer this question, we carried out the sensitivity analysis of model-predicted drug interaction metrics to the changes in model parameters. We explored how the area under dose-response curves (AUC, an objective measure of pathway inhibition for a range of drug doses), and the Talalay-Chou combination index (CI) are sensitive to parameter changes, by calculating the response coefficients, and . These response coefficients (also known as the control or sensitivity coefficients, see, e.g., (Kholodenko et al., 1987; Kholodenko et al., 1997; Kholodenko and Westerhoff, 1995)) determine the fractional change in the AUC and CI brought about by a small fractional change in a model parameter p, which in the limit of infinitesimal changes reads, . Thus, and are essentially equal to the % changes in the AUC and CI caused by a 1% change in a parameter. If and are substantially smaller than 1, the model predictions are robust to the changes in the corresponding parameter.
We explored robustness of model predictions for two types of drug resistant melanoma cells, harboring either oncogenic RAS mutations and WT BRAF (MEL-JUSO, SKMEL2) or bearing both oncogenic RAS and heterozygous BRAFV600E mutations (vemurafenib resistant M249 cells). Figs. 6E, 6F, S9K and S9L illustrate the distribution of the response coefficients and to the parameter changes. Strong responses were induced by the changes in the parameters describing the kinase activity of RAF isoforms and formation of RAF dimers. These results are not surprising, because our model suggests that the prerequisite to pronounced synergy between different types of RAF inhibitors is their cooperation to efficiently inhibit RAF homo- and heterodimers. For cells bearing both mutant oncogenic RAS and heterozygous BRAFV600E, the largest responses were induced by changing the kinase activity of semi-inhibited (harboring only one RAF inhibitor molecule) BRAFV600E homo-dimers. The AUC and CI decreased by about 0.6% (corresponding to a 0.6% increase in drug synergy) with the increase in this kinase activity by 1%. Likewise, synergy between CO/DI and CI/DO RAF inhibitors was also controlled by (i) the thermodynamic factors that quantify the facilitation of RAF dimerization by inhibitors, (ii) the parameter describing a decrease in the apparent Kd’s of RAF homo-/heterodimerization due to the spatial co-localization of both RAF molecules bound to RAS-GTP, and (iii) the affinities of BRAFV600E binding to RAS-GTP and BRAFV600E dimerization and the parameters describing decreases in these affinities following RAF feedback phosphorylation by active ERK (Figs. 6E, 6F, S9K and S9L). The most sensitive responses to the protein abundance changes were found for the abundances of mutant BRAFV600E, ERK, and oncogenic RAS.
Cells bearing oncogenic RAS mutations and WT BRAF exhibited a similar distribution of CI and AUC responses to parameter changes (excluding those related to BRAFV600E). In the absence of BRAFV600E, the CI and AUC were sensitive to the parameters describing (i) the spatial co-localization effects on the affinities of BRAF and CRAF dimerization and binding to RAS-GTP, (ii) decreases in these affinities following RAF feedback phosphorylation by active ERK, and (iii) BRAF abundance and its (de)phosphorylation on S365. Similar as above, synergy between CO/DI and CI/DO RAF inhibitors was also strongly controlled by the thermodynamic factors that quantify the facilitation of RAF dimerization by inhibitors and, additionally, by potential cooperativity between IN/OUT transitions of the DFG-motif and the αC-helix (Star*Methods). Also, in the absence of strong signaling by mutant BRAFV600E monomers, the parameters that affect the signal transfer between MEK and ERK (such as the abundances of MEK and ERK phosphatases) more substantially influence drug synergy for oncogenic RAS and WT BRAF cells than for double RAS and BRAFV600E mutant cells. The absolute sensitivity values of the AUC and CI to the remaining parameters were smaller than 0.2, Figs. 6E, 6F, S9K and S9L. We, therefore, conclude that our model predictions are robust and the highest sensitivities to parameter changes can be predicted by their influence on the RAF dimer formation.
DISCUSSION
Intrinsic or acquired resistance to kinase inhibitors, including RAF inhibitors in melanoma and other cancers remains a pressing clinical problem. While different combinations of kinase inhibitors are routinely tested in clinical trials, it is unclear how the best combinations can be chosen. A plethora of confounding factors, including allosteric drug–kinase interactions, phosphorylation-induced conformational changes and kinase dimerization, multiple feedback loops and diverse cell mutational and expression profiles hamper intuitive reasoning about optimal drug combinations. Understanding each drug’s mode of action and the mode of their combined actions at the network level would enable a systematic and robust design of the best combinations. Different dynamics of phosphorylation responses to inhibitors that preferentially bind to active or inactive conformations were previously reported (Kleiman et al., 2011). To describe the experimental data the authors designed a simplified kinetic model that correlates changes in phosphorylation of the EGFR with drug binding without elaborating the underlying molecular mechanisms. Here we present a next-generation pathway model that allows mechanistic and predictive analysis by dynamically integrating thermodynamics and kinetics of drug interactions, structural elements, PTMs, mutational status and pathway regulation. This model unravels salient features of the systems-level dose-responses to different types of RAF inhibitors that show similar inhibition of isolated RAF kinases, but preferentially bind to alternative conformations of the DFG motif and αC-helix adopted by RAF kinases as a result of different oncogenic activation mechanisms. Previous attempts of predicting dose-responses found that this task was exceedingly difficult (Costello et al., 2014; de Gramont et al., 2015; Prasad, 2016; Saez-Rodriguez et al., 2015). The exact reason is unknown, but may be related to the fact that the employed network models and machine learning methods could not embrace the highly dynamic nature of allosteric interactions of structurally different drugs with multiple kinase conformations governed by thermal motions and posttranslational modifications (Nussinov et al., 2013). The type of next-generation models presented here can be instrumental in the future analysis of mechanisms of drug actions and the design of efficacious combinations. For instance, this approach could be extended to optimize combinations of RAF and MEK inhibitors.
Although our model explores RAF inhibitor combinations, it is based on general principles applicable to any kinases that undergo dimerization during activation (Bessman et al., 2014). The model makes a counterintuitive prediction that two drugs targeting the same protein pocket can synergize, while normally they would compete, as known from enzyme kinetics. However, a reason for potential synergy is asymmetry of protomer conformations that is induced by PTMs and/or binding of the first inhibitor molecule to a dimer (Jambrina et al., 2016; Kholodenko, 2015). These unexpected results would not have been discovered without mathematical and structural modeling, accounting for the asymmetry of protomer conformations in a kinase dimer. The model precisely predicts for which mutational profiles and which drugs will preferentially bind different protomers in a kinase dimer and together completely inhibit these dimers. This suggests an alternative principle that two structurally different inhibitors, which target the same kinase, but in different conformations, can be synergistic.
Different mechanisms of intrinsic or acquired resistance in melanoma have a common feature of the increased abundance of RAF dimers. Moreover, recent clinical sequencing of 10,000 metastatic cancers (Zehir et al., 2017) not only revealed the relatively common co-occurrence of NRAS and BRAF mutations that increase RAF dimerization, but also BRAF in-frame deletions, which produce isoforms predicted to enable RAS-independent BRAF dimerization similar to the BRAF splice variants previously associated with acquired resistance to vemurafenib (Poulikakos et al., 2011). Whereas pharmacological research concentrated on creating RAF inhibitors that do not induce RAF dimers and thereby avoid paradoxical ERK activation (Zhang et al., 2015), our model suggested exploiting structural and thermodynamic features of dimer-drug interactions to completely inhibit RAF dimers. Based on model predictions, we showed that both BRAFV600E monomers and RAF dimers are best inhibited together by specific combinations of RAF inhibitors, even when each inhibitor is ineffective on its own. Importantly, the total dose of two combined drugs is considerably smaller than the dose of each inhibitor, which could substantially reduce toxicity resulting from off-target effects.
Experiments corroborate model predictions. In cancer cells bearing BRAFV600E mutation and WT RAS (A375 cell line, Fig. 3) or BRAFV600E and NRAS Q61K co-mutations (resistant M249 cell line, Fig. 6), a combination of CI/DO and CO/DI inhibitors showed pronounced synergy, effectively inhibiting ERK activation. These results suggest that in cases of mutant BRAFV600E, adding a CI/DO inhibitor (e.g., sorafenib, AZ-628, TAK-632, LY3009120) to a standardly used CO/DI inhibitor (vemurafenib, dabrafenib or encorafenib) can be beneficial not only because of more effective inhibition of ERK signaling in WT RAS cancer cells, but also because of synergistic inhibition of signaling in pre-existing or emerging resistant cancer cell clones with both BRAFV600E and RAS mutations. For these mutational profiles, especially for cells with mutant BRAF600E and WT RAS, a combination of CI/DI and CI/DO inhibitors is predicted to show additive rather than synergistic effects (Figs. S4L and S9). Almost counterintuitively, the model predicts, and experiments confirm that the same combination of CI/DI and CI/DO inhibitors is strongly synergistic in oncogenic RAS mutant cells with WT BRAF (MEL-JUSO cells, NRASQ61L/WT and HRASG13D/G13D), Figs. 4, S5, S6. Summarizing, although in cells bearing oncogenic RAS mutations, individual RAF inhibitors are commonly ineffective, proper combinations of RAF inhibitors with particular modes of action efficiently inhibit ERK signaling. Biologically, this effective ERK inhibition is accompanied by a synergistic suppression of proliferation and colony formation in MEL-JUSO cells (NRASQ61L/WT, HRASG13D/G13D) cells. This combination can also be effective in suppressing RAF/ERK signaling in cells with other mechanisms of resistance, such as CRAF/BRAF overexpression and BRAF splicing variants that enable RAS-independent BRAF dimerization (see Star*Methods and Figs. S9H–S9J).
Similarly, modeling can also address the open question whether RAF inhibitors increase the affinity of RAF kinases for RAS. RAF inhibitors increase the amount of RAS-RAF complexes (Hatzivassiliou et al., 2010; Karoulia et al., 2016), which was interpreted as the facilitation of RAF binding to RAS-GTP by these drugs. Although this explanation is plausible, structural evidence is lacking. Moreover, the model demonstrates that allosteric inhibitor effects resulting in enhancement of RAF dimerization can fully explain the increase in RAS-RAF complexes without an assumption that RAF inhibitors increase RAF affinities for RAS-GTP (Fig. S9G). Because each of the RAF protomers in a RAF dimer is bound to RAS in the thin layer near the membrane, the apparent affinity of RAF for RAS increases due to spatial localization effects. Also, recent data on RAS dimerization (Nan et al., 2015) suggest that the increase in the apparent affinity of RAF for RAS can be explained by spatial localization. To further illustrate the interconnection between RAF dimerization and RAF binding to RAS, we developed a toy model (Star*Methods) that shows how spatial localization effects result in an inhibitor-induced increase in the RAS-RAF complexes. If the structural mechanisms for the RAF dimerization-independent induction of RAS-RAF interactions are elucidated, these mechanisms can be readily incorporated into the model.
In summary, the type of next generation dynamic model presented here can address salient issues in drug targeting as well as help discover counterintuitive aspects of drug’s mode of action. These insights can be exploited to rationally design drug combinations that would be difficult to find through trial-and-error approach.
STAR*Methods
Contact for reagent and resource sharing
The Lead Contact B.N.K. is willing to distribute datasets and analysis tools used in the manuscript. Requests should be made directly to Boris N. Kholodenko at boris.kholodenko@ucd.ie.
EXPERIMENTAL MODEL AND SUBJECT DETAILS
Cell culture
Cell lines were either purchased from ATCC (SKMEL2, A375) or DSMZ (MEL-JSUO). M249 cells and the isogenic Vemurafenib-resistant cell line M249R were kindly provided by Antoni Ribas (Nazarian et al., 2010). All cells were grown in RPMI (Gibco) supplemented with 2 mM L-glutamine and 10% (v/v) fetal bovine serum in a humidified atmosphere of 5% CO2 at 37°C. Cells were seeded in 12-well plates (Greiner CELLSTAR dishes) at the density of 105 cells per well. After reaching sufficient confluency, cells were treated with different concentrations of inhibitors and DMSO as control as indicated. To prepare the protein lysates, plates were transferred on ice, washed with ice-cold PBS and harvested by scraping in specific ELISA buffers as indicated below.
METHOD DETAILS
RAF inhibitors
Inhibitors were dissolved in DMSO and stored at −80°C.
MSD Multi-Spot Assay ELISA System
ERK and MEK activation was assessed by ELISA using the MESOSCALE MSD kits according to the manufacturer’s instructions. Briefly, following the addition of complete MSD lysis buffer and scraping the cells from the surface of the dish, the cellular debris was removed from the lysate by centrifugation at 10000×g at 4°C for 10 min. Protein concentration was determined using the BCA test according to the manufacturer’s instructions (Pierce™ BCA Protein Assay Kit). Lysates were adjusted to 0.1 µg/µL protein concentrations for ERK kit and 0.08 µg/mL for MEK kit and relative MEK and ERK activation assessed according to the manufacturer’s instructions using the MSD Sector Imager 2400 (model 1250).
xMAP assays
Following the addition of complete Luminex lysis buffer and scraping the cells from the surface of the dish, the cellular debris was removed from the lysate by centrifugation at 10000×g at 4°C for 10 min. The pellet was discarded and the protein concentration of lysates was adjusted to 0.3 µg/µL using the BCA assay kit. xMAP assays were performed on a Luminex-3D platform (Luminex, Austin, TX) using commercially available phosphoprotein antibody-coupled beads (ProtATonce, Athens, Greece). A custom multiplex phosphoprotein assay was used to determine the levels of test phosphoproteins in cell lysates: dual specificity mitogen-activated protein kinase kinase-1 (MEK1) with phosphorylation site S217/S221, and extracellular signal-regulated kinase-1 (ERK1) with phosphorylation site T202/Y204. Additionally, for loading control the levels of glyceraldehyde 3-phosphate dehydrogenase (GAPDH) protein were analyzed in a separate setting. Custom antibody-coupled beads were technically validated as described before (Poussin et al., 2014).
Western blot
Cells were transferred on ice, scraped using lysis buffer (10mM Tris pH 7.5, 150mM NaCl, and 0.5% (v/v) NP-40) complemented with protease and phosphatase inhibitors, and the cellular debris removed from the lysate by centrifugation at 10,000×g at 4°C for 10 min. Protein concentration was determined using the BCA test according to the manufacturer’s instructions (Pierce™ BCA Protein Assay Kit). Lysates were then resolved by SDS PAGE (12%) and transferred on a polyvinylidene difluoride membrane (Millipore). Protein visualization was performed in combination with horseradish peroxidase–conjugated secondary antibodies (Cell Signalling Technologies) and the enhanced chemiluminescence system (GE Healthcare) using the Advanced Molecular Vision Chemi Image Unit associated with ChemoStar Imager (INTAS Science Imaging Instruments GmbH) for the following antibodies: Polyclonal rabbit anti-human mitogen-activated protein (MAP) kinase [extracellular signal-regulated kinase (ERK) 1 and ERK2] antibody (Sigma), monoclonal mouse anti-human MAP kinase activated (diphosphorylated ERK1 and ERK2) antibody (Sigma).
Cell proliferation assay
Cell proliferation was analyzed by CellTiter 96 Aqueous One Solution Cell Proliferation Assay (MTS; Promega) according to manufacturer’s instructions. For this, 10,000 cells were plated per well of 96-well tissue culture plates (in 200 µL of medium). Proliferation and viability of inhibitor- and control-treated cells was assayed after 96 hrs. The results represent the mean ±SD of triplicate samples, expressed as a percentage of control.
Colony formation assay
For colony formation assay, 1,000 cells per well were seeded into 6-well plates and on the next day drug treatments were performed. Two weeks after the treatment, cells were fixed and stained using the Fixing/Staining solution (Crystal Violet (0.05% w/v), Formaldehyde (1%), PBS (1×), Methanol (1%)). Washed and air dried dishes were scanned and analysed by eye and using Clono-Counter software package (Niyazi et al., 2007).
Molecular Dynamics Simulations
We previously modeled the ATP-pBRAF homodimer using atomistic molecular dynamics (MD) simulations (Jambrina et al., 2016). We ran longer simulations and analyzed the dynamic adjustment of the αC-helix position by defining the ω angle via the C and N terminal residues of the αC-helix (Cα atoms of Q493 and T508), the anchoring αF-helix (Cα atom of A641).
Our initial conformation for the molecular dynamics (MD) simulation was based on the PDB structures 4E26 (Qin et al., 2012) corresponding to the active forms of the BRAF kinase domain. The ATP and the two Mg2+ ions were docked in the active site based on the 4DFX structure (Bastidas et al., 2012). The initial coordinates of the missing residues (439–447, and 604–609) were modeled using the M4T server (Fernandez-Fuentes et al., 2007a; Fernandez-Fuentes et al., 2007b; Rykunov et al., 2009). The homodimer system included a short, 20 amino acid-long substrate-like peptide (SP20 (Bastidas et al., 2012)) bound in the active site of each monomer. The ATP-pBRAF homodimer has the following phosphorylated activating residues: S446 in the NtA motif, T599 and S602 in the activation loop, and S579 in the catalytic domain. The initial model was essentially symmetrical, the all-atom RMSD between the protomers was 0.07 Å and the dimer interactions are remarkably similar (all-atom RMSD = 0.7 Å obtained for the alignment of the dimer but with the positions of the protomers swapped).
The simulation was performed using explicit water with the CHARMM-27 force field (MacKerell et al., 1998; Mackerell et al., 2004) at constant temperature (298 K) and pressure (1 bar). Langevin dynamics was used with a Langevin damping coefficient of 1 ps−1. For long range electrostatics treatment, the non-bonded switching distance was set to 10 Å and a cut off distance of 12 Å was used. The ShakeH algorithm (Ryckaert et al., 1977) was used with 2 fs time steps. The trajectory was saved every 0.2 ns.
Rule-based model of the RAF/MEK/ERK pathway and allosteric RAF-inhibitor interactions
The RAS/RAF/MEK/ERK pathway mathematical model was formulated using a rule-based approach (Chylek et al., 2014), in which protein-protein interactions are represented by rules. Each rule is associated with a rate law and defines a class of reactions related by a common transformation (Faeder et al., 2009).
A model of CRAF and BRAF activation cycles
CRAF and BRAF phosphorylation sites and binding domains
The model monitors the states of the three phosphorylation sites on CRAF (S259, S338 and S642) and two phosphorylation sites on BRAF (S365 and T753). S259 on CRAF and S365 on wild type (WT) BRAF are inhibitory sites (Roskoski, 2010). Phosphorylation of these sites (yielding pS259 and pS365) and binding of 14-3-3 protein stabilize the inactive conformations of CRAF and BRAF (Dhillon and Kolch, 2002; Dhillon et al., 2002; Leicht et al., 2007; Roskoski, 2010). S338 is an activating site on CRAF (Dhillon and Kolch, 2002; Leicht et al., 2007). Phosphorylation of inhibitory S259 and phosphorylation of activating S338 sites on CRAF are mutually exclusive (Chiloeches et al., 2001). Following S259 dephosphorylation, CRAF requires S338 phosphorylation for full activation in the model. Next, the model includes sites of feedback phosphorylation by ERK, S642 and T753, on CRAF and BRAF, respectively (Ritt et al., 2010).
The model describes the binding and dimerization of RAF kinases and RAF-MEK and RAF-inhibitor interactions specifying the following RAF kinase domains: (1) RAS Binding Domain (RBD), (2) MEK-Binding domain (MEKB), (3) dimerization domain (DIM) and (4) inhibitor-binding pocket (CI and BI on CRAF and BRAF). The rates of these reactions depend on the particular CRAF and BRAF phosphorylation states and the spatial localization of these molecules. Binding and dissociation reactions are described by mass-action rate laws in the model. When the data suggest that (de)phosphorylation reactions are far from saturation, they are described by first order kinetics, otherwise (de)phosphorylation reactions are described by the standard Michaelis – Menten kinetics (Kholodenko, 2006; Kholodenko et al., 1999).
CRAF and WT BRAF recruitment by RAS-GTP and (de)phosphorylation on inhibiting and activating residues
In the absence of RAS-GTP, CRAF resides in the cytoplasm an inactive pS259/S338/S642 state (p denotes phosphorylation), and BRAF resides in an inactive pS365/T753 state. The rate constants of phosphorylation of CRAF and BRAF on S259 and S365 in the cytoplasm are denoted by kS259 and kS365. The model assumes low basal rates of dephosphorylation of CRAF on S259 and BRAF on S365 in the cytoplasm, described by the rate constant kS_259 and kS_365. The values of these and other parameters are given in Table S5.
The data suggest that CRAF phosphorylated or dephosphorylated on S259 can be recruited by RAS-GTP to the plasma membrane (Jaumot and Hancock, 2001). A similar assumption for BRAF (de)phosphorylated on S365 is built in the model. The association and dissociation rate constants for CRAF or BRAF binding to RAS-GTP are designated by kC1 or kB1 and kC_1 or kB_1, respectively. Literature data suggest that the dissociation constant for BRAF binding to RAS-GTP is smaller than this constant for CRAF binding to RAS-GTP (Fischer et al., 2007). Note that all intracellular concentrations are based on to the cytoplasmic water volume in the model (Kholodenko et al., 1999) and thus all association/dissociation rate constants have dimension nm−1 · s−1 and s−1, respectively.
Following the binding to RAS-GTP, the rates of dephosphorylation of CRAF on S259 and BRAF on S365 at the plasma membrane become much faster than such rates in the cytoplasm, due to the dissociation of 14-3-3 proteins (Matallanas et al., 2011). On the contrary, the phosphorylation rates become slower. Therefore, in the model the corresponding (de)phosphorylation rate constants are multiplied by the parameters pMd259 and pM259 and pMd365 and pMd365, respectively (Table S5). Because 14-3-3 proteins are highly abundant, and their abundance does not change under the conditions we analyzed, the model does not explicitly consider these proteins.
CRAF and BRAF can be phosphorylated on S259 and S365, respectively, both in a monomeric form and as a protomer in a dimer. If CRAF/BRAF is phosphorylated on S259/S365 being a protomer in a dimer, the dimer quickly dissociates, which is described in the model as a process that is coupled to the S259/S365 phosphorylation on a CRAF/BRAF protomer. We assume that S338 phosphorylation on CRAF occurs only at the membrane (when CRAF is bound to RAS-GTP, the rate constant kpS338), while S338 dephosphorylation occurs both at the membrane and in the cytoplasm (the rate constant kS338).
Homo and hetero-dimerization of CRAF and wild-type BRAF
When RAF kinases are in active conformations, they can form dimers (Lavoie and Therrien, 2015). Accordingly, in the model only CRAF dephosphorylated on S259 and BRAF dephosphorylated on S365 can participate in dimerization reactions. The rate constants for association and dissociation of BRAF homodimers or CRAF homodimers are designated by kBBd1 and kBBd_1 and kCCd1 and kCCd_1, respectively. The corresponding rate constants of association and dissociation of BRAF-CRAF heterodimers are denoted by kCBd1 and kCBd_1, respectively. The literature data suggest that the dissociation constants of WT BRAF homodimers and CRAF-BRAF heterodimers are slightly less (by a factor of 2) than the dissociation constant for CRAF homodimers (Rajakulendran et al., 2009). The data also suggest that the phosphorylation state of S338 does not influence the rates of CRAF dimerization but substantially affects the activity of the dimer (Garnett et al., 2005), see Table S5.
Spatial localization effects
If two interacting proteins are recruited from the cytoplasm to a membrane or a scaffold, their concentrations locally increase by a factor that equals the ratio of the cytoplasmic volume to the local volume (Kholodenko et al., 2000; Lamson et al., 2006; Markevich et al., 2004b). As a consequence, the apparent Kd of their binding to each other decreases, which is accounted by the parameter in the model, which reflects the volume ratio. The dissociation constants for RAF dimerization in the cytoplasm are high compared to the BRAF and CRAF abundances (Lavoie and Therrien, 2015; Rajakulendran et al., 2009). As a result, RAF dimers are nearly absent in the cytoplasm. However, if RAF molecules are bound to RAS-GTP, they are localized in a much smaller volume layer near the membrane. This spatial localization mechanism is responsible for a potent increase in RAF dimerization and the total RAF activity that follows RAS activation (Kholodenko, 2015; Kholodenko et al., 2000; Markevich et al., 2004b). Therefore, in the model, the association rate constants for RAF homo-/heterodimerization are multiplied by p2 and the dissociation rate constants are divided by p2. Thus, the corresponding equilibrium dissociation constant decreases by . Likewise, if at least one protomer in a RAF dimer is bound to RAS, the dimer is localized in the plasma membrane compartment, and therefore the other RAF protomer has a higher propensity to bind the second RAS-GTP (Kholodenko, 2006; Kholodenko et al., 2000). Thus, the association rate constants for RAF binding to RAS-GTP are multiplied by a factor of p2, and the dissociation rate constants are divided by p2.
Feedback phosphorylation of CRAF and BRAF by active ERK
ERK-mediated feedback strongly affects activities of wild type RAF kinases by inhibiting RAS-GTP binding and RAF dimerization (Dougherty et al., 2005; Ritt et al., 2010). For the sake of simplicity, the RAF inhibitory sites phosphorylated by ERK are represented by single sites, S642 on CRAF and T753 on BRAF. Computational analysis of ERK binding sites on RAF molecules performed using ScanSite (Ehrenberger et al., 2015; Obenauer et al., 2003) suggests that active ERK binds to RAFs via the domain that overlaps with the RAF dimerization interface (Dm); this rules out ERK feedback phosphorylation of RAF homo- and heterodimers. Thus, in the model, ERK can bind to and phosphorylate only RAF monomers.
Based on experimental data (Dougherty et al., 2005; Ritt et al., 2010), the model assumes that if CRAF/BRAF is phosphorylated on S642/T753, the rate constants for RAS association with CRAF or BRAF are p1-fold lower and the dissociation rate constants are p1-fold higher than the same constants before CRAF/BRAF phosphorylation by ERK (see Fig. S1D). As a result, the equilibrium dissociation constant increases by a factor , (Table S5). Likewise, when CRAF/BRAF is phosphorylated on S642/T753, the association rate constants for CRAF or BRAF homo- and heterodimerization become p3-fold lower and the dissociation rate constants become p3-fold higher (Ritt et al., 2010). The influence of the different modifiers (such as p1, p2, p3, etc.) can be multiplicative. For instance, when a CRAF monomer that is bound to RAS-GTP and phosphorylated on S642 dimerizes with a BRAF monomer that is bound to RAS-GTP and phosphorylated on T753, the association rate constant becomes , and the corresponding dissociation rate constant becomes .
Kinase activity of RAF monomers and dimers
A BRAF monomer dephosphorylated on S365 is catalytically active, whereas the kinase activity of CRAF monomers that are dephosphorylated on S259 depends on additional S338 phosphorylation. The kinase activity of active BRAF monomers is five times higher than the activity of active CRAF monomers phosphorylated on S338 (Rushworth et al., 2006). ERK feedback phosphorylation of CRAF on S642 dramatically suppresses CRAF activity (Dougherty et al., 2005; Ritt et al., 2010). ERK feedback phosphorylation of BRAF on T753 does not directly affect BRAF kinase activity (Dougherty et al., 2005; Ritt et al., 2010).
Kinase activity of RAF homodimers is the sum of activities of the corresponding RAF protomers. The literature data suggest that kinase activity of CRAF-BRAF heterodimers is 15-times higher than the activity of BRAF homodimers (Freeman et al., 2013; Rushworth et al., 2006). The data show that when in a dimer S338 on CRAF is not phosphorylated, the dimer activity is only about 40–50% of the full activity of the dimer with CRAF phosphorylated on S338 (Garnett et al., 2005). Kinase activities of all monomer and dimer forms are summarized in Table S4.
Oncogenic BRAFV600E mutant
The S365 state on BRAFV600E does not significantly affect BRAFV600E activity (Hu et al., 2013), but the state of the ERK feedback phosphorylation site, T753, is tracked by the model. Similar to WT BRAF, states of the following domains, RBD, MEKB are DIM and EI, are monitored by the model. BRAFV600E monomers have higher kinase activity than WT BRAF monomers, and dimers containing BRAFV600E have higher kinase activity than dimers with WT BRAF or CRAF (Table S4). The rate constants for BRAFV600E and RAS-GTP association and dissociation and BRAFV600E dimerization rate constants are assumed to be similar to the rate constants for WT BRAF dephosphorylated on S365. Because BRAF600E dimerization potential is higher than that of WT BRAF, and the stability of BRAFV600E dimers is less affected by ERK feedback phosphorylation than in the case of WT BRAF (Lavoie and Therrien, 2015), the ERK phosphorylation-induced changes in the corresponding association/dissociation rate constants are described by the parameters pBE1 and pBE3, which are smaller than the parameters p1 and p3 for WT BRAF (see Table S5).
Downstream activation of MEK and ERK
Active RAF phosphorylates and activates MEK that in turn phosphorylates ERK. For full activation, both MEK and ERK require dual phosphorylation of the activation loop on S218 and S222 for MEK (Alessi et al., 1994) and T202/185 and Y204/187 for ERK1/2 (Chang and Karin, 2001; Kolch, 2000). RAF, MEK and ERK activation is reversed by a number of phosphatases (Alessi et al., 1995; Pulido et al., 1998; Zhao and Zhang, 2001). In our model, the phosphorylation and dephosphorylation of S218 and S222 on MEK, and the T202/185 and Y204/187 on ERK1/2 is based on a model of a dual (de)phosphorylation cycle developed earlier (Markevich et al., 2004a). We further analyze the ERK pathway response to allosteric (type III) MEK inhibitors, which show conformation selectivity. Particularly, we analyze binding of trametinib to MEK kinase, which binds about 10 times weaker to double-phosphorylated MEK than to MEK dephosphorylated at one of the activating sites, S218 (Caunt et al., 2015; Gilmartin et al., 2011; Hatzivassiliou et al., 2013).
Core model for allosteric interactions of RAF monomers and dimers with inhibitors
Each state of a RAF molecule is characterized by the phosphorylation states of key amino acid residues, which control conformational changes and activity (S259, S338 and S642 for CRAF and S365 and T753 for BRAF). Furthermore, the RAF conformational and activity state depends on binding to RAS-GTP, another RAF molecule in a dimer, or an inhibitor. For any particular phosphorylation state and set of binding partners there exists a thermodynamic equilibrium for the kinase in active and inactive conformations due to thermal motions of the molecule (Arora and Brooks, 2007; Daily et al., 2010; Hakulinen and Puranen, 2016; Lavoie and Therrien, 2015; Shao et al., 2017). Structurally, the state of a RAF molecule is described by the positions of the DFG motif and αC-helix, which in turn depend on phosphorylation and its binding partner. Because of thermal motions, in each phosphorylation and binding state, a RAF molecule can switch between DFG-IN and DFG-OUT positions of the DFG-motif, and between αC-IN and αC-OUT positions of αC-helix.
A RAF inhibitor generally binds to different conformations of RAF molecule with different microscopic Kd‘s. The smallest microscopic Kd corresponds to the preferential RAF conformation for this inhibitor. Because of the thermal motions, a RAF molecule can spontaneously switch between different conformations. This dynamic equilibrium is described by the equilibrium constants of conformational transitions, which in turn depend on the phosphorylation and dimerization state of a molecule. As a result, inhibitor binding is determined by the apparent dissociation constant whose difference with the smallest microscopic Kd depends on both thermal transition equilibrium constants and factors that describe the inhibitor preference for different RAF conformations. Here we set to derive the relationships that express the apparent in terms of the microscopic Kd’s, the equilibrium constants of DFG-IN/DFG-OUT transitions, αC-IN/αC-OUT transitions and factors that describe the inhibitor preference for different conformational states of RAF molecules. We illustrate our analysis using the kinetic schemes in Fig. S3B–E. Each scheme assumes that the phosphorylation and dimerization states of a RAF molecular form presented in this scheme do not change during thermal movements of the DFG motif and αC-helix between their IN and OUT positions.
Thermodynamics of binding of conformation selective, diverse RAF inhibitors to different RAF conformations (DFG-IN/OUT, αC-helix IN/OUT)
A kinetic diagram for an inhibitor binding to a RAF molecule and the thermal transitions between eight possible DFG-IN/OUT and αC-helix IN/OUT conformations of free and inhibitor-bound RAF forms is shown in Fig. S3B, and the reactions involved are presented below. We denote the equilibrium constants for IN/OUT transitions of the DFG-motif for a fixed IN or OUT αC-helix position by b1 and b2, respectively. Similarly, we will denote the equilibrium constants for IN/OUT transitions of the αC-helix for a fixed IN or OUT state of the DFG-motif by c1 and c2, respectively:
| (1) |
| (2) |
Clearly, these equilibrium constants of conformational transitions are different for distinct phosphorylation and dimerization state of RAF molecules. The detailed balance principle imposes the following constraints (Kholodenko et al., 1999; Kholodenko et al., 1998):
| (3) |
If b1=b2 then movements of the DFG-motif and αC-helix are independent. If b1>b2 cooperativity exists between DFG and αC motions. Following Eq. 3, we introduce the cooperativity coefficient γ and make the following substitutions:
| (4) |
At present, three types of RAF inhibitors, which preferably bind to (1) DFG-IN, αC-IN (CI/DI), (2) DFG-OUT, αC-IN (CI/DO) or (3) DFG-IN, αC-OUT (CO/DI) conformations of RAF molecules, have been produced. Each inhibitor type binds preferably to one out of the possible four DFG-IN/OUT, αC-IN/OUT conformations of RAF molecules. Preferential binding is described by the smallest microscopic , but each inhibitor can also bind to other conformations (Park et al., 2012), yet with larger Kd’s. For each known RAF inhibitor type, Eq. 5 presents the coefficients that multiply the smallest microscopic to obtain the Kd’s for binding of this inhibitor type to less preferable DFG and αC-helix conformations. For instance, CI/DI inhibitor (ICI/DI) binds with the smallest microscopic to the preferred DFG-IN, αC-IN RAF conformation, but its Kd for binding to the DFG-OUT, αC-IN conformation equals , its Kd of binding to DFG-IN, αC-OUT conformation equals , and its binding Kd to DFG-OUT, αC-OUT conformation equals .
| (5) |
Interactions of different types of inhibitors (I) with each possible conformation (DFG-IN/OUT, αC-helix-IN/OUT) of a RAF molecule are presented in Figs. S3C–E and Eqs. 6–8. These equations include the microscopic dissociation constants and the equilibrium constants of conformational transitions for ICI/DI (Fig. S3C and Eq. 6), ICI/DO (Fig. S3D and Eq. 7) and ICO/DI (Fig. S3E and Eq. 8) inhibitors in Eqs. 6–8.
| (6) |
| (7) |
| (8) |
The kinetic schemes (Figs. S3C–E) and Eqs. 6–8 are valid for every monomeric and dimeric forms of BRAF and CRAF molecules. For example, in the BRAF-CRAF dimerization cycle and allosteric inhibitor interactions with RAF monomers and dimers shown in the lumped reaction scheme on Fig. S3F at the left, the binding of inhibitor to a BRAF molecule is expanded into 12 reactions that take into account all possible positions of the DFG-motif and αC-helix.
For cycles of the inhibitor binding and thermal motion reactions shown in Figs. S3C–E and Eqs. 6–8, we can write the following equations, which capture the relationships between the equilibrium concentrations of RAF molecules that have different positions for the DFG motif and αC-helix and that are bound to different inhibitor types:
| (9) |
For any inhibitor type (ICx/Dx), the apparent dissociation constant for inhibitor binding to a RAF molecule in a particular phosphorylation and dimerization state can be expressed as follows,
| (10) |
Here, [DFG − IN, αC − IN], [DFG − IN, αC − OUT], [DFG − OUT, αC − IN], [DFG − OUT, αC − OUT], [(DFG − IN, αC − IN) − ICx/Dx], [(DFG − OUT, αC − IN) − ICx/Dx], [(DFG − IN, αC − OUT) − ICx/Dx] and [(DFG − OUT, αC − OUT) − ICx/Dx] are the equilibrium concentrations of free and inhibitor-bound RAF molecules, respectively, that retain particular states of the DFG motif and αC-helix positions. These concentrations are related by the equilibrium constants of thermal transitions and the microscopic dissociation constants, as presented in Eqs. 9. Using Eqs. 9 and 10, the apparent dissociation constant for inhibitor binding to a RAF molecule in any particular phosphorylation and dimerization state can be expressed through the microscopic dissociation constants, the factors that describe the inhibitor preference for different conformational states of RAF molecules, and the equilibrium constants of IN/OUT transitions of the DFG-motif and αC-helix.
For a DFG-IN, αC-IN inhibitor type (ICI/DI), the apparent dissociation constant is expressed, as follows,
| (11) |
For a DFG-OUT, αC-IN inhibitor type (ICI/DO), the apparent dissociation constant is expressed, as follows,
| (12) |
For a DFG-IN, αC-OUT (ICO/DI) inhibitor type, the apparent dissociation constant is expressed, as follows,
| (13) |
Assuming that coefficients that distinguish the dissociation constants of a particular inhibitor between the preferential RAF conformation and other conformations are large, Eqs. 11–13 simplify, as follows:
| (14) |
| (15) |
| (16) |
Table S2 shows the estimated value ranges for the coefficients b, c and γ. For each inhibitor type and each RAF state the apparent dissociation constants are automatically calculated from Eqs. 11–13 using an Excel spreadsheet “Data S1.xlsx”. From Table S2, it follows that the probability to observe the DFG-OUT, αC-OUT state of a protomer is less than 1% in RAF dimers. The low probability of this state can explain why there are no reported PDB structures with RAF protomers in DFG-OUT, αC-OUT conformations (see Fig. 1D). There are no known CO/DO inhibitors that would lock a RAF protomer in this conformation.
Relationships between the apparent Kd’s and thermodynamic factors that characterize allosteric inhibitor effects
The equilibrium constants of reactions in each cycle of RAF dimerization and inhibitor binding obey the detailed balance principle. According to this principle, the product of the equilibrium dissociation constants along a closed cycle of binding/dissociation reactions must be equal to 1, since the overall change in free energy is zero. Since the IN/OUT thermal motions include inhibitor-bound RAF states and RAF monomers and dimers, the detailed balance principle imposes constraints on the values of the apparent dissociation constants in the cycle of inhibitor binding and dimerization (see below).
For a cycle of binding of an inhibitor to BRAF (B) and CRAF (C) monomers and a BRAF-CRAF heterodimer (BC), we have the lumped reaction scheme (Fig. S3F) whose reactions are given in Eq. 17 (without elaboration of different conformational states),
| (17) |
The detailed balance principle requires that the following conditions be satisfied,
| (18) |
The thermodynamic constraints allow us to express the dissociations constants, K4 – K10, in terms of the dimerization constant K1, inhibitor binding constants K2 and K3 and thermodynamic factors, f, g1, and g2 (Kholodenko, 2015). The facilitation factor (f), which relates the dimerization constants of free monomers (K1) and inhibitor-bound and free monomers (K4), describes the inhibitor-induced change in dimerization affinity (Kholodenko, 2015). If the facilitation factor f is less than 1, the dimers with only one bound molecule of inhibitor are stabilized by the inhibitor (Kholodenko, 2015). The thermodynamic factor g1 describes the differences in binding of the first inhibitor molecule to different protomers in an asymmetric dimer. The thermodynamic factor g2 connects the dissociation constant K5 for the binding of the second inhibitor molecule to a dimer with one inhibitor molecule bound and the dissociation constant K2 for the inhibitor binding to a monomer. When g2 > 1 the second inhibitor molecule binds to a dimer with one inhibitor molecule bound less effectively than the inhibitor binds to a kinase monomer. The expressions that relate thermodynamic factors and apparent dissociation constants are given in Eq. 22.
Equations 18 allow us to obtain the following relationships between the thermodynamic factors g1 and g2 and the apparent dissociation constants.
For a ICO/DI inhibitor, these relationships are captured by the following expressions,
| (19) |
In addition, the detailed balance relationships require that the following condition is satisfied
| (20) |
Although the values of each apparent dissociation constant are different for different RAF states, they all must satisfy Eqs. 20. The a-coefficients are specific for every inhibitor. Coefficients γ, b and c characterize a given state of a RAF molecule (determined by its binding partners and the phosphorylation status of its phospho-sites). Thus, for specific values of the a-coefficients and a given RAF molecule state, Eq. 20 imposes thermodynamic constraints on the coefficients γ, b and c, which are accounted for in the model.
For ICI/DI and ICI/DO inhibitors, the analogs of Eq. 19 are the following,
| (21) |
For each inhibitor type (IαI/DI, IαI/DO, and IαO/DI), Eqs. 19–21 relate the thermodynamic factors gi with the apparent Kd’s of inhibitor binding defined in Table S2.
Eqs. 18–21 allow us to relate the phenomenological thermodynamics factors (g1, and g2) with the apparent Kd’s of inhibitor binding to different RAF forms. Eq. 22 expresses the dissociations constants K4 – K10 in terms of phenomenological factors f, g1 and g2 introduced in Ref (Kholodenko, 2015) and in terms of the apparent dissociation constants introduced in Table S2 and the factor f. For each RAF inhibitor, the value of the factor f is a unique feature that is not directly determined by the positions of the αC-helix and DFG motif.
| (22) |
Binding of two different inhibitors to RAF molecules
Below we analyze the binding of two different inhibitors (I1 and I2) to RAF monomers and dimers in the RAF dimerization cycle. The reaction schemes are presented on Fig. S3G and Table S3, where the subscripts a and b refer to inhibitors I1 and I2.
Detailed balance principle requires that the following conditions must be satisfied:
| (23) |
Similarly to the one-inhibitor case, the thermodynamic constraints Eq. 23 allow us to express dissociations constants K4 – K16 in terms of the dimerization constant K1, inhibitor binding constants K2a, K2b, K3a and K3b and thermodynamic factors, fa, fb, g1a, g1b, g2a, g2b, g3a and g3b. Thermodynamic factors fa, fb, g1a, g1b, g2a, g2b describe the same effects as for the one-inhibitor case, and subscripts a and b refer to inhibitors I1 and I2. The factor g3a quantifies the difference (normalized on facilitation factors fa and fb) in the dissociation constants of I1 binding to a free RAF monomer versus to the protomer in RAF dimer, when the other protomer is occupied by I2. Likewise, the factor g3b describes the difference (normalized on facilitation factors fa and fb) in dissociation constants of I2 binding to monomer versus protomer in RAF dimer, when the other protomer is occupied by I1. Note that we have redefined factors g3a and g3b compared to Ref. (Kholodenko, 2015) to make expressions for the dissociation constants K13 and K16 symmetric with respect to fa and fb (see Table S3). If we denote the factor g3a defined in Ref. (Kholodenko, 2015) as , it can be expressed via the factor g3a introduced here, as follows, . Likewise, the factor defined in Ref. (Kholodenko, 2015) is expressed via the factor g3b, as follows, .
Equations 23 allow us to obtain the following relationships between the thermodynamic factors g1a, g1b, g2a, and g2b and the apparent dissociation constants. If both I1 and I2 are DFG-IN, αC-OUT inhibitors, these relationships read,
| (24) |
In addition, the detailed balance relationships require the following conditions to be satisfied,
| (25) |
Thermodynamic coefficients for binding of CI/DI and CI/DO inhibitors and their combinations are readily obtained after substituting by and by . For example, for a pair of CI/DO (a) and CO/DI (b) inhibitors, Eqns. 24 read,
| (26) |
The detailed balance relationships Eq. 23 in this case require the following condition to be satisfied,
| (27) |
Eqs. 26–27 are valid for the pair of CI/DI (a) and CO/DI (b) inhibitors as well.
Eqs. 23–27 allow us to relate the phenomenological thermodynamics factors (g1a, g1b, g2a and g2b) with the apparent Kd’s of inhibhitor binding to different RAF forms. Table S3 expresses the dissociation constants, K4 – K16 in terms of the phenomenological factors fa, fb, g1a, g1b, g2a, and g2b and also in terms of the apparent dissociation constants introduced in Table S2 and smaller numbers of free parameters, which are g3a, g3b, fa and fb. As above, the value of the factors g3 and f are unique features of each inhibitor that are not directly determined by the positions of the αC-helix and DFG motif.
Similar reactions of homodimerization of RAF molecules, inhibitor binding and resulting relationships between the equilibrium dissociation constants and the thermodynamic factors describing allosteric effects are presented in the files “Data S1.xlsx” and “Data S2.xml”.
Total kinase activity of different monomeric and dimeric RAF forms
The total kinase activity is proportional to the weighted sum of the concentrations of inhibitor-free monomers and dimers and partially inhibited dimers (Table S4). Inhibitor bound RAF monomers and RAF dimers that have bound two inhibitor molecules do not have kinase activity.
Simulations of the rule-based model
The model code file was processed by the BioNetGen software package (Blinov et al., 2004; Harris et al., 2016) to derive the reaction network and the corresponding system of coupled ordinary differential equations (ODEs) implied by the rules. The ODEs were numerically integrated using BioNetGen’s default algorithmic parameter settings and interface to CVODE in the SUNDIALS software package (Hindmarsh et al., 2005). Sensitivity coefficients of the model-predicted drug interaction metrics (CI and AUC) were calculated as the fractional change in the AUC or CI divided by the fractional parameter change (variation of the parameter change between 1 and 5% practically did not affect the sensitivity values).
Assessment of drug combination efficiency: conditions for additivity, synergy and antagonism
Loewe isoboles are straight lines for non-interacting drugs
Drug interactions are commonly described in terms of the Bliss independence or the Loewe additivity, synergy and antagonism (Yeh et al., 2009). Although the Bliss independence is an intuitively clear concept, it does not account for nonlinearity of dose-response curves, formally resulting in interactions of a drug with itself, when the drug dose increases (Greco et al., 1995; Keith et al., 2005). Therefore, we mainly use Loewe isoboles that are lines of constant inhibition across a two-dimensional plane of two drug concentrations.
Let ICZ1 and ICZ2 be the concentrations of inhibitors I1 and I2 that produce the same effect Z when given separately. Z indicates an arbitrary inhibition level, which can be, for example, 10, 20, 30, 50, 70 or 90%. We create a response surface by plotting lines of constant Z values on the (Y, X) plane where Y = [I1]/ICZ1 and X = [I2]/ICZ2. If inhibitors, I1 and I2, do not interact with each other, the same effect Z is achieved not only by doses I1 = ICZ1, I2 = ICZ2, but also by any dose combination that satisfy the following equation,
| (28) |
Eq. 28 determines a straight line in the (Y, X) plane. Loewe isoboles that are straight lines indicate the absence of drug interactions, which is termed Loewe additivity (see Fig. S6B). If a combination of two drugs is more efficient than either of the two drugs on their own, i.e., they demonstrate synergy, the left part of Eq. 28 is less than 1, and the Loewe isoboles are concave. Conversely, if drugs antagonize each other the Loewe isoboles are convex (see Fig. S6B).
Importantly, to assess synergy effects by Loewe isoboles we can use either absolute inhibitor doses or doses normalized by ICZ1 and ICZ2. Normalization of drug doses results only in the linear stretching or compression of the Loewe isoboles along the vertical and horizontal axes (see Fig. S6B). In the case of the Loewe additivity each straight line given by Eq. 28 will still be the straight line, even if I1 and I2 are not normalized by ICZ1 and ICZ2. In case of drug synergy or antagonism, each concave or convex line will remain concave or convex, respectively.
When the number of data points across the two-dimensional plane of inhibitor doses is insufficient to reconstruct the Loewe isoboles, the Talalay-Chou combination index (CI) can be used (Chou, 2006). For any particular drug combination and a dose ratio, the CI allows detecting whether the Loewe isoboles are under a straight line of non-interacting drugs, i.e., isoboles are concave, or they are above this line, i.e, convex.
| (29) |
Therefore, circumventing the need to search the entire response surface of drug mixtures, the CI indicates synergy when CI < 1 and antagonism when CI > 1 (Chou, 2006). The definition of the Talalay-Chou combination index CI (see Eq. 29) can be extended to analyze not only the levels of signal inhibition ICZ, but also the levels of signal activation above the basal level. For levels of the signal above the basal level there can be two concentration points that result in the same signal level (see Figs. 3–6). In such cases the concentration value on the descending part of the dose-response curve is chosen. For example, for dose-response curves in Figs. 3–6, the higher concentration values should be chosen during analysis of synergy effects between RAF inhibitors for the cases of activation of the ERK pathway by RAF inhibitors. For example, in Fig. 5C the doses of inhibitors were normalized on the doses that result in 250% of ppERK activation to interpret experimental data. It can be clearly seen that the dose-response curve for a combination of B0R and sorafenib is essentially lower than dose-response curves for either inhibitor applied separately (Fig. 5C).
Measures of drug effects in the case of paradoxical pathway activation by a drug
Both Loewe isoboles and the Talalay-Chou combination index were developed to assess effects of drugs that can only inhibit a target process and not activate it. RAF inhibitors are known to activate ERK signaling at low doses and inhibit signaling at high doses. Thus, these methods are not directly applicable for low doses of RAF inhibitors. To assess the efficiency of a drug combination for both low and high drug doses we have also calculated area under normalized dose-response curves in present paper (Kholodenko, 2015; Pozdeyev et al., 2016; Yadav et al., 2014).
Optimal stoichiometry of drug combinations
For a combination of two independent drugs (I1 and I2), the total dose is the same for each point on the straight line of drug additivity (Fig. S6B). However, if two drugs exhibit synergy, their total dose changes for different points on the Loewe isobole. Note that the drug doses can be normalized by the corresponding IC levels or given in absolute, molar concentrations. For each inhibition effect Z, the optimal drug doses ( and ) correspond to the point on the ICZ isobole that yields the minimal total dose (T). The minimum of the absolute molar doses and the minimum of the normalized doses are obtained by solving the conditional extremum problem, Eq. 30 and Eq. 31, respectively
| (30) |
| (31) |
Finding of the conditional minimums in Eqs. 30 and 31 is illustrated in Fig. S6C. Here, lines I1 + I2 = T and are the tangent lines that touch the ICZ isobole at the point where the sum of molar or normalized drug doses is minimal.
Importantly, the distinctive features of Loewe isoboles that separate synergy, additivity and antagonism do not depend on the normalization method, or even absolute, non-normalized inhibitor doses can be plotted (Kholodenko, 2015). Thus, if two drugs show synergy at a certain ICZ level, both molar (see Eqn. 30) and normalized (see Eqn. 31) total doses for a drug combination will be less than the dose of each drug on its own that causes the same inhibition level (see Fig. S6C). The converse statement is also true, i.e., if the same inhibition effect (ICZ) can be achieved by combining these two drugs at the lower molar or normalized sum of their doses compared to the dose of each drug on its own.
Bliss independence criterion as alternative measure of efficiency of drug combination
The Bliss independence criterion assumes that the relative effect of a drug at a particular concentration is independent of the presence of the other drug (Greco et al., 1995; Keith et al., 2005; Yeh et al., 2009). If is the inhibition effect of i-th dose of drug A, and is the effect of j-th dose of drug B, then the expected inhibition effect of Bliss independent drugs is (if and are defined as percentage effects (their product must be divided by 100). Positive or negative deviations from this prediction describe synergistic and antagonistic interactions, respectively. If we denote the actual effect of combination of drug A in dose i and drug B in dose j, the value gives a quantitative measure of synergy. If the dose responses are measured for a set of concentration points, then total score of drug combination efficiency can be calculated by summation over different doses (Holbeck et al., 2017).
| (32) |
If the total score YAB divided by the number of drug doses combinations N1 · N2 is much greater than zero, the combination is considered as highly synergistic. The greatest normalized synergy score found in the ALMANAC study, which assessed over 5,000 pairs of FDA-approved cancer drugs, was approximately 50 (in %) (Holbeck et al., 2017).
The Bliss independence and Talalay-Chou CI are two separate criteria, and synergy according to one criterion does not mean synergy according to the other (Greco et al., 1995; Keith et al., 2005). The Bliss independence criterion is simple and easy to measure. It is widely used in large-screening studies, because it generally requires much less dose-response measurements than the Talalay-Chou criterion. However, Bliss independence does not account for nonlinearity in the dose response curve of each of the individual drugs. It can combine a deviation from additivity due to drug interactions with deviations due to merely the increase in the total drug dosage. We used the Bliss independence criterion to estimate efficiency of drug combinations when the number of measured dose-response points was too small to use Loewe isoboles or Talalay-Chou CI. For the combinations of RAF inhibitors that we analyzed, Bliss independence was a weaker criterion than the Talalay-Chou criterion. In our experiments, synergy effect observed using the Loewe isoboles or Talalay-Chou criterion always implicated high synergy according to the Bliss independence criterion.
Induction of RAF dimerization increases the concentration of RAS-RAF complexes and RAF priming
RAF inhibitors inhibit RAF kinase activity, lock RAF molecules in specific conformations, and induce dimerization of RAF molecules (Hatzivassiliou et al., 2010; Karoulia et al., 2016; Kholodenko, 2015; Poulikakos et al., 2010). It was experimentally observed that RAF inhibitors increase the concentrations of RAS-RAF complexes (Hatzivassiliou et al., 2010; Karoulia et al., 2016). These data were interpreted as proof that RAF inhibitors can directly promote RAS-RAF interaction (Karoulia et al., 2016), although a structural mechanism explaining this effect is unknown. Here we show that induction of RAF dimerization is sufficient to explain the increase in the RAS-RAF complex concentration caused by RAF inhibitors.
As an illustration, first we consider a simplified, toy model of RAF recruitment by active RAS to the plasma membrane and subsequent RAF dimerization. A complete list of reactions for the simplified model is presented in Eq. 33.
| (33) |
In Eq. 32 factor p2 accounts for effects of spatial localization of RAF molecules in the near-membrane space, which results in an increase of their local concentration with respect to the cytoplasmic volume (Kholodenko et al., 2000).
The simplified model allows one to obtain an analytical expression for the total concentration of RAS-RAF complexes ([RAS − RAF]T) at steady states (see Eq. 34).
| (34) |
Eq. 34 shows that a decrease in the dissociation constant for RAF dimerization, Kdim, leads to an increase of the total concentration of RAS-RAF complexes. In other words, an increase in the affinity of RAF dimerization accounts for an increase in the concentration of RAS-RAF complexes.
The simplified model illustrates that if a RAF inhibitor increases the RAF dimerization affinity, it inevitably promotes RAS-RAF interaction. We have used our full model to check whether the induction of RAF dimerization by RAF inhibitors can account for the known effect of promotion of RAS-RAF interaction and RAF priming. Fig. S9G shows that an increase in inhibitor concentration results in an increase of CRAF and BRAF bound to RAS-GTP. The highest amount of RAS-RAF complexes corresponds to inhibitors that induce the highest levels of RAF dimerization and paradoxical activation.
Alternative mechanisms of RAF inhibitor resistance
Not only RAS oncogenic mutations (or overexpression of receptor tyrosine kinases resulting in high RAS-GTP levels) confer resistance to RAF inhibitors (Nazarian et al., 2010; Straussman et al., 2012), but also other mechanisms, such as BRAFV600E splice variants (Poulikakos et al., 2011) and CRAF overexpression (Lito et al., 2013; Montagut et al., 2008). In this section we will consider the efficiency of inhibitor combinations in cells that exhibit these resistance mechanisms. We do not analyze the cases when resistance to RAF inhibitors is explained by bypassing of signaling through MEK, e.g., COT overexpression (Lito et al., 2013).
To describe RAS-to-ERK signaling in the case when p61 BRAFV600E splice variants are expressed, the corresponding additional p61 BRAFV600E molecule was added to our rule-based model. The modified file (“Data S3.xml”) is provided in Supplemental files. p61 splice variant of mutant BRAFV600E lacks RBD domain (Poulikakos et al., 2011). In the model, this splice variant is assumed to have 10-fold higher affinity for dimerization. The simulation results show that a combination of CO/DI and CI/DO inhibitors demonstrates synergy and effectively inhibit ERK signaling in cells expressing splice variants of mutant BRAF (Fig. S9H). Model also suggests if RAF inhibitor resistance is caused by CRAF overexpression, both a combination of CI/DI and CI/DO inhibitors, and a combination of CO/DI and CI/DO inhibitors demonstrate strong synergistic effects in inhibition of ERK signaling (Figs. S9I and S9J).
QUANTIFICATION AND STATISTICAL ANALYSIS
All measurements were done in 3 replicates, if not specified otherwise in the respective figure legends. Error bars represent standard error of mean. Details on assessment of drug synergism are described above.
DATA AND SOFTWARE AVAILABILITY
All MESOSCALE and Luminex raw data are presented in supplemental information tables. The model SBML file is available in supplemental information.
Supplementary Material
Data S1 related to Figure 2. Spreadsheet for calculation of apparent dissociation constants.
Data S2 related to Figure 2. Model code in SBML format.
Data S3 related to Figure 2. Model code including BRAF splice variants in SBML format.
Table S1 related to Figures 1 and 2. Summary of the structural properties of RAF inhibitors.
Table S2 related to Figure 2. Estimated ranges for the coefficients b, c and γ.
Table S3 related to Figure 2. Reactions and relationships between equilibrium dissociation constants for a model of BRAF-CRAF heterodimers and two allosteric inhibitors.
Table S4 related to Figure 2. Relative activities of different RAF kinase forms.
Table S6 related to Figure 5. Model-predicted ratios of IC50 levels to the Kd of binding to BRAFV600E monomers for different inhibitors and mutational conditions.
Table S5 related to Figure 2. Parameters of the rule-based model of RAS-RAF-MEK-ERKcascade.
Key resources table
| Reagent or resource | Source | Identifier |
|---|---|---|
| Antibodies | ||
| Anti-MAP Kinase (ERK-1, ERK-2) antibody produced in rabbit | Sigma-Aldrich | Cat. No. M5670 |
| Monoclonal Anti-MAP Kinase, Activated (Diphosphorylated ERK-1&2) antibody produced in mouse | Sigma-Aldrich | Cat. No. M8159 |
| Anti-rabbit IgG, HRP-linked Antibody | Cell Signalling Technologies | Cat. No. 7074 |
| Anti-mouse IgG, HRP-linked Antibody | Cell Signalling Technologies | Cat. No. 7076 |
| Chemicals, Peptides, and Recombinant Proteins | ||
| Vemurafenib (PLX4032) | Selleckchem | Cat. No. S1267 |
| Dabrafenib (GSK2118436) | Selleckchem | Cat. No.S2807 |
| TAK-632 | Selleckchem | Cat. No.S7291 |
| Trametinib (GSK1120212) | Selleckchem | Cat. No.S2673 |
| Sorafenib tosylate | Axon Medchem | Axon 1397 |
| SB-590885 | R&D Systems | 2650/10 |
| B0R (2,6-difluoro-N-(3-methoxy-2H-pyrazolo[3,4-b]pyridin-5-yl)-3-[(propylsulfonyl) amino]benzamide) | Genentech, (Wenglowsky et al., 2011) | B0R |
| Critical Commercial Assays | ||
| pMEK assay | ProtATonce | P-MP2K1-A01 |
| pERK assay | ProtATonce | P-MK03-A01 |
| GAPDH assay | ProtATonce | P-GAPDH-A01 |
| Assay buffer | ProtATonce | PPK40-A01 |
| Lysis buffer | ProtATonce | PLY40-A01 |
| Phospho(Ser217/221)/Total MEK1/2 Assay Whole Cell Lysate Kit | Meso Scale Discovery | K15129D |
| Phospho(Thr202/Tyr204; Thr185/Tyr187)/Total ERK1/2 Assay Whole Cell Lysate Kit | Meso Scale Discovery | K15107D |
| Pierce™ BCA Protein Assay Kit | ThermoFisher Scientific/Pierce | Cat. No. 23225 |
| CellTiter 96® Aqueous One Solution Cell Proliferation Assay (MTS) | Promega | Cat. No. G3581 |
| Deposited Data | ||
| Dose-response MESOSCALE data of MEK and ERK signaling in cells treated with RAF inhibitors | This study | Data S4.xlsx |
| Dose-response Luminex data of MEK and ERK signaling in cells treated with RAF inhibitors | This study | Data S4.xlsx |
| Experimental Models: Cell Lines | ||
| SKMEL2 | ATCC | HTB-68 |
| A375 | ATCC | CRL-1619 |
| MEL-JUSO | DSMZ | ACC 74 |
| M249 parental and resistant | Antoni Ribas (Nazarian et al., 2010) | |
| Software and Algorithms | ||
| Calculation number of colonies | Clono-Counter | (Niyazi et al., 2007) |
| Simulation of rule-based models | BioNetGen | http://www.csb.pitt.edu/Faculty/Faeder/?page_id=409 |
| Spreadsheet for calculation of apparent dissociation constants. | This study | Data S1.xlsx |
| Model code in SBML format | This study | Data S2.xml |
| Model code including BRAF splice variants in SBML format | This study | Data S3.xml |
Highlights.
RAF dimers are effectively targeted by two structurally different RAF inhibitors
Next-generation model integrates kinetic, thermodynamic and cellular data
Best RAF inhibitor combinations are selected for diverse genetic backgrounds
Predicted RAF inhibitor combinations overcome oncogenic RAS signaling to ERK
Acknowledgments
We thank Poulikos Poulikakos, Mark Lemmon, Colm Ryan, Lan Nguyen and Dirk Fey for insightful discussions and UCD IT services for providing access to UCD Sonic computational cluster. Also, thanks are given to the Irish Centre for High-End Computing (ICHEC) for the provision of computational facilities. This work was supported by the by the EU H2020 grants MSCA-IF-2016 SAMNets (Grant no. 750688), SmartNanoTox (Grant no. 686098), NanoCommons (Grant no. 731032), Mel-Plex (Grant no. 642295), Science Foundation Ireland (Grant no.14/IA/2395), NIH/NIGMS grant R01GM111510 and the JDACS4C program of DOE and NCI.
Footnotes
Publisher's Disclaimer: This is a PDF file of an unedited manuscript that has been accepted for publication. As a service to our customers we are providing this early version of the manuscript. The manuscript will undergo copyediting, typesetting, and review of the resulting proof before it is published in its final citable form. Please note that during the production process errors may be discovered which could affect the content, and all legal disclaimers that apply to the journal pertain.
Author contribution
B.N.K., O.S.R., J.Ra. and W.K. conceived the study. B.N.K., O.S.R., W.S.H. and R.G.P. developed a model with the input from W.K., D.M., N.R. and J.Ra. E.R. and S.G. performed analysis of RAF protomer structures and carried out MD simulations. B.N.K., O.S.R., W.K., N.R. and J.Ra. designed wet-lab experiments. F.K., N.R., J.Ra., J.Ro., L.A., A.K., O.S.R. and C.F. carried out the experiments. K.E.E. designed and prepared illustrative materials. B.N.K. wrote the manuscript with input from all authors, especially from O.S.R., J.Ra. and W.K. All authors read and approved the final version of the manuscript.
Declaration of interests.
L.A. is a founder of ProtaTonce, a biomarker discovery and compound assessment company. Patent application (No. 1808321.2) related to this work was filed (O.S.R., J.Ra, W.K. and B.N.K.).
References
- Adelmann CH, Ching G, Du L, Saporito RC, Bansal V, Pence LJ, Liang R, Lee W, Tsai KY. Comparative profiles of BRAF inhibitors: the paradox index as a predictor of clinical toxicity. Oncotarget. 2016;7:30453–30460. doi: 10.18632/oncotarget.8351. [DOI] [PMC free article] [PubMed] [Google Scholar]
- Alessi DR, Gomez N, Moorhead G, Lewis T, Keyse SM, Cohen P. Inactivation of p42 MAP kinase by protein phosphatase 2A and a protein tyrosine phosphatase, but not CL100, in various cell lines. Curr Biol. 1995;5:283–295. doi: 10.1016/s0960-9822(95)00059-5. [DOI] [PubMed] [Google Scholar]
- Alessi DR, Saito Y, Campbell DG, Cohen P, Sithanandam G, Rapp U, Ashworth A, Marshall CJ, Cowley S. Identification of the sites in MAP kinase kinase-1 phosphorylated by p74raf-1. EMBO J. 1994;13:1610–1619. doi: 10.1002/j.1460-2075.1994.tb06424.x. [DOI] [PMC free article] [PubMed] [Google Scholar]
- Arora K, Brooks CL., 3rd Large-scale allosteric conformational transitions of adenylate kinase appear to involve a population-shift mechanism. Proc Natl Acad Sci U S A. 2007;104:18496–18501. doi: 10.1073/pnas.0706443104. [DOI] [PMC free article] [PubMed] [Google Scholar]
- Baljuls A, Kholodenko BN, Kolch W. It takes two to tango--signalling by dimeric Raf kinases. Molecular bioSystems. 2013;9:551–558. doi: 10.1039/c2mb25393c. [DOI] [PubMed] [Google Scholar]
- Bastidas AC, Deal MS, Steichen JM, Keshwani MM, Guo Y, Taylor SS. Role of N-Terminal Myristylation in the Structure and Regulation of cAMP-Dependent Protein Kinase. Journal of molecular biology. 2012;422:215–229. doi: 10.1016/j.jmb.2012.05.021. [DOI] [PMC free article] [PubMed] [Google Scholar]
- Bessman Nicholas J, Bagchi A, Ferguson Kathryn M, Lemmon Mark A. Complex Relationship between Ligand Binding and Dimerization in the Epidermal Growth Factor Receptor. Cell Reports. 2014;9:1306–1317. doi: 10.1016/j.celrep.2014.10.010. [DOI] [PMC free article] [PubMed] [Google Scholar]
- Blinov ML, Faeder JR, Goldstein B, Hlavacek WS. BioNetGen: software for rule-based modeling of signal transduction based on the interactions of molecular domains. Bioinformatics. 2004 doi: 10.1093/bioinformatics/bth378. [DOI] [PubMed] [Google Scholar]
- Borisov NM, Chistopolsky AS, Faeder JR, Kholodenko BN. Domain-oriented reduction of rule-based network models. IET Syst Biol. 2008;2:342–351. doi: 10.1049/iet-syb:20070081. [DOI] [PMC free article] [PubMed] [Google Scholar]
- Caunt CJ, Sale MJ, Smith PD, Cook SJ. MEK1 and MEK2 inhibitors and cancer therapy: the long and winding road. Nat Rev Cancer. 2015;15:577–592. doi: 10.1038/nrc4000. [DOI] [PubMed] [Google Scholar]
- Chang L, Karin M. Mammalian MAP kinase signalling cascades. Nature. 2001;410:37–40. doi: 10.1038/35065000. [DOI] [PubMed] [Google Scholar]
- Chiloeches A, Mason CS, Marais R. S338 phosphorylation of Raf-1 is independent of phosphatidylinositol 3-kinase and Pak3. Mol Cell Biol. 2001;21:2423–2434. doi: 10.1128/MCB.21.7.2423-2434.2001. [DOI] [PMC free article] [PubMed] [Google Scholar]
- Chou TC. Theoretical basis, experimental design, and computerized simulation of synergism and antagonism in drug combination studies. Pharmacol Rev. 2006;58:621–681. doi: 10.1124/pr.58.3.10. [DOI] [PubMed] [Google Scholar]
- Chylek LA, Harris LA, Tung C-S, Faeder JR, Lopez CF, Hlavacek WS. Rule-based modeling: a computational approach for studying biomolecular site dynamics in cell signaling systems. Wiley Interdisciplinary Reviews: Systems Biology and Medicine. 2014;6:13–36. doi: 10.1002/wsbm.1245. [DOI] [PMC free article] [PubMed] [Google Scholar]
- Chylek LA, Hu B, Blinov ML, Emonet T, Faeder JR, Goldstein B, Gutenkunst RN, Haugh JM, Lipniacki T, Posner RG, et al. Guidelines for visualizing and annotating rule-based models. Molecular bioSystems. 2011;7:2779–2795. doi: 10.1039/c1mb05077j. [DOI] [PMC free article] [PubMed] [Google Scholar]
- Costello JC, Heiser LM, Georgii E, Gonen M, Menden MP, Wang NJ, Bansal M, Ammad-ud-din M, Hintsanen P, Khan SA, et al. A community effort to assess and improve drug sensitivity prediction algorithms. Nat Biotech. 2014;32:1202–1212. doi: 10.1038/nbt.2877. [DOI] [PMC free article] [PubMed] [Google Scholar]
- Daily MD, Phillips GN, Jr, Cui Q. Many local motions cooperate to produce the adenylate kinase conformational transition. J Mol Biol. 2010;400:618–631. doi: 10.1016/j.jmb.2010.05.015. [DOI] [PMC free article] [PubMed] [Google Scholar]
- de Gramont A, Watson S, Ellis LM, Rodon J, Tabernero J, de Gramont A, Hamilton SR. Pragmatic issues in biomarker evaluation for targeted therapies in cancer. Nat Rev Clin Oncol. 2015;12:197–212. doi: 10.1038/nrclinonc.2014.202. [DOI] [PubMed] [Google Scholar]
- Dhillon AS, Kolch W. Untying the regulation of the Raf-1 kinase. Arch Biochem Biophys. 2002;404:3–9. doi: 10.1016/s0003-9861(02)00244-8. [DOI] [PubMed] [Google Scholar]
- Dhillon AS, Meikle S, Yazici Z, Eulitz M, Kolch W. Regulation of Raf-1 activation and signalling by dephosphorylation. EMBO J. 2002;21:64–71. doi: 10.1093/emboj/21.1.64. [DOI] [PMC free article] [PubMed] [Google Scholar]
- Diaz B, Barnard D, Filson A, MacDonald S, King A, Marshall M. Phosphorylation of Raf-1 serine 338-serine 339 is an essential regulatory event for Ras-dependent activation and biological signaling. Mol Cell Biol. 1997;17:4509–4516. doi: 10.1128/mcb.17.8.4509. [DOI] [PMC free article] [PubMed] [Google Scholar]
- Dougherty MK, Muller J, Ritt DA, Zhou M, Zhou XZ, Copeland TD, Conrads TP, Veenstra TD, Lu KP, Morrison DK. Regulation of Raf-1 by direct feedback phosphorylation. Mol Cell. 2005;17:215–224. doi: 10.1016/j.molcel.2004.11.055. [DOI] [PubMed] [Google Scholar]
- Ehrenberger T, Cantley LC, Yaffe MB. Computational prediction of protein-protein interactions. Methods Mol Biol. 2015;1278:57–75. doi: 10.1007/978-1-4939-2425-7_4. [DOI] [PMC free article] [PubMed] [Google Scholar]
- Fabbro D. 25 years of small molecular weight kinase inhibitors: potentials and limitations. Mol Pharmacol. 2015;87:766–775. doi: 10.1124/mol.114.095489. [DOI] [PubMed] [Google Scholar]
- Faeder JR, Blinov ML, Hlavacek WS. Rule-Based Modeling of Biochemical Systems with BioNetGen. In: I.V. Maly, editor. Systems Biology. Totowa, NJ: Humana Press; 2009. pp. 113–167. [DOI] [PubMed] [Google Scholar]
- Fernandez-Fuentes N, Madrid-Aliste CJ, Rai BK, Fajardo JE, Fiser A. M4T: a comparative protein structure modeling server. Nucleic Acids Research. 2007a;35:W363–W368. doi: 10.1093/nar/gkm341. [DOI] [PMC free article] [PubMed] [Google Scholar]
- Fernandez-Fuentes N, Rai BK, Madrid-Aliste CJ, Eduardo Fajardo J, Fiser A. Comparative protein structure modeling by combining multiple templates and optimizing sequence-to-structure alignments. Bioinformatics. 2007b;23:2558–2565. doi: 10.1093/bioinformatics/btm377. [DOI] [PubMed] [Google Scholar]
- Forbes SA, Beare D, Gunasekaran P, Leung K, Bindal N, Boutselakis H, Ding M, Bamford S, Cole C, Ward S, et al. COSMIC: exploring the world's knowledge of somatic mutations in human cancer. Nucleic Acids Res. 2015;43:D805–811. doi: 10.1093/nar/gku1075. [DOI] [PMC free article] [PubMed] [Google Scholar]
- Freeman AK, Ritt DA, Morrison DK. Effects of Raf dimerization and its inhibition on normal and disease-associated Raf signaling. Mol Cell. 2013;49:751–758. doi: 10.1016/j.molcel.2012.12.018. [DOI] [PMC free article] [PubMed] [Google Scholar]
- Garnett MJ, Rana S, Paterson H, Barford D, Marais R. Wild-type and mutant B-RAF activate C-RAF through distinct mechanisms involving heterodimerization. Mol Cell. 2005;20:963–969. doi: 10.1016/j.molcel.2005.10.022. [DOI] [PubMed] [Google Scholar]
- Gilmartin AG, Bleam MR, Groy A, Moss KG, Minthorn EA, Kulkarni SG, Rominger CM, Erskine S, Fisher KE, Yang J, et al. GSK1120212 (JTP-74057) is an inhibitor of MEK activity and activation with favorable pharmacokinetic properties for sustained in vivo pathway inhibition. Clin Cancer Res. 2011;17:989–1000. doi: 10.1158/1078-0432.CCR-10-2200. [DOI] [PubMed] [Google Scholar]
- Greco WR, Bravo G, Parsons JC. The search for synergy: a critical review from a response surface perspective. Pharmacol Rev. 1995;47:331–385. [PubMed] [Google Scholar]
- Grob JJ, Amonkar MM, Karaszewska B, Schachter J, Dummer R, Mackiewicz A, Stroyakovskiy D, Drucis K, Grange F, Chiarion-Sileni V, et al. Comparison of dabrafenib and trametinib combination therapy with vemurafenib monotherapy on health-related quality of life in patients with unresectable or metastatic cutaneous BRAF Val600-mutation-positive melanoma (COMBI-v): results of a phase 3, open-label, randomised trial. The Lancet Oncology. 2015;16:1389–1398. doi: 10.1016/S1470-2045(15)00087-X. [DOI] [PubMed] [Google Scholar]
- Hakulinen R, Puranen S. Probabilistic model to treat flexibility in molecular contacts. Molecular Physics. 2016:1–20. [Google Scholar]
- Harris LA, Hogg JS, Tapia J-J, Sekar JAP, Gupta S, Korsunsky I, Arora A, Barua D, Sheehan RP, Faeder JR. BioNetGen 2.2: advances in rule-based modeling. Bioinformatics. 2016;32:3366–3368. doi: 10.1093/bioinformatics/btw469. [DOI] [PMC free article] [PubMed] [Google Scholar]
- Hatzivassiliou G, Haling JR, Chen H, Song K, Price S, Heald R, Hewitt JF, Zak M, Peck A, Orr C, et al. Mechanism of MEK inhibition determines efficacy in mutant KRAS-versus BRAF-driven cancers. Nature. 2013;501:232–236. doi: 10.1038/nature12441. [DOI] [PubMed] [Google Scholar]
- Hatzivassiliou G, Song K, Yen I, Brandhuber BJ, Anderson DJ, Alvarado R, Ludlam MJ, Stokoe D, Gloor SL, Vigers G, et al. RAF inhibitors prime wild-type RAF to activate the MAPK pathway and enhance growth. Nature. 2010;464:431–435. doi: 10.1038/nature08833. [DOI] [PubMed] [Google Scholar]
- Heidorn SJ, Milagre C, Whittaker S, Nourry A, Niculescu-Duvas I, Dhomen N, Hussain J, Reis-Filho JS, Springer CJ, Pritchard C, et al. Kinase-dead BRAF and oncogenic RAS cooperate to drive tumor progression through CRAF. Cell. 2010;140:209–221. doi: 10.1016/j.cell.2009.12.040. [DOI] [PMC free article] [PubMed] [Google Scholar]
- Hindmarsh AC, Brown PN, Grant KE, Lee SL, Serban R, Shumaker DE, Woodward CS. SUNDIALS: Suite of nonlinear and differential/algebraic equation solvers. ACM Trans Math Softw. 2005;31:363–396. [Google Scholar]
- Holbeck SL, Camalier R, Crowell JA, Govindharajulu JP, Hollingshead M, Anderson LW, Polley E, Rubinstein L, Srivastava A, Wilsker D, et al. The National Cancer Institute ALMANAC: A Comprehensive Screening Resource for the Detection of Anticancer Drug Pairs with Enhanced Therapeutic Activity. Cancer research. 2017;77:3564–3576. doi: 10.1158/0008-5472.CAN-17-0489. [DOI] [PMC free article] [PubMed] [Google Scholar]
- Holderfield M, Deuker MM, McCormick F, McMahon M. Targeting RAF kinases for cancer therapy: BRAF-mutated melanoma and beyond. Nat Rev Cancer. 2014;14:455–467. doi: 10.1038/nrc3760. [DOI] [PMC free article] [PubMed] [Google Scholar]
- Hu J, Stites EC, Yu H, Germino EA, Meharena HS, Stork PJ, Kornev AP, Taylor SS, Shaw AS. Allosteric activation of functionally asymmetric RAF kinase dimers. Cell. 2013;154:1036–1046. doi: 10.1016/j.cell.2013.07.046. [DOI] [PMC free article] [PubMed] [Google Scholar]
- Jambrina PG, Bohuszewicz O, Buchete NV, Kolch W, Rosta E. Molecular mechanisms of asymmetric RAF dimer activation. Biochem Soc Trans. 2014;42:784–790. doi: 10.1042/BST20140025. [DOI] [PubMed] [Google Scholar]
- Jambrina PG, Rauch N, Pilkington R, Rybakova K, Nguyen LK, Kholodenko BN, Buchete NV, Kolch W, Rosta E. Phosphorylation of RAF Kinase Dimers Drives Conformational Changes that Facilitate Transactivation. Angew Chem Int Ed Engl. 2016;55:983–986. doi: 10.1002/anie.201509272. [DOI] [PMC free article] [PubMed] [Google Scholar]
- Jaumot M, Hancock JF. Protein phosphatases 1 and 2A promote Raf-1 activation by regulating 14-3-3 interactions. Oncogene. 2001;20:3949–3958. doi: 10.1038/sj.onc.1204526. [DOI] [PubMed] [Google Scholar]
- Johnson DB, Menzies AM, Zimmer L, Eroglu Z, Ye F, Zhao S, Rizos H, Sucker A, Scolyer RA, Gutzmer R, et al. Acquired BRAF inhibitor resistance: A multicenter meta-analysis of the spectrum and frequencies, clinical behaviour, and phenotypic associations of resistance mechanisms. European Journal of Cancer. 2015;51:2792–2799. doi: 10.1016/j.ejca.2015.08.022. [DOI] [PMC free article] [PubMed] [Google Scholar]
- Karoulia Z, Wu Y, Ahmed TA, Xin Q, Bollard J, Krepler C, Wu X, Zhang C, Bollag G, Herlyn M, et al. An Integrated Model of RAF Inhibitor Action Predicts Inhibitor Activity against Oncogenic BRAF Signaling. Cancer Cell. 2016;30:485–498. doi: 10.1016/j.ccell.2016.06.024. [DOI] [PMC free article] [PubMed] [Google Scholar]
- Keith CT, Borisy AA, Stockwell BR. Multicomponent therapeutics for networked systems. Nat Rev Drug Discov. 2005;4:71–78. doi: 10.1038/nrd1609. [DOI] [PubMed] [Google Scholar]
- Kholodenko B, Zilinskiene V, Borutaite V, Ivanoviene L, Toleikis A, Praskevicius A. The role of adenine nucleotide translocators in regulation of oxidative phosphorylation in heart mitochondria. FEBS Lett. 1987;223:247–250. doi: 10.1016/0014-5793(87)80298-3. [DOI] [PubMed] [Google Scholar]
- Kholodenko BN. Cell-signalling dynamics in time and space. Nat Rev Mol Cell Biol. 2006;7:165–176. doi: 10.1038/nrm1838. [DOI] [PMC free article] [PubMed] [Google Scholar]
- Kholodenko BN. Drug resistance resulting from kinase dimerization is rationalized by thermodynamic factors describing allosteric inhibitor effects. Cell Rep. 2015;12:1939–1949. doi: 10.1016/j.celrep.2015.08.014. [DOI] [PubMed] [Google Scholar]
- Kholodenko BN, Birtwistle MR. Four-dimensional dynamics of MAPK information processing systems. Wiley Interdiscip Rev Syst Biol Med. 2009;1:28–44. doi: 10.1002/wsbm.16. [DOI] [PMC free article] [PubMed] [Google Scholar]
- Kholodenko BN, Demin OV, Moehren G, Hoek JB. Quantification of short term signaling by the epidermal growth factor receptor. J Biol Chem. 1999;274:30169–30181. doi: 10.1074/jbc.274.42.30169. [DOI] [PubMed] [Google Scholar]
- Kholodenko BN, Demin OV, Westerhoff HV. Control Analysis of Periodic Phenomena in Biological Systems. The Journal of Physical Chemistry B. 1997;101:2070–2081. [Google Scholar]
- Kholodenko BN, Hoek JB, Westerhoff HV. Why cytoplasmic signalling proteins should be recruited to cell membranes. Trends Cell Biol. 2000;10:173–178. doi: 10.1016/s0962-8924(00)01741-4. [DOI] [PubMed] [Google Scholar]
- Kholodenko BN, Schuster S, Garcia J, Westerhoff HV, Cascante M. Control analysis of metabolic systems involving quasi-equilibrium reactions. Biochim Biophys Acta. 1998;1379:337–352. doi: 10.1016/s0304-4165(97)00114-1. [DOI] [PubMed] [Google Scholar]
- Kholodenko BN, Westerhoff HV. The macroworld versus the microworld of biochemical regulation and control. Trends in Biochemical Sciences. 1995;20:52–54. doi: 10.1016/s0968-0004(00)88955-0. [DOI] [PubMed] [Google Scholar]
- King AJ, Patrick DR, Batorsky RS, Ho ML, Do HT, Zhang SY, Kumar R, Rusnak DW, Takle AK, Wilson DM, et al. Demonstration of a Genetic Therapeutic Index for Tumors Expressing Oncogenic <em>BRAF</em> by the Kinase Inhibitor SB-590885. Cancer research. 2006;66:11100. doi: 10.1158/0008-5472.CAN-06-2554. [DOI] [PubMed] [Google Scholar]
- Kleiman LB, Maiwald T, Conzelmann H, Lauffenburger DA, Sorger PK. Rapid phospho-turnover by receptor tyrosine kinases impacts downstream signaling and drug binding. Mol Cell. 2011;43:723–737. doi: 10.1016/j.molcel.2011.07.014. [DOI] [PMC free article] [PubMed] [Google Scholar]
- Kolch W. Meaningful relationships: the regulation of the Ras/Raf/MEK/ERK pathway by protein interactions. Biochem J. 2000;351(Pt 2):289–305. [PMC free article] [PubMed] [Google Scholar]
- Lamson RE, Takahashi S, Winters MJ, Pryciak PM. Dual role for membrane localization in yeast MAP kinase cascade activation and its contribution to signaling fidelity. Curr Biol. 2006;16:618–623. doi: 10.1016/j.cub.2006.02.060. [DOI] [PubMed] [Google Scholar]
- Larkin J, Ascierto PA, Dreno B, Atkinson V, Liszkay G, Maio M, Mandala M, Demidov L, Stroyakovskiy D, Thomas L, et al. Combined vemurafenib and cobimetinib in BRAF-mutated melanoma. The New England journal of medicine. 2014;371:1867–1876. doi: 10.1056/NEJMoa1408868. [DOI] [PubMed] [Google Scholar]
- Lavoie H, Therrien M. Regulation of RAF protein kinases in ERK signalling. Nat Rev Mol Cell Biol. 2015;16:281–298. doi: 10.1038/nrm3979. [DOI] [PubMed] [Google Scholar]
- Leicht DT, Balan V, Kaplun A, Singh-Gupta V, Kaplun L, Dobson M, Tzivion G. Raf kinases: function, regulation and role in human cancer. Biochim Biophys Acta. 2007;1773:1196–1212. doi: 10.1016/j.bbamcr.2007.05.001. [DOI] [PMC free article] [PubMed] [Google Scholar]
- Lito P, Rosen N, Solit DB. Tumor adaptation and resistance to RAF inhibitors. Nat Med. 2013;19:1401–1409. doi: 10.1038/nm.3392. [DOI] [PubMed] [Google Scholar]
- MacKerell AD, Bashford D, Bellott M, Dunbrack RL, Evanseck JD, Field MJ, Fischer S, Gao J, Guo H, Ha S, et al. All-Atom Empirical Potential for Molecular Modeling and Dynamics Studies of Proteins. The Journal of Physical Chemistry B. 1998;102:3586–3616. doi: 10.1021/jp973084f. [DOI] [PubMed] [Google Scholar]
- Mackerell AD, Feig M, Brooks CL. Extending the treatment of backbone energetics in protein force fields: Limitations of gas-phase quantum mechanics in reproducing protein conformational distributions in molecular dynamics simulations. Journal of Computational Chemistry. 2004;25:1400–1415. doi: 10.1002/jcc.20065. [DOI] [PubMed] [Google Scholar]
- Markevich NI, Hoek JB, Kholodenko BN. Signaling switches and bistability arising from multisite phosphorylation in protein kinase cascades. J Cell Biol. 2004a;164:353–359. doi: 10.1083/jcb.200308060. [DOI] [PMC free article] [PubMed] [Google Scholar]
- Markevich NI, Moehren G, Demin O, Kiyatkin A, Hoek JB, Kholodenko BN. Signal processing at the Ras circuit: What shapes Ras activation patterns? IEE Systems Biology. 2004b;1:104–113. doi: 10.1049/sb:20045003. [DOI] [PubMed] [Google Scholar]
- Matallanas D, Birtwistle M, Romano D, Zebisch A, Rauch J, von Kriegsheim A, Kolch W. Raf family kinases: old dogs have learned new tricks. Genes Cancer. 2011;2:232–260. doi: 10.1177/1947601911407323. [DOI] [PMC free article] [PubMed] [Google Scholar]
- Montagut C, Sharma SV, Shioda T, McDermott U, Ulman M, Ulkus LE, Dias-Santagata D, Stubbs H, Lee DY, Singh A, et al. Elevated CRAF as a potential mechanism of acquired resistance to BRAF inhibition in melanoma. Cancer research. 2008;68:4853–4861. doi: 10.1158/0008-5472.CAN-07-6787. [DOI] [PMC free article] [PubMed] [Google Scholar]
- Nan X, Tamguney TM, Collisson EA, Lin LJ, Pitt C, Galeas J, Lewis S, Gray JW, McCormick F, Chu S. Ras-GTP dimers activate the Mitogen-Activated Protein Kinase (MAPK) pathway. Proc Natl Acad Sci U S A. 2015;112:7996–8001. doi: 10.1073/pnas.1509123112. [DOI] [PMC free article] [PubMed] [Google Scholar]
- Nazarian R, Shi H, Wang Q, Kong X, Koya RC, Lee H, Chen Z, Lee MK, Attar N, Sazegar H, et al. Melanomas acquire resistance to B-RAF(V600E) inhibition by RTK or N-RAS upregulation. Nature. 2010;468:973–977. doi: 10.1038/nature09626. [DOI] [PMC free article] [PubMed] [Google Scholar]
- Niyazi M, Niyazi I, Belka C. Counting colonies of clonogenic assays by using densitometric software. Radiation Oncology. 2007;2:4. doi: 10.1186/1748-717X-2-4. [DOI] [PMC free article] [PubMed] [Google Scholar]
- Nussinov R, Tsai C-J, Ma B. The Underappreciated Role of Allostery in the Cellular Network. Annual Review of Biophysics. 2013;42:169–189. doi: 10.1146/annurev-biophys-083012-130257. [DOI] [PMC free article] [PubMed] [Google Scholar]
- Obenauer JC, Cantley LC, Yaffe MB. Scansite 2.0: Proteome-wide prediction of cell signaling interactions using short sequence motifs. Nucleic Acids Res. 2003;31:3635–3641. doi: 10.1093/nar/gkg584. [DOI] [PMC free article] [PubMed] [Google Scholar]
- Okaniwa M, Hirose M, Arita T, Yabuki M, Nakamura A, Takagi T, Kawamoto T, Uchiyama N, Sumita A, Tsutsumi S, et al. Discovery of a selective kinase inhibitor (TAK-632) targeting pan-RAF inhibition: design, synthesis, and biological evaluation of C-7-substituted 1,3-benzothiazole derivatives. J Med Chem. 2013;56:6478–6494. doi: 10.1021/jm400778d. [DOI] [PubMed] [Google Scholar]
- Park Jin H, Liu Y, Lemmon Mark A, Radhakrishnan R. Erlotinib binds both inactive and active conformations of the EGFR tyrosine kinase domain. Biochemical Journal. 2012;448:417. doi: 10.1042/BJ20121513. [DOI] [PMC free article] [PubMed] [Google Scholar]
- Pawson T, Nash P. Assembly of cell regulatory systems through protein interaction domains. Science. 2003;300:445–452. doi: 10.1126/science.1083653. [DOI] [PubMed] [Google Scholar]
- Poulikakos PI, Persaud Y, Janakiraman M, Kong X, Ng C, Moriceau G, Shi H, Atefi M, Titz B, Gabay MT, et al. RAF inhibitor resistance is mediated by dimerization of aberrantly spliced BRAF(V600E) Nature. 2011;480:387–390. doi: 10.1038/nature10662. [DOI] [PMC free article] [PubMed] [Google Scholar]
- Poulikakos PI, Zhang C, Bollag G, Shokat KM, Rosen N. RAF inhibitors transactivate RAF dimers and ERK signalling in cells with wild-type BRAF. Nature. 2010;464:427–430. doi: 10.1038/nature08902. [DOI] [PMC free article] [PubMed] [Google Scholar]
- Poussin C, Mathis C, Alexopoulos LG, Messinis DE, Dulize RHJ, Belcastro V, Melas IN, Sakellaropoulos T, Rhrissorrakrai K, Bilal E, et al. The species translation challenge—A systems biology perspective on human and rat bronchial epithelial cells. 2014;1:140009. doi: 10.1038/sdata.2014.9. [DOI] [PMC free article] [PubMed] [Google Scholar]
- Pozdeyev N, Yoo M, Mackie R, Schweppe RE, Tan AC, Haugen BR. Integrating heterogeneous drug sensitivity data from cancer pharmacogenomic studies. Oncotarget. 2016;7:51619–51625. doi: 10.18632/oncotarget.10010. [DOI] [PMC free article] [PubMed] [Google Scholar]
- Prasad V. Perspective: The precision-oncology illusion. Nature. 2016;537:S63–S63. doi: 10.1038/537S63a. [DOI] [PubMed] [Google Scholar]
- Prior IA, Lewis PD, Mattos C. A comprehensive survey of Ras mutations in cancer. Cancer research. 2012;72:2457–2467. doi: 10.1158/0008-5472.CAN-11-2612. [DOI] [PMC free article] [PubMed] [Google Scholar]
- Pulido R, Zuniga A, Ullrich A. PTP-SL and STEP protein tyrosine phosphatases regulate the activation of the extracellular signal-regulated kinases ERK1 and ERK2 by association through a kinase interaction motif. EMBO J. 1998;17:7337–7350. doi: 10.1093/emboj/17.24.7337. [DOI] [PMC free article] [PubMed] [Google Scholar]
- Qin J, Xie P, Ventocilla C, Zhou G, Vultur A, Chen Q, Liu Q, Herlyn M, Winkler J, Marmorstein R. Identification of a Novel Family of BRAFV600E Inhibitors. Journal of Medicinal Chemistry. 2012;55:5220–5230. doi: 10.1021/jm3004416. [DOI] [PMC free article] [PubMed] [Google Scholar]
- Rahman MA, Salajegheh A, Smith RA, Lam AK. BRAF inhibitors: From the laboratory to clinical trials. Crit Rev Oncol Hematol. 2014;90:220–232. doi: 10.1016/j.critrevonc.2013.12.008. [DOI] [PubMed] [Google Scholar]
- Rajakulendran T, Sahmi M, Lefrancois M, Sicheri F, Therrien M. A dimerization-dependent mechanism drives RAF catalytic activation. Nature. 2009;461:542–545. doi: 10.1038/nature08314. [DOI] [PubMed] [Google Scholar]
- Rauch N, Rukhlenko OS, Kolch W, Kholodenko BN. MAPK kinase signalling dynamics regulate cell fate decisions and drug resistance. Current Opinion in Structural Biology. 2016;41:151–158. doi: 10.1016/j.sbi.2016.07.019. [DOI] [PubMed] [Google Scholar]
- Ritt DA, Monson DM, Specht SI, Morrison DK. Impact of feedback phosphorylation and Raf heterodimerization on normal and mutant B-Raf signaling. Mol Cell Biol. 2010;30:806–819. doi: 10.1128/MCB.00569-09. [DOI] [PMC free article] [PubMed] [Google Scholar]
- Romano D, Nguyen LK, Matallanas D, Halasz M, Doherty C, Kholodenko BN, Kolch W. Protein interaction switches coordinate Raf-1 and MST2/Hippo signalling. Nat Cell Biol. 2014;16:673–684. doi: 10.1038/ncb2986. [DOI] [PubMed] [Google Scholar]
- Roskoski R., Jr RAF protein-serine/threonine kinases: structure and regulation. Biochem Biophys Res Commun. 2010;399:313–317. doi: 10.1016/j.bbrc.2010.07.092. [DOI] [PubMed] [Google Scholar]
- Roskoski R., Jr Classification of small molecule protein kinase inhibitors based upon the structures of their drug-enzyme complexes. Pharmacol Res. 2016;103:26–48. doi: 10.1016/j.phrs.2015.10.021. [DOI] [PubMed] [Google Scholar]
- Rubinstein BY, Mattingly HH, Berezhkovskii AM, Shvartsman SY. Long-term dynamics of multisite phosphorylation. Molecular Biology of the Cell. 2016;27:2331–2340. doi: 10.1091/mbc.E16-03-0137. [DOI] [PMC free article] [PubMed] [Google Scholar]
- Rushworth LK, Hindley AD, O'Neill E, Kolch W. Regulation and role of Raf-1/B-Raf heterodimerization. Mol Cell Biol. 2006;26:2262–2272. doi: 10.1128/MCB.26.6.2262-2272.2006. [DOI] [PMC free article] [PubMed] [Google Scholar]
- Ryckaert J-P, Ciccotti G, Berendsen HJC. Numerical integration of the cartesian equations of motion of a system with constraints: molecular dynamics of n-alkanes. Journal of Computational Physics. 1977;23:327–341. [Google Scholar]
- Rykunov D, Steinberger E, Madrid-Aliste CJ, Fiser A. Improved scoring function for comparative modeling using the M4T method. Journal of Structural and Functional Genomics. 2009;10:95–99. doi: 10.1007/s10969-008-9044-9. [DOI] [PMC free article] [PubMed] [Google Scholar]
- Saez-Rodriguez J, MacNamara A, Cook S. Modeling Signaling Networks to Advance New Cancer Therapies. Annu Rev Biomed Eng. 2015;17:143–163. doi: 10.1146/annurev-bioeng-071813-104927. [DOI] [PubMed] [Google Scholar]
- Sanchez-Laorden B, Viros A, Girotti MR, Pedersen M, Saturno G, Zambon A, Niculescu-Duvaz D, Turajlic S, Hayes A, Gore M, et al. BRAF Inhibitors Induce Metastasis in RAS Mutant or Inhibitor-Resistant Melanoma Cells by Reactivating MEK and ERK Signaling. Science Signaling. 2014;7:ra30. doi: 10.1126/scisignal.2004815. [DOI] [PubMed] [Google Scholar]
- Shao Q, Xu Z, Wang J, Shi J, Zhu W. Energetics and structural characterization of the "DFG-flip" conformational transition of B-RAF kinase: a SITS molecular dynamics study. Phys Chem Chem Phys. 2017;19:1257–1267. doi: 10.1039/c6cp06624k. [DOI] [PubMed] [Google Scholar]
- Shi H, Moriceau G, Kong X, Lee MK, Lee H, Koya RC, Ng C, Chodon T, Scolyer RA, Dahlman KB, et al. Melanoma whole-exome sequencing identifies (V600E)B-RAF amplification-mediated acquired B-RAF inhibitor resistance. Nat Commun. 2012;3:724. doi: 10.1038/ncomms1727. [DOI] [PMC free article] [PubMed] [Google Scholar]
- Stephen Andrew G, Esposito D, Bagni Rachel K, McCormick F. Dragging Ras Back in the Ring. Cancer Cell. 2014;25:272–281. doi: 10.1016/j.ccr.2014.02.017. [DOI] [PubMed] [Google Scholar]
- Straussman R, Morikawa T, Shee K, Barzily-Rokni M, Qian ZR, Du J, Davis A, Mongare MM, Gould J, Frederick DT, et al. Tumour micro-environment elicits innate resistance to RAF inhibitors through HGF secretion. Nature. 2012;487:500–504. doi: 10.1038/nature11183. [DOI] [PMC free article] [PubMed] [Google Scholar]
- Sturm OE, Orton R, Grindlay J, Birtwistle M, Vyshemirsky V, Gilbert D, Calder M, Pitt A, Kholodenko B, Kolch W. The mammalian MAPK/ERK pathway exhibits properties of a negative feedback amplifier. Sci Signal. 2010;3:ra90. doi: 10.1126/scisignal.2001212. [DOI] [PubMed] [Google Scholar]
- Varga A, Ehrenreiter K, Aschenbrenner B, Kocieniewski P, Kochanczyk M, Lipniacki T, Baccarini M. RAF1/BRAF dimerization integrates the signal from RAS to ERK and ROKalpha. Sci Signal. 2017;10:eaai8482. doi: 10.1126/scisignal.aai8482. [DOI] [PubMed] [Google Scholar]
- Wan PTC, Garnett MJ, Roe SM, Lee S, Niculescu-Duvaz D, Good VM, Project CG, Jones CM, Marshall CJ, Springer CJ, et al. Mechanism of Activation of the RAF-ERK Signaling Pathway by Oncogenic Mutations of B-RAF. Cell. 2004;116:855–867. doi: 10.1016/s0092-8674(04)00215-6. [DOI] [PubMed] [Google Scholar]
- Weber CK, Slupsky JR, Kalmes HA, Rapp UR. Active Ras Induces Heterodimerization of cRaf and BRaf. Cancer research. 2001;61:3595. [PubMed] [Google Scholar]
- Weinstein JN, Collisson EA, Mills GB, Shaw KR, Ozenberger BA, Ellrott K, Shmulevich I, Sander C, Stuart JM. The Cancer Genome Atlas Pan-Cancer analysis project. Nat Genet. 2013;45:1113–1120. doi: 10.1038/ng.2764. [DOI] [PMC free article] [PubMed] [Google Scholar]
- Wenglowsky S, Ren L, Ahrendt KA, Laird ER, Aliagas I, Alicke B, Buckmelter AJ, Choo EF, Dinkel V, Feng B, et al. Pyrazolopyridine Inhibitors of B-RafV600E. Part 1: The Development of Selective, Orally Bioavailable, and Efficacious Inhibitors. ACS Medicinal Chemistry Letters. 2011;2:342–347. doi: 10.1021/ml200025q. [DOI] [PMC free article] [PubMed] [Google Scholar]
- Wilhelm SM, Carter C, Tang L, Wilkie D, McNabola A, Rong H, Chen C, Zhang X, Vincent P, McHugh M, et al. BAY 43-9006 Exhibits Broad Spectrum Oral Antitumor Activity and Targets the RAF/MEK/ERK Pathway and Receptor Tyrosine Kinases Involved in Tumor Progression and Angiogenesis. Cancer research. 2004;64:7099. doi: 10.1158/0008-5472.CAN-04-1443. [DOI] [PubMed] [Google Scholar]
- Yadav B, Pemovska T, Szwajda A, Kulesskiy E, Kontro M, Karjalainen R, Majumder MM, Malani D, Murumagi A, Knowles J, et al. Quantitative scoring of differential drug sensitivity for individually optimized anticancer therapies. Sci Rep. 2014;4:5193. doi: 10.1038/srep05193. [DOI] [PMC free article] [PubMed] [Google Scholar]
- Yaktapour N, Meiss F, Mastroianni J, Zenz T, Andrlova H, Mathew NR, Claus R, Hutter B, Frohling S, Brors B, et al. BRAF inhibitor-associated ERK activation drives development of chronic lymphocytic leukemia. J Clin Invest. 2014;124:5074–5084. doi: 10.1172/JCI76539. [DOI] [PMC free article] [PubMed] [Google Scholar]
- Yao Z, Torres NM, Tao A, Gao Y, Luo L, Li Q, de Stanchina E, Abdel-Wahab O, Solit DB, Poulikakos PI, et al. BRAF Mutants Evade ERK-Dependent Feedback by Different Mechanisms that Determine Their Sensitivity to Pharmacologic Inhibition. Cancer Cell. 2015;28:370–383. doi: 10.1016/j.ccell.2015.08.001. [DOI] [PMC free article] [PubMed] [Google Scholar]
- Yeh PJ, Hegreness MJ, Aiden AP, Kishony R. Drug interactions and the evolution of antibiotic resistance. Nat Rev Microbiol. 2009;7:460–466. doi: 10.1038/nrmicro2133. [DOI] [PMC free article] [PubMed] [Google Scholar]
- Zehir A, Benayed R, Shah RH, Syed A, Middha S, Kim HR, Srinivasan P, Gao J, Chakravarty D, Devlin SM, et al. Mutational landscape of metastatic cancer revealed from prospective clinical sequencing of 10,000 patients. Nat Med. 2017;23:703–713. doi: 10.1038/nm.4333. [DOI] [PMC free article] [PubMed] [Google Scholar]
- Zhang C, Spevak W, Zhang Y, Burton EA, Ma Y, Habets G, Zhang J, Lin J, Ewing T, Matusow B, et al. RAF inhibitors that evade paradoxical MAPK pathway activation. Nature. 2015;526:583–586. doi: 10.1038/nature14982. [DOI] [PubMed] [Google Scholar]
- Zhao Y, Zhang ZY. The mechanism of dephosphorylation of extracellular signal-regulated kinase 2 by mitogen-activated protein kinase phosphatase 3. J Biol Chem. 2001;276:32382–32391. doi: 10.1074/jbc.M103369200. [DOI] [PubMed] [Google Scholar]
Associated Data
This section collects any data citations, data availability statements, or supplementary materials included in this article.
Supplementary Materials
Data S1 related to Figure 2. Spreadsheet for calculation of apparent dissociation constants.
Data S2 related to Figure 2. Model code in SBML format.
Data S3 related to Figure 2. Model code including BRAF splice variants in SBML format.
Table S1 related to Figures 1 and 2. Summary of the structural properties of RAF inhibitors.
Table S2 related to Figure 2. Estimated ranges for the coefficients b, c and γ.
Table S3 related to Figure 2. Reactions and relationships between equilibrium dissociation constants for a model of BRAF-CRAF heterodimers and two allosteric inhibitors.
Table S4 related to Figure 2. Relative activities of different RAF kinase forms.
Table S6 related to Figure 5. Model-predicted ratios of IC50 levels to the Kd of binding to BRAFV600E monomers for different inhibitors and mutational conditions.
Table S5 related to Figure 2. Parameters of the rule-based model of RAS-RAF-MEK-ERKcascade.