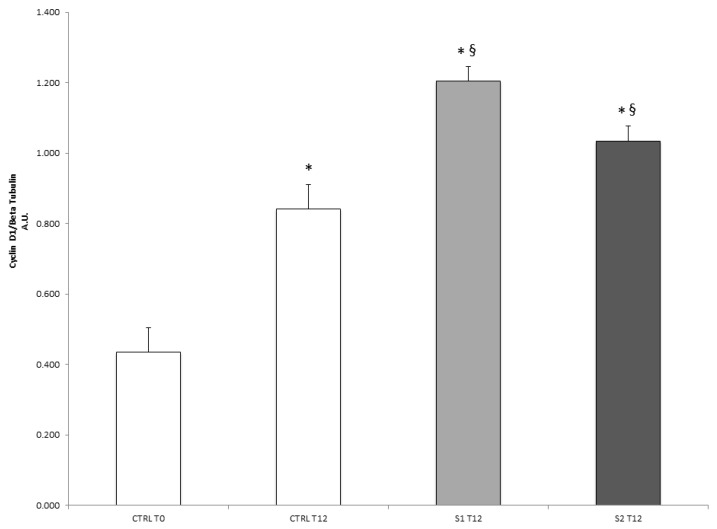
Figure 4.
Effect of S1 and S2 on the proliferative marker cyclin D1 in HCEpiC cells. The graph shows the cyclin D1 protein levels in HCEpiC cells treated with S1 or S2 for 12 h. Data are means ± SD of triplicate. * indicates statistically significant difference from untreated control at 0 h; § indicates statistically significant difference from untreated control at 12 h (one-way ANOVA, p < 0.05).

