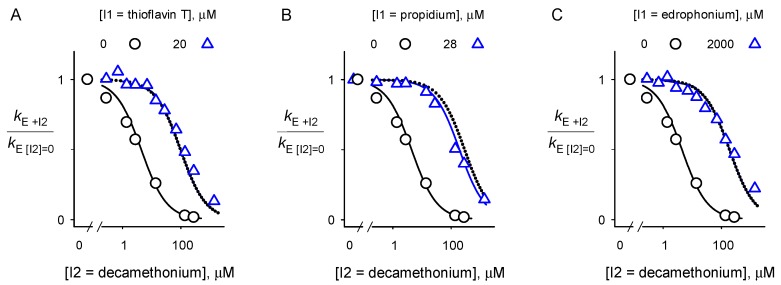
Figure 6.
Analyses of relative second order rate constants for substrate hydrolysis by BChE with decamethonium (I2) in the presence (triangle) or absence (circle) of another inhibitor (I1) (A–C). Values of kE were obtained with Equation (1). K2 for decamethonium was fitted to Equation (5) with [I1] = 0 (solid curves on left of each panel). K1 for the other inhibitors was obtained in similar fashion from Equation (5) (Table 1). K12 for decamethonium was fitted to Equation (5) with the [I1] indicated in each panel (solid curves on right of each panel). All experiments were performed in triplicate and the values were averaged. Dotted lines represent the theoretical plot that denotes complete competition between I1 and I2 (i.e., 1/K12 fixed at 0).

