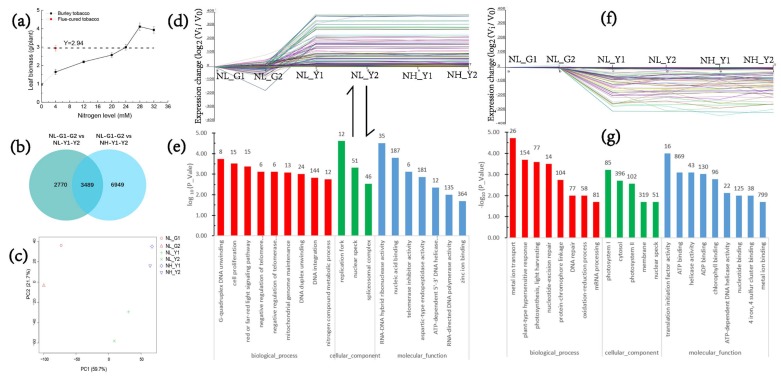
Figure 1.
Transcriptome analysis strategies and GO enrichment of target DEGs. (a) Leaf biomass in burley tobacco and flue-cured tobacco; (b) Venn diagram of DEGs of flue-cured tobacco (NL_G1_G2) vs burley tobacco (NL_Y1_Y2) at the same nitrogen application level and flue-cured tobacco (NL_G1_G2) vs. burley tobacco (NH_Y1_Y2) at the same leaf biomass accumulation condition; (c) PCA analysis of treatments; (d) Genes represented in Profile 73; (e) GO enrichment in Profile 73; (f) Genes represented in Profile 38; (g) GO enrichment in Profile 38. NL_G1: low nitrogen level, HD; NL_G2: low nitrogen level, Z100; NL_Y1: low nitrogen level, TN90; NL_Y2: low nitrogen level, TN86; NH_Y1: high nitrogen level, TN90; NH_Y2: high nitrogen level, TN86.

