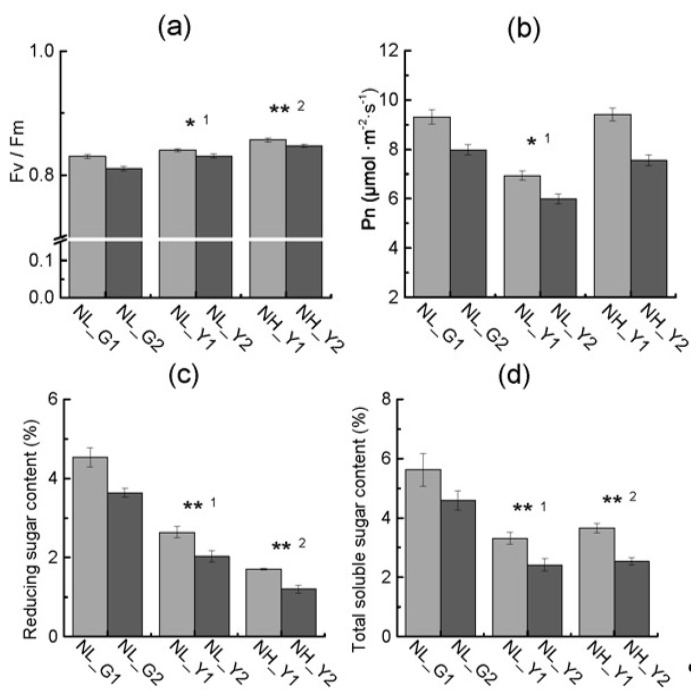
Figure 5.
Differences in Fv/Fm (a), Pn (b), reducing sugar content (c), total soluble sugar content (d) in flue-cured tobacco and burley tobacco at the same nitrogen level and same leaf biomass accumulation condition. Fv/Fm: Maximum quantum yield of PS II photochemistry; Pn: Photosynthetic rate. NL_G1: low nitrogen level, HD; NL_G2: low nitrogen level, Z100; NL_Y1: low nitrogen level, TN90; NL_Y2: low nitrogen level, TN86; NH_Y1: high nitrogen level, TN90; NH_Y2: high nitrogen level, TN86. Error bars of chlorophyll a fluorescence and photosynthesis rate indicate standard error of the means (N = 20, “N” means the number of individuals), and error bars of reducing sugar content and total soluble sugar content indicate standard error of the means (n = 3, three biological replicates). Symbols ** 1 and * 1 indicate that the significant differences between flue-cured tobacco and burley tobacco at the same nitrogen application are at 0.01 and 0.05, respectively. Symbols ** 2 indicate that the significant differences between flue-cured tobacco and burley tobacco at the same leaf biomass accumulation condition are at 0.01, respectively.

