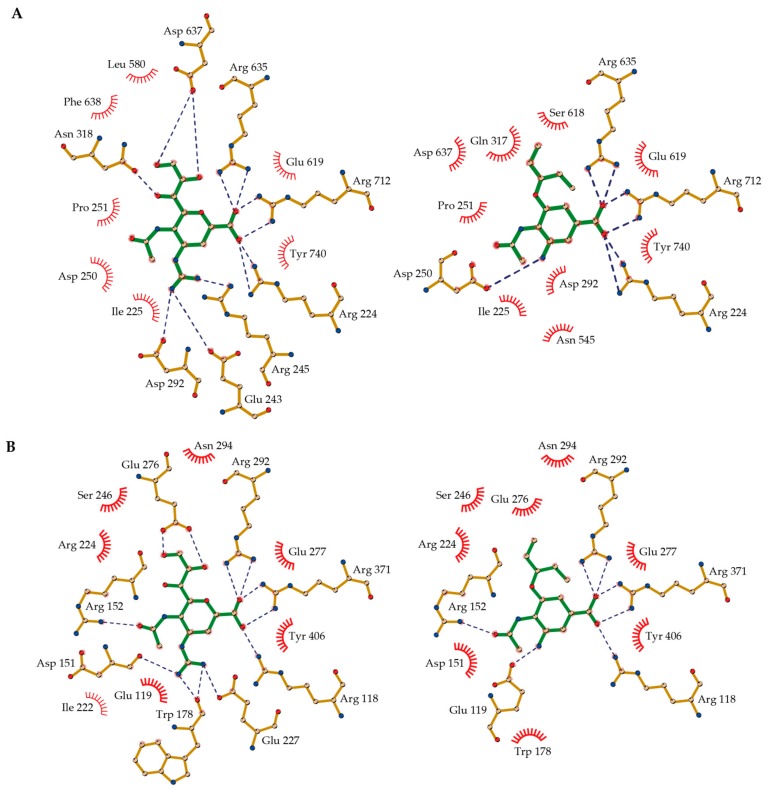
Figure 5.
Binding modes of zanamivir (left, green stick model) and oseltamivir carboxylate (right, green stick model) in the active site of (A) VCNA, determined in this study (Protein Data Bank (PDB) codes 6EKU and 6EKS); and (B) H1N1-NA (PDB codes 3TI5 and 3TI6) [19]. Hydrogen bonds are depicted with dashed blue lines and hydrophobic interactions are shown as red arcs. The figures were prepared with LigPlot+ [36].

