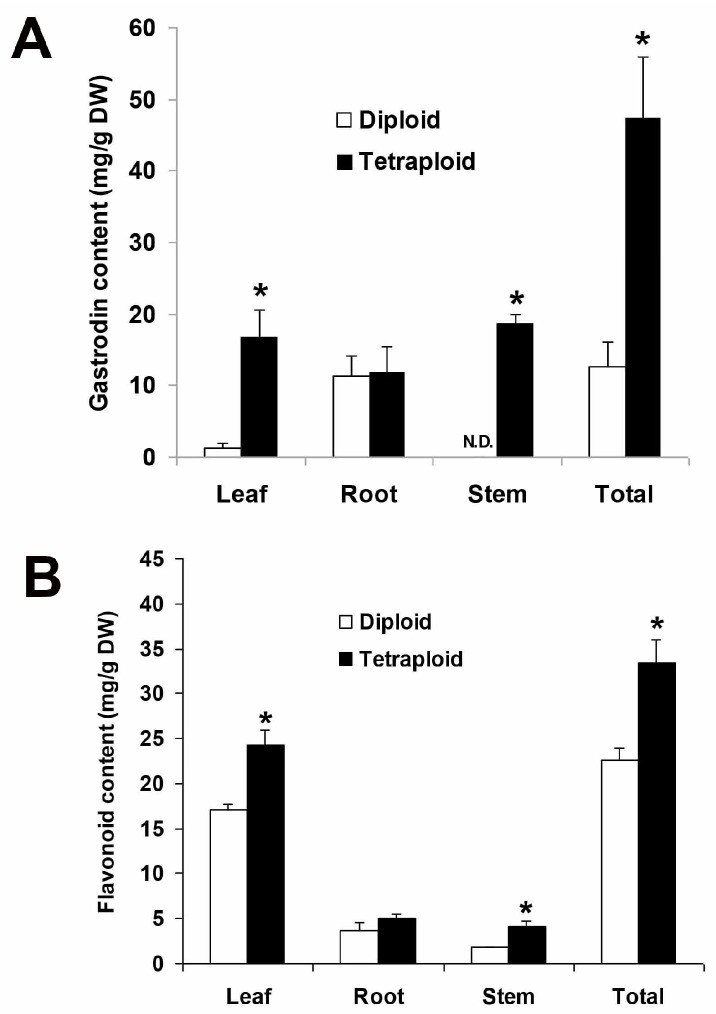
Figure 6.
(A) The gastrodin content in the diploid and the tetraploid of Anoectochilus formosanus; (B) The flavonoid content in the diploid and the tetraploid of Anoectochilus formosanus. Data are expressed as mean ± SD. * Indicates a significantly difference between the diploid and the tetraploid in leaf, root, stem, and total (the sum of leaf, root, and stem), respectively, according to Duncan’s multiple range test (P ≤ 0.05).

