Abstract
It is well known that small molecule colloidal aggregation is a leading cause of false positives in early drug discovery. Colloid-formers are diverse and well represented among corporate and academic screening decks, and even among approved drugs. Less appreciated is how colloid formation by drug-like compounds fits into the wider understanding of colloid physical chemistry. Here we introduce the impact that colloidal aggregation has had on early drug discovery, and then turn to the physical and thermodynamic driving forces for small molecule colloidal aggregation, including the particulate nature of the colloids, their critical aggregation concentration-governed formation, their mechanism of protein adsorption and subsequent inhibition, and their sensitivity to detergent. We describe methods that have been used extensively to both identify aggregate-formers and to study and control their physical chemistry. While colloidal aggregation is widely recognized as a problem in early drug discovery, we highlight the opportunities for exploiting this phenomenon in biological milieus and for drug formulation.
Keywords: Colloidal aggregates, self-assembly, high-throughput screening, protein adsorption
Graphical abstract
1 Introduction
Drug discovery often begins with screening libraries of over one million molecules to find early compounds that may become leads to drug candidates [1, 2]. While they remain the most widely used strategy in pharmaceutical research to discover new disease-related targets, these high-throughput screening (HTS) campaigns are dominated by false-positive “hits” [3-5]. Often, far more time and resources are spent distinguishing between true and false positives, and prioritizing well-behaved hits for progression, than was spent developing and executing the HTS in the first place.
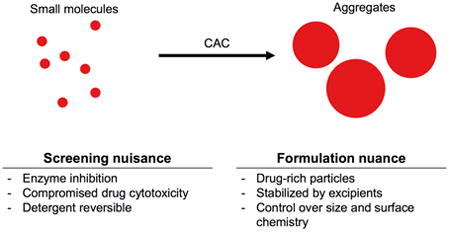
Among the most common mechanisms for false-positive hits in HTS is the colloidal aggregation of small molecules, first discovered 15 years ago [3] and now widely accepted [6]. Subsequent mechanistic work demonstrated that aggregation occurs via phase separation and particle formation when the small molecules are present above a compound-specific critical aggregation concentration (CAC) [7]. The resulting colloidal aggregates non-specifically bind proteins to their surface causing local unfolding events, which, in the case of enzymes, result in loss of catalytic activity [7, 8]. Compound aggregation alone explained the flat structure-activity relationships and high sensitivity to assay conditions that had been a common feature of the HTS false positives [2, 5]. A third widespread feature of these pathological hits, their steep Hill coefficients in concentration-response curves, was explained by the aggregates having binding affinities for their target proteins that were substantially higher than the concentration of the targets in the assays [5].
The formation of colloidal particles in biochemical buffers and their interactions with biological molecules have had many implications for drug discovery, formulation and activity. While many of these properties have rendered colloidal aggregates to be considered as nuisance artifacts, they can also be exploited to turn colloidal aggregation into an advantage. The aim of this review is to inform the reader of these unique properties of colloidal aggregates, their implications in biochemical assay and drug development, and current efforts to exploit these properties.
2 Properties of colloidal aggregates
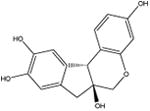
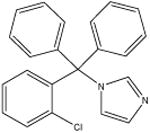
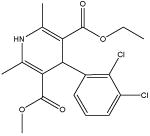
Many organic small molecules spontaneously self-assemble in aqueous media into nano-sized colloidal aggregates without chemical manipulation. These molecules cover a range of chemical properties and structures, and include compounds from screening libraries, for which the phenomenon was first characterized, dyes, and even clinically approved drugs [3, 9, 10] (Table 1). In the following sections, we highlight properties that make colloidal aggregates unique as nanostructures and quite different from other self-assembled drug nanoparticles, which have been reviewed elsewhere [11-13].
Table 1.
Several aggregate-forming small molecules. Critical aggregation concentrations for these compounds are provided for the aqueous conditions listed. Error (standard deviation) is included when known.
| Compound (Indication) | Structure | MW (g/mol) | CAC (μM) | Aqueous Conditions |
|---|---|---|---|---|
| Brazilin (natural product) [14] |
|
286.3 | 57 ± 7 | 50 mM potassium phosphate, pH 7 |
| Cinnarizine (anti-histamine) [7] |

|
368.5 | 7 ± 3 | 50 mM potassium phosphate, pH 7 |
| Clotrimazole (anti-fungal) [15] |
|
344.8 | 15.0 ± 0.3 | 100 mM potassium phosphate, pH 10 |
| Crizotinib (anti-neoplastic, non-small cell lung cancer) [16] |
|
450.3 | 19.3 | 50 mM potassium phosphate, pH 7 |
| Curcumin (natural product) [14] |
|
368.4 | 17 ± 0.44 | 50 mM potassium phosphate, pH 7 |
| Danazol (synthetic steroid) [17] |

|
337.5 | 39 | 10 mM phosphate buffer, pH 6.8 |
| Emodin (natural product) [14] |

|
270.2 | 28 ± 2 | 50 mM potassium phosphate, pH 7 |
| Evacetrapib (cholesterylester transfer protein inhibitor) [18] |

|
638.7 | 0.8 | 50 mM sodium phosphate, pH 6.8 |
| Felodipine (calcium channel blocker) [15] |
|
384.3 | 26 ± 1 | 50 mM sodium phosphate, pH 6.8 |
| Fulvestrant (anti-neoplastic, breast cancer) [16] |
|
606.8 | 0.5 | 50 mM potassium phosphate, pH 7 |
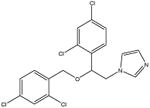
| Miconazole (anti-fungal) [7] |
|
416.1 | 3 ± 2 | 50 mM potassium phosphate, pH 7 |
| Nicardipine (calcium channel blocker) [7] |

|
479.5 | 32 ± 3 | 50 mM potassium phosphate, pH 7 |
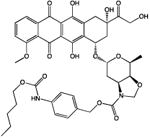
| Pentyl-PABC doxazolidine (investigational anti-neoplastic) [19] |
|
818.8 | 14 | Phosphate buffered saline, pH 7.4 |
| Ritonavir (anti-retroviral) [15] |

|
720.9 | 26.1 ± 0.1 | 50 mM sodium phosphate, pH 6.8 |
| Sorafenib (anti-neoplastic, renal cell carcinoma) [16] |
|
464.8 | 3.5 | 50 mM potassium phosphate, pH 7 |
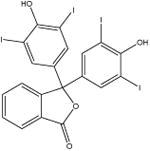
| Tetraiodophenolphthalein (indicator) [7] |
|
821.9 | 10 ± 2 | 50 mM potassium phosphate, pH 7 |
| Trypan blue (dye) [20] |

|
872.9 | 30 | 50 mM potassium phosphate, pH 7 |
| Vemurafenib (anti-neoplastic, melanoma) [16] |

|
489.9 | 1.2 | 50 mM potassium phosphate, pH 7 |
2.1 Colloidal particle formation
The formation of stable, amorphous, nano-sized particles is a characteristic property of colloidal aggregation [3]. These colloids have diameters typically between 50 and 1000 nm and form through spontaneous phase separation on addition to aqueous media from, often, an organic stock solution such as DMSO (Figure 1A). Aggregation is concentration dependent; at low concentrations, the compound is fully solubilized, but as the concentration increases, spontaneous self-assembly occurs at a critical concentration [7]. This critical aggregation concentration (CAC, Figure 1B) appears to correspond to the amorphous solubility of the compound [15]. Notably, this concentration is higher than the crystal solubility of the compound, at least in those cases where the two have been carefully compared. The CAC is analogous to the critical micelle concentration for surfactants; like micelles, when diluted below the CAC the aggregates will spontaneously disassemble and return to a monomeric state [3, 21]. At least transiently, the concentration of free molecules that remain in solution is defined by the CAC, even once aggregates have formed, as is the case with micelles. (Figure 1C) [7]. This can be shown by centrifugation, for instance, where the colloidal aggregates may be spun down and separated from the soluble molecule, with the concentration in the supernatant remaining constant at the CAC.
Figure 1.

(A) Electron micrograph of colloidal aggregates of tetraiodophenolphthalein (TIPT) at 100 μM (scale bar represents 200 nm). Reprinted with permission from Ref. [22] Copyright 2003 American Chemical Society. (B) Critical aggregation concentration measurement of nicardipine. (C) Measurement of nicardipine concentration in colloidal aggregates (pellet) and monomeric free drug (supernatant). Reprinted with permission from Ref. [7]. Copyright 2008 American Chemical Society.
Taylor et al. demonstrated that colloidal aggregates are liquid-liquid phase-separated solutions [15], unlike nanocrystals where the drug molecules are tightly packed into an organized lattice. The amorphous nature of colloidal aggregates allows them to interact with hydrophobic dyes akin to micelles, and unlike nanocrystals. Fluorescent probes, such as pyrene, change their emission characteristics depending on the polarity of their environment [23, 24]. Such dyes preferentially associate with the hydrophobic core of micelles and allow measurement of the CMC [23-25]. Similarly, these dyes associate with hydrophobic colloids at concentrations that correlate with the CAC [15, 26-29]. The ability of fluorophores to incorporate into colloidal aggregates supports their liquid nature, as dyes are unable to penetrate crystal lattices.
While the actual molecular structure of colloidal aggregates is poorly understood, some studies have provided a preliminary glimpse into their structure. By small-angle X-ray scattering, the structure of the colloidal aggregates fit the expected pair distance distribution function for a well-packed, rather than a hollow, sphere [30]. This result is supported by the ratio of the radius of gyration to the hydrodynamic radius from light scattering [30]. Frenkel et al. used a molecular dynamics approach to explore the effect of pH (i.e. percent protonation of the compound) on the formation and structure of rilpivirine aggregates [31]. Additional studies are needed to fully understand the molecular organization (if any) of colloidal aggregates.
2.2 Aggregation thermodynamics
The self-assembly of molecules into colloidal aggregates is driven by their relative inability to form energetically favorable interactions with water [32]. Practically, these aggregates form when water is added to a hydrophobic aggregator dispersed in a water-miscible organic solvent (e.g. DMSO) [7, 32], or blended in a water-soluble polymer matrix [15, 33, 34]. As shown in Figure 2, the aggregator is no longer soluble in the continuous phase after addition of water. In the unstable area, the mixture spontaneously separates to generate a liquid or glassy colloidal phase along with a small molecule-depleted aqueous phase. The exact mechanism by which colloidal aggregates form has not been studied for all aggregators, or under all conditions. Two mechanisms for colloid formation, during which the organic and aqueous phases are mixed together, have been proposed [32, 34, 35]. In the first mechanism, individual aggregator molecules are carried into the bulk solution where they associate to form amorphous colloidal aggregates when the CAC is reached. In the second mechanism, aggregation occurs as water penetrates the organic phase, followed by the release of intact colloids into the bulk solution. Isotope scrambling studies have supported the first mechanism for the dissolution of polymer-dispersed aggregator with 10% and 20% aggregator loadings [35]; however, systems with higher loading behave in a manner more consistent with the second mechanism, where aggregation occurs within the polymer matrix upon exposure to water and colloids are released as the matrix dissolves [34]. In reality, these two mechanisms are extremes of a single continuum; phase separation will occur whenever local supersaturation is achieved during mass exchange between organic and aqueous phases. Since phase separation will occur when the local composition enters the unstable region, the aggregator concentration in the organic phase (point 1 on phase diagram of Figure 2) and the solubility parameters of the aggregator and organic matrix (which influence the shape of the unstable and metastable regions) likely dictate where phase separation will occur [34]. When the aggregator concentration is low, phase separation occurs only after a relatively large amount of water has penetrated the organic phase as aggregator-in-polymer formulations dissolve, resulting in phase separation that more closely follows the first mechanism [35]. Conversely, when the aggregator concentration is high, phase separation occurs after only a small amount of water diffuses into the organic phase, and the second mechanism is more closely followed [34].
Figure 2.
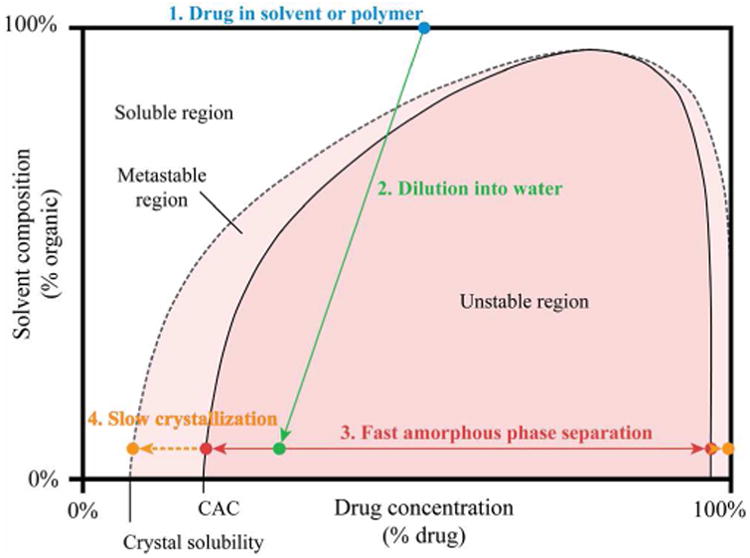
Schematic phase diagram illustrating the formation of amorphous colloids, and their ultimate precipitation into crystals.
2.3 Factors that influence the critical aggregation concentration
The CAC of an aggregator is determined by both its intrinsic properties and the conditions of the continuous phase. Equation 1 estimates the CAC as a function of the crystal solubility (Csat), enthalpy of fusion (ΔHf), melting temperature (Tm), temperature (T), gas constant (R), and a correction factor that accounts for the aggregator-rich phase containing solutes such as water (exp(-I(a2))) [15, 36]. This approach generally yields a good approximation of the CAC; more rigorous methods are more predictive when the degree of undercooling (Tm – T) is high [29].
| 1 |
For a single-aggregator system, the enthalpy of fusion, melting temperature, and correction factor are static and intrinsic to each aggregator. However, the CAC is also affected by extrinsic factors. For example, the CAC can be indirectly altered by factors that affect the crystal solubility (Csat), as is evident from Equation 1. This property, while heavily dependent on the nature of the aggregator, is strongly affected by the solvent conditions [3, 15, 32]. For example, crystal solubility is increased with increasing temperature, which increases the CAC; however, some systems exhibit a minimum CAC at temperatures between 20 and 40 °C [15], which may arise from the temperature term in the first exponential of Equation 1. Additionally, adding salts to the aqueous phase reduces the solubility of relatively non-polar aggregators, and the CAC will be reduced, similar to self-assembled micelle systems [37, 38]. Conversely, adding an organic solvent that is miscible with water (e.g. ethanol, DMSO or THF) will increase the aggregator solubility, and the CAC will increase. Addition of solubilizing excipients such as cyclodextrins or surfactants can greatly increase the effective CAC of an aggregator because the aggregator partitions with the solubilizer, reducing the concentration of aggregator in the continuous phase [22, 26, 35, 39, 40]. Similarly, changing the pH can appear to change the CAC of an aggregator with ionizable groups[31, 41]. This phenomenon is often due to conversion of the neutral aggregator to a generally more soluble charged species. In pH conditions that favour the charged species, a higher overall aggregator concentration is needed for the neutral aggregator to reach its CAC; however, the true value of the CAC is unaffected by pH [28]. Practically, this means that the observed CAC of an aggregator depends on the composition and pH of the media.
2.4 Aggregation of multiple compounds
When multiple aggregators are present in a solution they may co-aggregate to form multi-compound colloidal aggregates, if they are miscible in the amorphous state [40, 42]. Interestingly, these mixtures can form aggregates even when each aggregator is below its individual CAC; here, formation of aggregates occurs when the “compound load” exceeds a critical threshold [40, 42, 43]. Above this mixed CAC, different ratios of each aggregator will produce colloids with different compositions. In colloids of multiple aggregators that are completely miscible, the concentration of each compound in the continuous phase (i.e. the CAC) depends on their mole fraction in the mixture, as given by Equation 2 [42]:
where the CAC1° is the CAC of the compound and x1 is the mole fraction of the compound. For example, if an aggregator comprises 50 mol% of the colloidal phase (x1 = 0.5), its concentration in the continuous phase will be 50% of its CAC. Conversely, when multiple completely immiscible aggregators are combined their concentration in the continuous phase (CAC) remains unchanged. These changes to the CAC of each aggregator likely originate from the correction term of Equation 1, since this term accounts for other compounds that are incorporated into the colloid. In some cases, hydrophobic non-aggregators can be incorporated into colloids of another compound, similar to a solute partitioning between two immiscible liquid phases. For example, fluorescent dyes can be non-covalently incorporated into colloidal drug aggregates to enable their characterization (discussed in Section 3.3) [15, 19, 44].
2.5 Macromolecule adsorption onto colloidal aggregates
At least partly due to their high surface area, and perhaps to the apolar nature of that surface, colloidal aggregates sequester macromolecules such as proteins, as illustrated in the following examples. The interaction of colloids with proteins was first observed through their non-specific and time-dependent enzyme inhibition [22] (further discussed in Section 4.1). Enzymes adsorb onto the surface of colloids and are partially unfolded, resulting in a loss of enzymatic activity [8]. The binding of proteins to the colloid is driven by surface interactions between the colloid and proteins, and often has dissociation constants in the picomolar range [5, 45]. Intriguingly, adsorption to colloids is specific to proteins, and has not been observed with other common biomolecules. Comparing fluorescently labeled proteins and DNA, only proteins were observed to be substantially adsorbed to colloidal aggregates; all DNA (single- or double-stranded) remained fully solubilized [30]. Full proteins also adsorbed more strongly than peptide fragments. For example, in a competitive assay in which the full b-lactamase protein and its peptide fragments were incubated with colloids, the presence of peptides had little impact on the inactivation of the enzyme by the colloids, demonstrating the preferential binding of full proteins to the colloidal surface. While protein adsorption to nanoparticles is not unique to colloidal aggregates, their reversible formation provides a unique method for enzyme re-activation [46].
2.6 Detergent reversibility
A defining property of colloidal aggregates is their detergent reversibility. When detergents are added to the colloids, at concentrations greater than the aggregator concentration, the colloids can be disrupted [22, 47]. We have typically used 0.01% (v/v) Triton X-100 and 0.025% (v/v) polysorbate 80 to disrupt aggregation in enzyme- and cell-based assays, respectively [16, 48]. While lower concentrations can prevent enzyme inhibition [22], they can also stabilize colloidal aggregates, likely through surface passivation (discussed further in Section 5.3) [19]. The true effects of colloid-forming compounds in enzyme and cell-based assays can be probed using detergents to disrupt colloid formation (discussed further in Sections 4.1 and 4.2) [16, 22].
3 Identifying and characterizing colloidal aggregates
The unique properties of colloidal aggregates allow several analytical techniques to be used. These methods have been successfully employed to identify the presence of colloidal aggregates under many experimental conditions. Colloidal aggregates have similarities to other nano-emulsions (e.g. polymeric nanoparticles, drug nanocrystals, etc.) such as their particulate nature, reversible and concentration-dependent formation, and macromolecule adsorption. However, their unique properties permit selective techniques for their identification and study. In this section, we highlight the most prevalent assays. These techniques have been used to determine the presence of colloids, their respective CACs, and their stability under physiologically relevant conditions.
3.1 Light scattering
Due to the particulate nature of colloidal aggregates, their presence in solution is easily identified by light scattering techniques. The formation of colloidal aggregates leads to a significant increase in scattering intensity (at least one order of magnitude greater than background scattering), which increases beyond the CAC (Figure 1B, 3A, 3B) [3, 7]. This method has been used to identify the colloid-forming tendencies of many compounds and their respective CACs. As expected, when colloids are disrupted by detergents scattering intensity is reduced; since detergents themselves can also form micelles, their own scattering must be considered during these experiments. Background scattering can also be a limitation in studying colloidal aggregates in physiologically relevant conditions, such as serum-containing media, due to scattering by serum proteins themselves [49]. Scattering intensity can be used to study the stability of colloids, as precipitated particles will settle out and result in a decreased scattering intensity [50]. Wang and Matayoshi developed a high-throughput light scattering assay to test compound aggregation and compared this method to commonly-used solubility tests [51].
Figure 3.
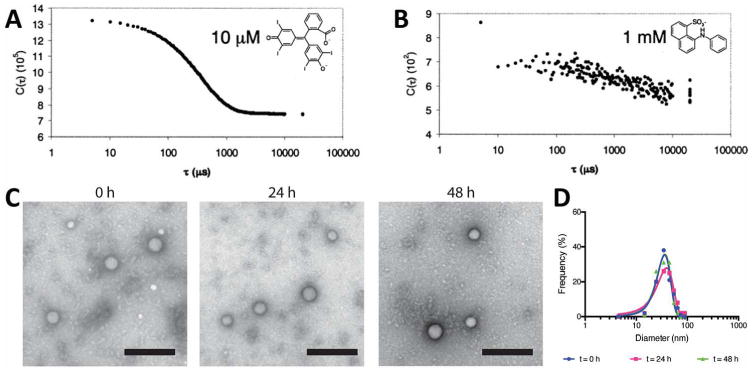
Representative auto-correlation functions for (A) colloid-forming compound and (B) non-aggregator. Reprinted with permission from Ref. [3]. Copyright 2002 American Chemical Society. (C) Transmission electron micrographs of colloidal drug aggregates during incubation in serum-containing media. Colloids of pentyl-PABC doxazolidine were incubated in 10% fetal bovine serum for 0, 24 and 48 h. Negative staining of colloids with uranyl acetate. (D) Quantification of colloid diameter based on electron micrographs. Reprinted with permission from Ref. [19] Copyright 2017 American Chemical Society.
In addition to identifying their presence, dynamic light scattering (DLS) can be used to measure the hydrodynamic diameter distribution of suspended particles [52]. Most colloids are typically a few hundred nanometers shortly after formation and at concentrations close their CACs. After colloids form, dynamic light scattering can be used to monitor changes in their diameter over time [3, 7, 15, 26].
Light scattering can also be used in combination with flow cytometry to quantify size and number of colloids formed [7]. When a flow cytometer modified to measure light scattering was used, the number of colloidal particles increased linearly with increasing compound concentration above the CAC [7]. Since the compound concentration and the size of the colloids were both known, assuming solid particles allowed for calculations of the aggregate species concentration itself. For nicardipine and miconazole, which have particles diameters of 300-600 nm, the aggregate concentration was in the femtomolar range, while the concentration of drug molecules was in the micromolar range. While this method was limited to particles greater than 300 nm due to the limit of detection of the instrument, the results provided important insights into the CAC and stoichiometry of colloidal aggregation, which can be extended to many colloid-forming compounds.
3.2 Electron microscopy
Electron microscopy suggests that colloidal aggregates, at least under the required imaging conditions, are spherical (Figure 1A) [3]. The distinct morphology of amorphous colloidal aggregates versus those of crystalline nanoparticles can also be investigated using electron microscopy techniques [53]. Transmission electron microscopy (TEM) has been used to visualize the adsorption of enzymes to the colloid surface as a mechanism of non-specific inhibition [22].
Electron microscopy has also aided in the study of colloidal drug aggregates under physiologically relevant conditions where light scattering techniques are limited [16, 19, 46, 50]. Using electron microscopy, measurement of colloidal diameters during incubation in media containing 10% serum proteins is possible (Figure 3C, 3D) [19]. Importantly, the dehydrated conditions of electron microscopy lead to smaller diameters than those measured by light scattering in a hydrated state. Due to the organic nature of these particles, many studies have used negative stains (e.g. uranyl acetate, ammonium molybdate) to enhance their visualization by TEM, though studies without negative stains are also possible [3, 19, 22, 31, 46].
3.3 Fluorescence assays
Due to their amorphous state, colloidal aggregates can incorporate hydrophobic fluorophores, which facilitates their visualization and characterization. For example, Ilevbare et al. incorporated pyrene into colloids, and used subsequent changes to its emission properties, to measure the CAC of several lipophilic drugs including ritonavir and felodipine (Figure 4) [15]. Specifically, the I1/I3 emission peak intensity ratio of pyrene is sensitive to the polarity of the chemical environment (I1 at 373 nm and I3 at 383 nm). As the environment in which the pyrene is solubilized becomes more hydrophobic there is a decrease in the I1/I3 ratio. At concentrations below the CAC, pyrene had an emission spectrum similar to that of free pyrene. At the CAC of the compound and higher concentrations, there was a sharp decrease in the I1/I3 ratio, indicating that the dye is in the more hydrophobic environment of the colloid. These results were corroborated with DLS and the obtained CACs showed good agreement between the two methods. In addition to steady-state fluorescence measurements, the fluorescence lifetime of incorporated fluorophores (i.e. a measure of the how long the fluorophore remains in the excited state) can also be used to study the state of aggregates [54].
Figure 4.
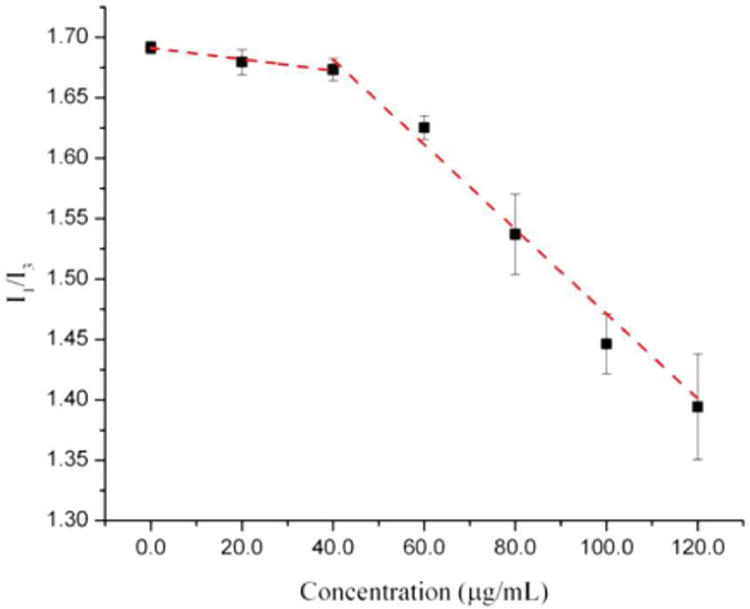
Measurement of CAC by fluorescence properties of pyrene upon inclusion into colloidal drug aggregates of ritonavir. The onset of aggregation corresponds to the decrease in I1/I3 fluorescence ratio as the pyrene enters a more hydrophobic environment. Reprinted with permission from Ref. [15]. Copyright 2013 American Chemical Society.
Since these fluorophores can only incorporate into particles of amorphous nature, they can also be used to study the onset of crystallization [26]. As crystallization occurs, the probe becomes excluded from the crystal lattice of the aggregator and returns to the polar environment of the aqueous phase. The incorporation of fluorophores allows colloids to be studied in complex biological environments mimicking those in vivo [38, 55]. The stability of colloidal aggregates in serum containing media and their interactions with cells has been studied using fluorescence measurements (and is further detailed in Sections 4.2 and 5) [19, 50].
3.4 Nuclear magnetic resonance
Nuclear magnetic resonance (NMR) is commonly used to study the chemical properties of many materials. Recently LaPlante et al. used 1H-NMR to study the onset of colloidal aggregation [56, 57]. While fully solubilized small molecules have sharp peaks due to their fast tumbling, precipitates tumble too slowly to resonate [58]. Colloidal aggregates are an intermediate state where tumbling is fast enough for resonance to occur, but their presence leads to changes in local magnetic fields and chemical environments. With single molecules, only the peak intensity changes as a function of concentration; however, once aggregation has occurred, increasing concentrations result in changes to peak number, shape, and shifts. As is characteristic of colloidal aggregation, upon the addition of detergents, peak properties return to those of solubilized small molecule solutions. 1H-NMR has also been used to study the interactions between stabilizers and colloidal aggregates [59].
While these methods corroborate other methods, they are limited in their application to aggregates of small sizes (< 200 nm diameters) as the tumbling of large aggregates is too slow to resonate on NMR timescales. Additionally, the limit of detection is only around 12 μM [57]; thus, this method is not useful for measuring the CACs of compounds below this limit, but can still be useful for identifying the presence of aggregates at higher concentrations.
3.5 Other methods
While the four techniques described above have been the most extensively used to study and characterize colloidal aggregates, other techniques have also been used. For example, surface plasmon resonance has been applied to study colloidal aggregation interactions with proteins [45]. Flow-cell surfaces modified with proteins were used to study their interactions with colloids and could reproduce concentration-dependence and detergent-reversible properties of colloidal aggregates. Polarized light microscopy has been used to support the non-crystalline nature of phase-separated drug solutions where aggregates were found to be non-birefringent [15, 60]. Size exclusion chromatography has been commonly used for the study of self-assembled polymeric nanoparticle stability in physiologically relevant media [61, 62]. This technique also allows for the separation of serum proteins from fluorophore-labelled colloidal particles to study the stability of colloidal drug aggregates in serum-containing media [19, 50].
4 Implications of colloidal aggregates
In addition to their interesting physical properties, colloidal aggregates have unique interactions with biological environments. As mentioned in Section 2.5, their interactions with proteins can result in false hits in HTS. Furthermore, their stability in the presence of high-protein milieus impacts both in vitro and in vivo analyses. Proteins are abundant in biological systems, where their interactions with other macromolecules drive important biochemical pathways and physical transport phenomena. Understanding the interactions of colloids with proteins and cells is key to understanding in vitro and in vivo data.
4.1 Interactions of colloidal aggregates with proteins
A characteristic of colloidal aggregates is their strong surface adsorption of proteins. Direct association of colloids with proteins has been shown by centrifugation of solutions with both colloids and proteins (Figure 5), where the protein is concentrated in the colloid pellet [22, 46, 50]. TEM imaging of the colloid-protein complex has also confirmed their direct association [22]. Colloids are stable in high-protein milieus and even form in the presence of proteins [16, 63].
Figure 5.
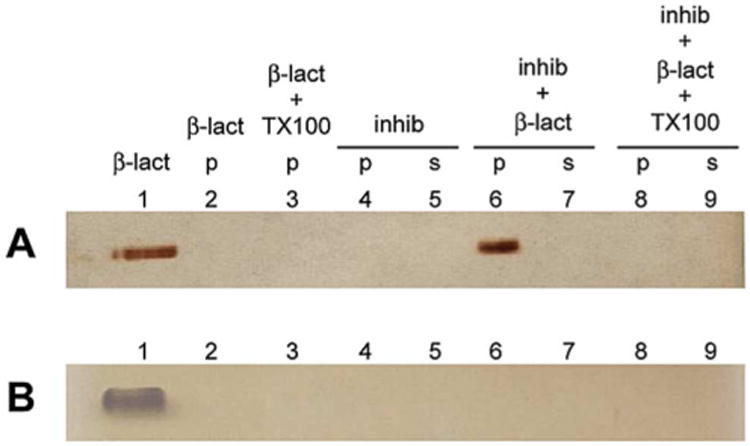
Centrifugation-based identification of colloid-bound protein. In the presence of colloids (inhib), enrichment of the enzyme (β-lactamase) is observed in the pelleted colloid. Protein enrichment is not observed when colloids are disrupted with detergent or in the presence of a non-aggregating specific inhibitor. Reprinted with permission from Ref. [22]. Copyright 2003 American Chemical Society.
In the case of enzymes, adsorption to the colloid surface typically leads to a loss of catalytic activity. This phenomenon is non-specific and colloid-forming compounds inhibit many unrelated enzymes at micromolar concentrations [3, 14, 48]. Enzyme inhibition is typically time-dependent and partly reversible, as demonstrated by adsorption kinetics studies. Liu et al. showed that initial rates of the reaction were inhibited by aggregates, and were suggestive of non-competitive inhibition wherein the aggregate binds to both free enzyme and the enzyme-substrate complex [64]. Upon disruption of the colloids (either by dilution or solubilization with detergents), the majority of enzyme activity returns [22]. Intriguingly, colloidal aggregates can actually stably sequester enzymes, preserving their activity until the colloid is disrupted [46].
The origins of protein inhibition by colloidal aggregates appears to be sequestration followed by partial unfolding, though the importance of the second, unfolding step, remains to be fully determined. The occurrence of partial enzyme unfolding has been demonstrated in several ways [8, 63]. First, incubation of a β-lactamase-colloid complex with the irreversible inhibitor moxalactam led to no observable effect on the reactivated enzyme after colloid disruption, indicating that there is no significant exchange between bound and free enzyme. Second, binding of β-lactamase to colloids followed by deuterium-hydrogen exchange, led to increased incorporation of deuterium into the enzyme, as measured by mass spectroscopy after protease digestion. Such increased incorporation into the peptide backbone suggests increased accessibility to the solvent due to at least local unfolding. Third, β-lactamase bound to colloids was much more susceptible to trypsin degradation than was the free enzyme, further supporting denaturation of the enzyme on colloid binding. Because the enzyme regains much of its activity rapidly on colloid disruption, within the dead-time of a spectrophotometric assay, it seems likely that the unfolding that the enzyme suffers on the colloids surface is local and transient. Consistent with this view, antibodies adsorbed to the surface of colloidal aggregates remain able to bind to their target receptor, indicating that the antigen-binding region can still adopt an active conformation [50].
Based on particle counting methods combined with enzyme activity assays, Coan et al. concluded that colloidal particles had sufficient surface area to adsorb all the protein used in their study, but this observation does not rule out protein absorption into the colloid core [7]. While the molar ratio of protein to colloid-forming compounds in these systems may be on the order of 1:1000, the ratio of enzyme to colloidal particle is much higher since each particle contains millions of drug molecules. This higher ratio of enzyme to colloid also makes it possible for the particle surface to become saturated. For example, pre-incubation of colloids with albumin significantly reduces enzyme inhibition because albumin adsorbs to the colloid surface, leaving less surface area for enzymes [3]. The colloidal surface may also be saturated with other macromolecules, such as surfactants or polymers; in these cases, protein adsorption is also greatly reduced [19]. Notably, the addition of protein to the already formed colloid-enzyme complex neither frees adsorbed protein nor restores catalytic activity [63], likely due to the slow dissociation of already bound enzyme (picomolar dissociation constants).
4.2 Membrane transport of colloidal drug aggregates
Drug transport across cell membranes is key to efficacy. Studying membrane transport of drugs using a standard diffusion cell, with the donor and receiver chambers separated by a semipermeable membrane, Taylor et al. found that when colloidal drug aggregates form, there is an upper limit for flux across the synthetic membrane (Figure 6) [65]. When the donor chamber concentration was below the CAC, they found that the flux of felodipine increased linearly with increasing concentrations. However, when the donor cell concentration exceeded the CAC, the flux of drug remained constant over all concentrations tested. This observation supports the formation of colloidal drug aggregates, as any drug above the CAC self-assembles into particles, which cannot cross the membrane. Thus, the effective drug concentration that drives diffusion is limited at the CAC; only the non-colloidal drug amount is able to diffuse into the receiver chamber, which leads to a constant flux when the total drug concentration is greater than the CAC. As diffusion occurs, the drug in the continuous phase is replenished by drug within the colloidal aggregates and thus flux is maintained over time.
Figure 6.
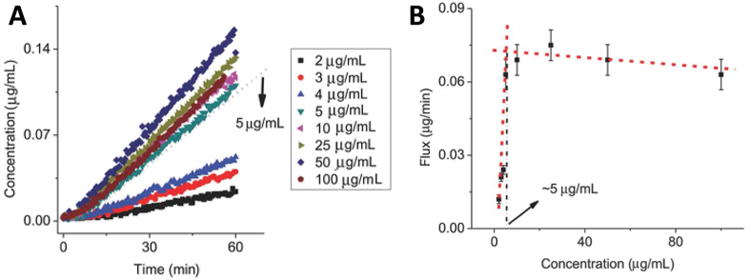
(A) Felodipine concentration in the receiver compartment over time and (B) diffusive flux profiles demonstrate significant transition upon aggregate formation at 5 μg/mL. Reprinted with permission from Ref. [65]. Copyright 2014 Wiley-VCH.
Due to the reversible nature of colloidal aggregation, the presence of solubilizing excipients also influences the diffusive flux across membranes. When only low concentrations of micellar detergents are present, the thermodynamic activity of the drug and therefore the diffusive flux remain constant. When an excess of detergents is used to disrupt colloids, drug molecules partition with these detergents and there is a reduction in flux due to a decrease in the concentration of free, non-micelle-bound drug to below the CAC [39]. A similar observation is made when the aqueous environment itself affects the aggregation properties of the compounds. For example, Raina et al. observed a difference in diffusive flux of felodipine in phosphate buffer versus simulated intestinal fluid (SIF) [39]. Constant flux above a certain concentration was observed in both buffers; however, the concentration at which this plateau was observed was significantly higher in SIF, which is indicative of a higher CAC in this medium. While these studies have important implications in the context of oral drug delivery, the role of active transport processes and presence of biomacromolecules, such as proteins and lipids, remain sparsely studied.
4.3 Colloidal drug aggregates in cell culture
Colloidal aggregates are stable in high-protein milieus, and it is perhaps unsurprising that their presence would have an impact on drug activity in cell culture assays [16, 20]. For instance, when aggregating chemotherapeutic compounds reach their CAC values and adopt a colloidal form in cell culture, a substantial decrease (in some cases a total loss) of cytotoxic activity is observed. Conversely, when a free drug monomer population is maintained, through the addition of detergents, the activity of the drug returns. The concentration at which loss of drug activity occurs coincides with the CAC of the compounds [20]. In contrast to the expected monotonic sigmoidal dose-response curve observed for many chemical inhibitors, a “bell-shaped” dose response curve was observed for many colloidal aggregators (Figure 7A). “Bell-shaped” curves are common in the literature, and are typically explained by the engagement of multiple cellular pathways. Undoubtedly this explanation holds for many molecules, but for at least some molecules these unusual curves will reflect the formation of colloidal aggregates [20].
Figure 7.
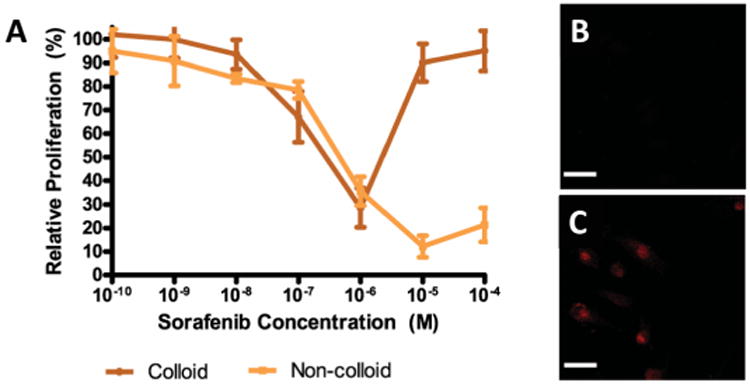
(A) “Bell-shaped” dose-response curve of the colloid-forming anti-neoplastic drug, crizotinib. Upon colloid formation, loss of anti-proliferative activity is observed. Intracellular fluorescence after incubation with (B) colloidal and (C) monomeric formulations of Evans blue shows inability of colloids to permeate cell membrane. Reprinted with permission from Ref. [20]. Copyright 2014 American Chemical Society.
The interactions between colloid-forming dyes and cells were investigated to further understand the mechanism of drug activity loss (Figure 7B, 7C) [20]. When colloidal dye particles were incubated with cells, little to no fluorescence was observed within the cell, indicating that colloids were not internalized by cells. However, upon disruption of the dye colloids with detergents, solubilized dye molecules could freely cross the cell membrane. Permeabilized membranes allowed both colloidal and monomeric dye solutions to enter cells. This observation suggests that the loss of drug activity in colloidal formulations is due to the inability of drug colloids to cross cell membranes. Consistent with previous work investigating nanoparticle-cell interactions, these results suggest that, in high-protein milieus, the strong affinity of the colloid surface for proteins leads to immediate protein adsorption. This formation of a protein corona prevents interactions between the colloid and cell surface, thus limiting entry of the drug into cells [66-68].
In recent studies, we have found that colloids can be modified with proteins that are recognized by cell surface receptors, thereby promoting cellular uptake [50]. Colloids were passivated with a protein corona comprising the targeting antibody trastuzumab, which is specific to human epidermal growth factor receptor 2 (HER2) antigens. Even in the presence of serum proteins, these colloids were selectively internalized by HER2-overexpressing cancer cells but not by cells that had low expression of HER2. Conversely, colloids coated with a non-specific IgG were not internalized by either cell type.
4.4 Persistence of colloidal drug aggregates in vivo
Based on expected gastric drug concentrations and the diversity of conditions under which colloidal aggregation occurs, it is not surprising that colloidal drug aggregates are in fact present in vivo. Doak et al. observed that many compounds formed colloids at concentration relevant to in vivo dosing regimens in simulated gastric environments in vitro [69]. Work by Frenkel et al. suggests that not only do colloids form and persist in the gastrointestinal tract, but their presence also impacts the bioavailability of these compounds in vivo [31, 70].
Frenkel et al. investigated the colloid-forming properties of a number of non-nucleoside reverse transcriptase inhibitors (NNRTIs) which have known pharmacokinetic parameters in rodent models and humans [31]. They identified a number of NNRTIs that form colloidal particles in simulated gastric environments at concentrations similar to those expected in the gastrointestinal tract after oral dosing. They classified these compounds into two groups based on aggregate size: small particles (60-220 nm diameters) and large particles (>500 nm diameters). They found good correlations between this classification of compounds and their known pharmacokinetic parameters. For example, compounds that formed aggregates with small diameters had good adsorption/bioavailability parameters (AUC > 5 μg·h/mL) while those that formed large aggregates had poor bioavailability (AUC < 1 μg·h/mL). The authors hypothesized that the smaller aggregates were absorbed by M cells of the Peyer's patch and then entered systemic circulation via lymphatic circulation. This result is consistent with other studies investigating nanoparticle formulations for oral delivery [71, 72]. In contrast, larger aggregates appeared to have precipitated, thus limiting the bioavailability of the drug.
Since changes in pH play an important role in gastrointestinal drug absorption, Frenkel et al. also investigated the effect of pH on aggregation and subsequent bioavailability. For most of the compounds studied, an increase in pH led to an increase in aggregate size; however, the degree to which the aggregate size changed depended on the compound itself [31]. This pH-dependence on size change was correlated to bioavailability of the compound; the most bioavailable compounds were found to be the least affected by increasing pH while the least bioavailable compounds increased in size the most with increasing pH values.
5 Stabilizing colloidal drug aggregates
While the phenomenon of colloidal aggregation has traditionally been considered a nuisance in drug screening assays, their properties make them attractive as intentional formulations. Their drug-rich composition, with diameters in the hundreds of nanometers range, is highly desirable for nanoparticle-based formulations. However, for any formulation to be useful, it must be controllable and stable over the appropriate time frames and conditions. Colloidal drug aggregates have been stabilized with polymeric excipients, other aggregating compounds, and proteins.
5.1 Mechanisms of colloid destabilization
To formulate stable colloids, the forces that destabilize them must be understood. As small, hydrophobic particles dispersed in water, non-stabilized colloidal aggregates are prone to further aggregating together in a process called flocculation. The driving force for flocculation is the reduction in colloid-water contact area when particles stick together, which reduces the total free energy of the system. As two colloidal particles in solution approach each other, attractive and repulsive forces between them determine the probability of flocculation. Some of these forces are described by DLVO theory, which considers attractive van der Waals forces between particles and the repulsive electrostatic forces between their electrical double layers [73]. Under low ionic strength conditions, the double layer is disperse, giving the particle an effective charge which repels other similarly charged particles. However, in salt solutions, the double layer is compacted, the surface and double layer charges negate each other, and the colloids tend to further aggregate into large, polydisperse particles [3]. In addition to growing through flocculation, colloidal aggregates can grow over time through ripening, wherein material dissolves from smaller particles (due to their higher surface energy) and is absorbed by larger particles [32]. While growth through ripening maintains a monomodal particle size distribution with low size dispersity, flocculation is distinguished by the emergence of a second population of large flocs.
Due to their metastable amorphous nature, colloidal aggregates are also prone to crystallization. The driving force for crystallization is measured by the supersaturation (S), which is the ratio of the concentration of a species and its crystal solubility. Crystallization is thermodynamically favored for systems with supersaturation values greater than 1, i.e. when the solute concentration exceeds its crystal solubility [74]. In phase-separated colloidal systems, the concentration of free aggregator is maintained at the CAC, and thus supersaturation is the ratio of the CAC and the crystalline solubility. Since the CAC is typically higher than the crystal solubility, colloid-containing media are supersaturated (S > 1); therefore, the drug will eventually precipitate [17, 26, 50]. Furthermore, because both phases are in equilibrium, the supersaturation of the colloid is the same as the continuous phase [60]. Although crystals are thermodynamically favored, there is a kinetic barrier to forming new crystals as very small crystals tend to dissolve due to their high surface area to volume ratio. Due to this barrier, a growing particle must reach a critical size before it persists [74]. Classical nucleation theory states that increasing supersaturation increases the rate at which these stable nuclei are formed [32].
Crystal nucleation is thought to occur at the colloid-water interface because of the reduced energy barrier for nucleation within the colloid [17]. Once formed, the crystals likely grow into the colloids, since the interfacial tension between crystal nuclei and the drug-rich phase is minimal [26, 59]. This mechanism is supported by the fact that crystallization is accelerated by the presence of colloids [26]; furthermore, crystallites have been directly imaged inside the solute-rich phase of some phase-separated systems [75, 76].
Though we currently cannot predict why some compounds persist as amorphous aggregates while others rapidly crystallize, studies on supercooled drug melts suggest that molecules with high molecular weight, high flexibility, and diverse intermolecular hydrogen bonding patterns crystallize slowly due to the configurational requirements to fit into the crystal lattice and the high viscosity of the drug-rich phase [41, 77, 78]. Thermodynamically, slow crystallizers have low enthalpies and entropies of fusion, and low melting temperatures [79]. As demonstrated by Equation 1, these factors contribute to a lower supersaturation at the CAC, ultimately reducing the crystallization rate and leading to good kinetic stability.
5.2 Stabilizing colloids with polymeric excipients
A common method of stabilizing colloidal aggregates uses polymers that produce steric repulsive surface forces [38, 80]. Sterically stabilized particles are prevented from flocculating by unfavorable mixing and compression of adsorbed stabilizer due to osmotic forces as two particles approach each other [73]. For effective steric stabilization, the stabilizer should completely cover the particle surface, have segments that mix favorably with the solvent, and form a corona on the particle surface that is thicker than 5 nm [73]. Early work found that the use of detergents could prevent precipitation and maintain these aggregates in a colloidal state [31]. Moreover, colloids formulated with many polymeric excipients have significantly improved stability [19]. Low concentrations of the surfactants could stabilize colloidal aggregates of fulvestrant and the investigational drug pentyl-PABC doxazolidine, over 48 h in buffered solutions. Surfactants greatly reduced protein adsorption to the colloids and rendered these formulations stable in serum-containing media as well. This enhanced serum stability is important for use of colloids in physiologically relevant conditions.
In addition to providing steric stability, polymers can increase stability against crystallization, and low concentrations of polymers can increase the induction time before crystallization occurs [17, 39, 59, 81, 82]. Two mechanisms are thought to contribute to this effect. First, macromolecular additives can increase the crystalline solubility of the drug or decrease its CAC by altering the correction factor in Equation 1 [17]. These changes reduce supersaturation, lowering the crystal nucleation rate. Second, adsorbed macromolecules are thought to alter the nucleation kinetics at the water-colloid interface. Adsorbed species can either accelerate or retard drug crystallization, depending on the nature of both species [26, 83]. This non-uniform behavior may be due to the different localizations of each polymer within the colloid, which arise from differences in polymer-drug interactions [39]. Some macromolecules localize to the colloid surface, thereby interfering with heterogeneous nucleation; some may partition into the colloids, inhibiting crystal growth inside the particle [59]. Other macromolecules do not adsorb significantly and have little effect on nucleation kinetics [84]. Another factor is differences in hydrophobic interactions between the polymer and drug. For example, the structure of the hydrophobic segments of a series of surfactants correlates with its ability to suppress or enhance the crystallization of amorphous celecoxib [83]. In cases where crystallization is enhanced, the macromolecule may reduce the activation barrier for nucleation by stabilizing the crystal nucleus. However, polymers adsorbed onto pre-formed drug crystals can also inhibit their growth to varying degrees [85, 86], which could help sustain a population of colloids even in the presence of a few crystals. In general, partially hydrophobic polymers, which can suppress nucleation at the water-colloid interface, seem to best stabilize colloidal aggregates against crystallization.
5.3 Co-aggregation to stabilize drug colloids
Recently, co-formulation of aggregators with azo-dyes—which themselves form aggregates—has been shown to stabilize the colloids (Figure 8A) [46]. Stable colloids of sorafenib and vemurafenib were formed with the aggregating dyes Congo red and Evans blue, and the resulting co-formulated colloids were unusually mono-dispersed with small diameters (50–100 nm). Drug to dye ratios as low as 25:1 yielded colloidal aggregates that were stable over 72 h in buffered solutions and even in serum-containing media [30]. The incorporation of the azo-dyes in these colloids resulted in highly negative surface charges (zeta potentials of approximately -40 mV), and the resultant electrostatic repulsion may be the driving force of the colloidal stability of these formulations. In addition to having exceptional stability, dye-stabilized colloids preserved the activity of adsorbed enzymes. Enzymes loaded onto these colloids were active after 72 h once released back into solution, while free enzyme was only stable for 4 h.
Figure 8.
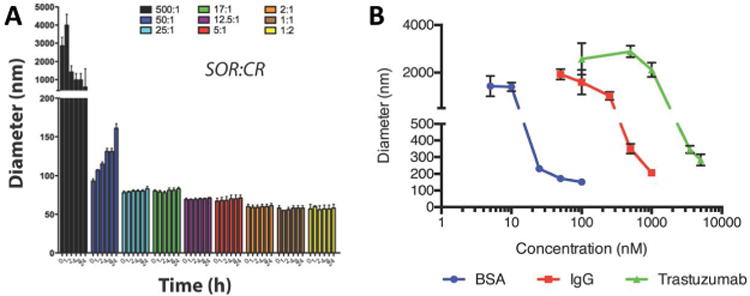
(A) Stabilization of sorafenib through co-aggregation with Congo red. A minimum drug to dye ratio of 25:1 is required for stability. Reprinted with permission from Ref. [46]. Copyright 2016 American Chemical Society. (B) Size of colloids stabilized by protein coronas have a concentration-dependent relationship. Different drug-protein combinations require different amounts of proteins for stability. Reprinted with permission from Ref. [50]. Copyright 2017 American Chemical Society.
5.4 Exploiting protein adsorption to stabilize colloidal aggregates
A decade of work has established that colloidal aggregates bind strongly to proteins. This property was exploited to stabilize colloidal aggregates using a protein corona on the colloid surface, which provided stabilizing steric repulsive forces [50]. Protein corona formation could control colloidal aggregate size in a concentration-dependent manner (Figure 8B). These colloids had enhanced stability in buffered solutions (maintenance of colloid size over 48 h) compared to non-stabilized colloids, which precipitated over the course of 24 h. The protein-stabilized colloids were also stable in serum-containing media. Importantly, this strategy is amenable to a range of proteins and compounds. However, each drug-protein combination likely has a different ratio for optimal stability, since the properties of the colloidal surface and the protein drive these interactions.
6 Conclusions and outlook
Self-aggregation to form colloidal particles is a phenomenon exhibited by a wide range of compounds, including many drug molecules and dyes; there is evidence that over 10,000 molecules can form these species, and presumably many more can. Though the colloidal particles are metastable, the colloid-forming compounds discussed herein show delayed crystallization. To be classified as a colloidal aggregator, the following properties are required:
CAC-dependent formation of distinct colloidal particles;
Non-specific protein adsorption and inhibition of enzymes (model enzymes used to demonstrate this include β-lactamase, α-chymotrypsin, and malate dehydrogenase); and
Detergent-reversible formation (e.g. return of enzyme activity and return of small molecule activity in cell-based assays following detergent addition).
Detergent reversibility provides a robust means of controlling for aggregation in many enzyme-and cell-based assays. Different detergents may be required for each assay, taking into account the effects of the detergents themselves on the assay. We prefer Triton X-100 for enzyme inhibition studies and polysorbate 80 for cell-based assays. With appropriate controls and under the right conditions, one may now expect to control for the role of colloidal aggregation as an artifact in early drug discovery.
Due to the wide variety of conditions used in drug screening and the persistence of colloids under different conditions, efforts to predict colloidal aggregation have had limited success [10, 87, 88]. Aggregate Advisor (http://advisor.bkslab.org) is one such predictive tool that can aide in identifying potential colloid-forming compounds for further verification [89], though we caution that the tool is crude and suffers from false positives and false negatives; it has the advantage, however, of categorizing and matching to more than 10,000 observations of colloidal aggregation. As the number of known colloid-forming compounds continues to rise, and their physical and chemical properties are further explored, predictive technologies may improve.
Although colloidal aggregates have been historically viewed as a nuisance artifact in drug screens, efforts to exploit their unique properties are changing this outlook. The ability to stabilize colloidal aggregates by using excipients such as polymers, proteins, and other small molecule aggregators has allowed not only their further study, but also their potential use as intentional drug formulations [19, 50]. Many studies have investigated the impact of colloidal drug aggregation on the dissolution profiles of oral formulations [31, 33, 90]. Colloidal drug aggregates may yield formulations with drug loadings that are an order of magnitude higher than conventional nanoparticle formulations. While significant progress has been made in regard to identifying and studying these drug aggregates, key questions remain. For example, few studies have investigated the stability of colloidal drug aggregates in physiologically relevant, protein-rich conditions; even fewer have studied their interactions with cells or their fate in vivo. Furthermore, the ability to generalize current stabilization strategies to all colloid-forming compounds is unknown and will require systematic evaluation of these methods. Such studies are required to turn this phenomenon into a reliable formulations strategy.
Highlights.
Colloidal aggregates form above a critical aggregation concentration, yet can be re-solubilized to monomers with detergents
The formation of colloidal drug aggregates impact biological outcomes
Colloidal aggregates can lead to false positives in drug screens
Current efforts to stabilize and exploit colloidal drug aggregates are highlighted
Acknowledgments
This work was supported by funding from the Canadian Cancer Society Research Institute (to M.S.S. and B.K.S.), the US National Institutes of General Medical Sciences (GM71630 to B.K.S and M.S.S.), the Natural Sciences and Engineering Research Council (NSERC Discovery to M.S.S. and Postgraduate Research Scholarship to A.N.G.) and QEII graduate scholarship to E.N.D. We thank members of the Shoichet labs (in Toronto and San Francisco) for thoughtful discussion.
Biographies

Ahil Ganesh is currently a doctoral candidate in the Professor Molly Shoichet's laboratory at the University of Toronto. He received a B.A.Sc. in Engineering Science, Majoring in Biomedical Engineering from the University of Toronto. His current research interests include strategies to stabilize colloidal drug aggregates and exploit their properties for drug delivery.

Eric Donders is a Ph.D. student in Professor Molly Shoichet's group at the University of Toronto. Previously, he completed his B.A.Sc. in Engineering Chemistry at Queen's University in Kingston, Ontario. Currently, Eric researches strategies to control the stability of colloidal drug aggregates, with the goal of using these drug-rich assemblies as vehicles for drug delivery.

Brian Shoichet, PhD is a professor of pharmaceutical chemistry at the University of California -San Francisco. His work seeks to bring chemical reagents to biology, combining computational simulation and experiment. An unanticipated observation emerging from the theory/experiment cycle was the colloidal aggregation of organic molecules. Leading a lab of 10 researchers, he has published over 200 papers, many in leading journals such as Nature and Science. Professor Shoichet was awarded the 2017 American Society for Biochemistry and Molecular Biology DeLano Award for Computational Biosciences.

Molly Shoichet, PhD is University Professor at the University of Toronto and the Tier 1 Canada Research Chair in Tissue Engineering. She is an Officer of the Order of Canada and holds the Order of Ontario. Professor Shoichet leads a lab of 30 researchers, has published over 575 papers, patents and abstracts, and given over 350 lectures worldwide. She is currently Chief Scientist, Ontario.
Footnotes
Publisher's Disclaimer: This is a PDF file of an unedited manuscript that has been accepted for publication. As a service to our customers we are providing this early version of the manuscript. The manuscript will undergo copyediting, typesetting, and review of the resulting proof before it is published in its final citable form. Please note that during the production process errors may be discovered which could affect the content, and all legal disclaimers that apply to the journal pertain.
References
- 1.Bleicher KH, Bohm HJ, Muller K, Alanine AI. Nat Rev Drug Discov. 2003;2:369–378. doi: 10.1038/nrd1086. [DOI] [PubMed] [Google Scholar]
- 2.Shoichet BK. Drug Discov Today. 2006;11:607–615. doi: 10.1016/j.drudis.2006.05.014. [DOI] [PMC free article] [PubMed] [Google Scholar]
- 3.McGovern SL, Caselli E, Grigorieff N, Shoichet BK. J Med Chem. 2002;45:1712–1722. doi: 10.1021/jm010533y. [DOI] [PubMed] [Google Scholar]
- 4.Feng BY, Simeonov A, Jadhav A, Babaoglu K, Inglese J, Shoichet BK, et al. J Med Chem. 2007;50:2385–2390. doi: 10.1021/jm061317y. [DOI] [PubMed] [Google Scholar]
- 5.Shoichet BK. J Med Chem. 2006;49:7274–7277. doi: 10.1021/jm061103g. [DOI] [PubMed] [Google Scholar]
- 6.Aldrich C, Bertozzi C, Georg GI, Kiessling L, Lindsley C, Liotta D, et al. J Med Chem. 2017;60:2165–2168. doi: 10.1021/acs.jmedchem.7b00229. [DOI] [PubMed] [Google Scholar]
- 7.Coan KE, Shoichet BK. J Am Chem Soc. 2008;130:9606–9612. doi: 10.1021/ja802977h. [DOI] [PMC free article] [PubMed] [Google Scholar]
- 8.Coan KE, Maltby DA, Burlingame AL, Shoichet BK. J Med Chem. 2009;52:2067–2075. doi: 10.1021/jm801605r. [DOI] [PMC free article] [PubMed] [Google Scholar]
- 9.McGovern SL, Shoichet B. J Med Chem. 2003;46:1478–1483. doi: 10.1021/jm020427b. [DOI] [PubMed] [Google Scholar]
- 10.Seidler J, McGovern SL, Doman TN, Shoichet BK. J Med Chem. 2003;46:4477–4486. doi: 10.1021/jm030191r. [DOI] [PubMed] [Google Scholar]
- 11.Ma W, Cheetham AG, Cui H. Nano Today. 2016;11:13–30. doi: 10.1016/j.nantod.2015.11.003. [DOI] [PMC free article] [PubMed] [Google Scholar]
- 12.D'Addio SM, Prud'homme RK. Adv Drug Deliv Rev. 2011;63:417–426. doi: 10.1016/j.addr.2011.04.005. [DOI] [PubMed] [Google Scholar]
- 13.Qin SY, Zhang AQ, Cheng SX, Rong L, Zhang XZ. Biomaterials. 2017;112:234–247. doi: 10.1016/j.biomaterials.2016.10.016. [DOI] [PubMed] [Google Scholar]
- 14.Duan D, Doak AK, Nedyalkova L, Shoichet BK. ACS Chem Biol. 2015;10:978–988. doi: 10.1021/cb5009487. [DOI] [PMC free article] [PubMed] [Google Scholar]
- 15.Ilevbare GA, Taylor LS. Crystal Growth & Design. 2013;13:1497–1509. [Google Scholar]
- 16.Owen SC, Doak AK, Wassam P, Shoichet MS, Shoichet BK. ACS Chem Biol. 2012;7:1429–1435. doi: 10.1021/cb300189b. [DOI] [PMC free article] [PubMed] [Google Scholar]
- 17.Jackson MJ, Toth SJ, Kestur US, Huang J, Qian F, Hussain MA, et al. Mol Pharm. 2014;11:3027–3038. doi: 10.1021/mp500201s. [DOI] [PubMed] [Google Scholar]
- 18.Li N, Gilpin CJ, Taylor LS. Mol Pharm. 2017;14:1691–1705. doi: 10.1021/acs.molpharmaceut.6b01151. [DOI] [PubMed] [Google Scholar]
- 19.Ganesh AN, Logie J, McLaughlin CK, Barthel BL, Koch TH, Shoichet BK, et al. Mol Pharm. 2017;14:1852–1860. doi: 10.1021/acs.molpharmaceut.6b01015. [DOI] [PMC free article] [PubMed] [Google Scholar]
- 20.Owen SC, Doak AK, Ganesh AN, Nedyalkova L, McLaughlin CK, Shoichet BK, et al. ACS Chem Biol. 2014;9:777–784. doi: 10.1021/cb4007584. [DOI] [PMC free article] [PubMed] [Google Scholar]
- 21.Mosquera-Giraldo LI, Taylor LS. Mol Pharm. 2015;12:496–503. doi: 10.1021/mp500573z. [DOI] [PubMed] [Google Scholar]
- 22.McGovern SL, Helfand BT, Feng B, Shoichet BK. J Med Chem. 2003;46:4265–4272. doi: 10.1021/jm030266r. [DOI] [PubMed] [Google Scholar]
- 23.Zhao CL, Winnik MA, Riess G, Croucher MD. Langmuir. 1990;6:514–516. [Google Scholar]
- 24.Wilhelm M, Zhao CL, Wang YC, Xu RL, Winnik MA, Mura JL, et al. Macromolecules. 1991;24:1033–1040. [Google Scholar]
- 25.Goddard ED, Turro NJ, Kuo PL, Ananthapadmanabhan KP. Langmuir. 1985;1:352–355. doi: 10.1021/la00063a015. [DOI] [PubMed] [Google Scholar]
- 26.Ilevbare GA, Liu H, Pereira J, Edgar KJ, Taylor LS. Mol Pharm. 2013;10:3392–3403. doi: 10.1021/mp400228x. [DOI] [PubMed] [Google Scholar]
- 27.Purohit HS, Taylor LS. Mol Pharm. 2015;12:1623–1635. doi: 10.1021/acs.molpharmaceut.5b00041. [DOI] [PubMed] [Google Scholar]
- 28.Indulkar AS, Box KJ, Taylor R, Ruiz R, Taylor LS. Mol Pharm. 2015;12:2365–2377. doi: 10.1021/acs.molpharmaceut.5b00056. [DOI] [PubMed] [Google Scholar]
- 29.Almeida e Sousa L, Reutzel-Edens SM, Stephenson GA, Taylor LS. Mol Pharm. 2015;12:484–495. doi: 10.1021/mp500571m. [DOI] [PubMed] [Google Scholar]
- 30.Duan D, Torosyan H, Elnatan D, McLaughlin CK, Logie J, Shoichet MS, et al. ACS Chem Biol. 2017;12:282–290. doi: 10.1021/acschembio.6b00791. [DOI] [PMC free article] [PubMed] [Google Scholar]
- 31.Frenkel YV, Clark AD, Jr, Das K, Wang YH, Lewi PJ, Janssen PA, et al. J Med Chem. 2005;48:1974–1983. doi: 10.1021/jm049439i. [DOI] [PubMed] [Google Scholar]
- 32.Brick MC, Palmer HJ, Whitesides TH. Langmuir. 2003;19:6367–6380. [Google Scholar]
- 33.Indulkar AS, Gao Y, Raina SA, Zhang GG, Taylor LS. Mol Pharm. 2016;13:2059–2069. doi: 10.1021/acs.molpharmaceut.6b00202. [DOI] [PubMed] [Google Scholar]
- 34.Harmon P, Galipeau K, Xu W, Brown C, Wuelfing WP. Mol Pharm. 2016;13:1467–1481. doi: 10.1021/acs.molpharmaceut.5b00863. [DOI] [PubMed] [Google Scholar]
- 35.Indulkar AS, Waters JE, Mo H, Gao Y, Raina SA, Zhang GGZ, et al. J Pharm Sci. 2017;106:1998–2008. doi: 10.1016/j.xphs.2017.04.015. [DOI] [PubMed] [Google Scholar]
- 36.Murdande SB, Pikal MJ, Shanker RM, Bogner RH. J Pharm Sci. 2010;99:1254–1264. doi: 10.1002/jps.21903. [DOI] [PubMed] [Google Scholar]
- 37.Emerson MF, Holtzer A. J Phys Chem. 1967;71:1898–1907. doi: 10.1021/j100865a057. [DOI] [PubMed] [Google Scholar]
- 38.Owen SC, Chan DPY, Shoichet MS. Nano Today. 2012;7:53–65. [Google Scholar]
- 39.Raina SA, Zhang GG, Alonzo DE, Wu J, Zhu D, Catron ND, et al. Pharm Res. 2015;32:3350–3364. doi: 10.1007/s11095-015-1712-4. [DOI] [PubMed] [Google Scholar]
- 40.Feng BY, Shoichet BK. J Med Chem. 2006;49:2151–2154. doi: 10.1021/jm060029z. [DOI] [PMC free article] [PubMed] [Google Scholar]
- 41.Trasi NS, Taylor LS. J Pharm Sci. 2015;104:2583–2593. doi: 10.1002/jps.24528. [DOI] [PubMed] [Google Scholar]
- 42.Trasi NS, Taylor LS. Int J Pharm. 2015;496:282–290. doi: 10.1016/j.ijpharm.2015.10.026. [DOI] [PubMed] [Google Scholar]
- 43.Alhalaweh A, Bergstrom CA, Taylor LS. J Control Release. 2016;229:172–182. doi: 10.1016/j.jconrel.2016.03.028. [DOI] [PubMed] [Google Scholar]
- 44.Raina SA, Alonzo DE, Zhang GG, Gao Y, Taylor LS. Pharm Res. 2015;32:3660–3673. doi: 10.1007/s11095-015-1725-z. [DOI] [PubMed] [Google Scholar]
- 45.Giannetti AM, Koch BD, Browner MF. J Med Chem. 2008;51:574–580. doi: 10.1021/jm700952v. [DOI] [PubMed] [Google Scholar]
- 46.McLaughlin CK, Duan D, Ganesh AN, Torosyan H, Shoichet BK, Shoichet MS. ACS Chem Biol. 2016;11:992–1000. doi: 10.1021/acschembio.5b00806. [DOI] [PMC free article] [PubMed] [Google Scholar]
- 47.Ryan AJ, Gray NM, Lowe PN, Chung CW. J Med Chem. 2003;46:3448–3451. doi: 10.1021/jm0340896. [DOI] [PubMed] [Google Scholar]
- 48.Feng BY, Shoichet BK. Nat Protoc. 2006;1:550–553. doi: 10.1038/nprot.2006.77. [DOI] [PMC free article] [PubMed] [Google Scholar]
- 49.Rausch K, Reuter A, Fischer K, Schmidt M. Biomacromolecules. 2010;11:2836–2839. doi: 10.1021/bm100971q. [DOI] [PubMed] [Google Scholar]
- 50.Ganesh AN, McLaughlin CK, Duan D, Shoichet BK, Shoichet MS. ACS Appl Mater Interfaces. 2017;9:12195–12202. doi: 10.1021/acsami.6b15987. [DOI] [PMC free article] [PubMed] [Google Scholar]
- 51.Wang J, Matayoshi E. Pharm Res. 2012;29:1745–1754. doi: 10.1007/s11095-012-0730-8. [DOI] [PubMed] [Google Scholar]
- 52.Bhattacharjee S. J Control Release. 2016;235:337–351. doi: 10.1016/j.jconrel.2016.06.017. [DOI] [PubMed] [Google Scholar]
- 53.Lindfors L, Skantze P, Skantze U, Westergren J, Olsson U. Langmuir. 2007;23:9866–9874. doi: 10.1021/la700811b. [DOI] [PubMed] [Google Scholar]
- 54.Tres F, Hall SD, Mohutsky MA, Taylor LS. J Pharm Sci. 2018;107:94–102. doi: 10.1016/j.xphs.2017.10.002. [DOI] [PubMed] [Google Scholar]
- 55.Gaudin A, Yemisci M, Eroglu H, Lepetre-Mouelhi S, Turkoglu OF, Donmez-Demir B, et al. Nat Nanotechnol. 2014;9:1054–1062. doi: 10.1038/nnano.2014.274. [DOI] [PMC free article] [PubMed] [Google Scholar]
- 56.LaPlante SR, Aubry N, Bolger G, Bonneau P, Carson R, Coulombe R, et al. J Med Chem. 2013;56:7073–7083. doi: 10.1021/jm4008714. [DOI] [PubMed] [Google Scholar]
- 57.LaPlante SR, Carson R, Gillard J, Aubry N, Coulombe R, Bordeleau S, et al. J Med Chem. 2013;56:5142–5150. doi: 10.1021/jm400535b. [DOI] [PubMed] [Google Scholar]
- 58.Pellecchia M, Sem DS, Wuthrich K. Nat Rev Drug Discov. 2002;1:211–219. doi: 10.1038/nrd748. [DOI] [PubMed] [Google Scholar]
- 59.Ueda K, Higashi K, Moribe K. Mol Pharm. 2017;14:2314–2322. doi: 10.1021/acs.molpharmaceut.7b00178. [DOI] [PubMed] [Google Scholar]
- 60.Raina SA, Van Eerdenbrugh B, Alonzo DE, Mo H, Zhang GGZ, Gao Y, et al. J Pharm Sci. 2015;104:1981–1992. doi: 10.1002/jps.24423. [DOI] [PubMed] [Google Scholar]
- 61.Zhao X, Poon Z, Engler AC, Bonner DK, Hammond PT. Biomacromolecules. 2012;13:1315–1322. doi: 10.1021/bm201873u. [DOI] [PMC free article] [PubMed] [Google Scholar]
- 62.Logie J, Owen SC, McLaughlin CK, Shoichet MS. Chemistry of Materials. 2014;26:2847–2855. [Google Scholar]
- 63.Coan KE, Shoichet BK. Mol Biosyst. 2007;3:208–213. doi: 10.1039/b616314a. [DOI] [PubMed] [Google Scholar]
- 64.Liu HY, Wang Z, Regni C, Zou X, Tipton PA. Biochemistry. 2004;43:8662–8669. doi: 10.1021/bi0491907. [DOI] [PubMed] [Google Scholar]
- 65.Raina SA, Zhang GGZ, Alonzo DE, Wu J, Zhu D, Catron ND, et al. J Pharm Sci. 2014;103:2736–2748. doi: 10.1002/jps.23826. [DOI] [PubMed] [Google Scholar]
- 66.Alexis F, Pridgen E, Molnar LK, Farokhzad OC. Mol Pharm. 2008;5:505–515. doi: 10.1021/mp800051m. [DOI] [PMC free article] [PubMed] [Google Scholar]
- 67.Lesniak A, Fenaroli F, Monopoli MP, Aberg C, Dawson KA, Salvati A. ACS Nano. 2012;6:5845–5857. doi: 10.1021/nn300223w. [DOI] [PubMed] [Google Scholar]
- 68.Walkey CD, Olsen JB, Song F, Liu R, Guo H, Olsen DW, et al. ACS Nano. 2014;8:2439–2455. doi: 10.1021/nn406018q. [DOI] [PubMed] [Google Scholar]
- 69.Doak AK, Wille H, Prusiner SB, Shoichet BK. J Med Chem. 2010;53:4259–4265. doi: 10.1021/jm100254w. [DOI] [PMC free article] [PubMed] [Google Scholar]
- 70.Frenkel YV, Gallicchio E, Das K, Levy RM, Arnold E. J Med Chem. 2009;52:5896–5905. doi: 10.1021/jm900282z. [DOI] [PMC free article] [PubMed] [Google Scholar]
- 71.Clark MA, Jepson MA, Hirst BH. Adv Drug Deliv Rev. 2001;50:81–106. doi: 10.1016/s0169-409x(01)00149-1. [DOI] [PubMed] [Google Scholar]
- 72.Ensign LM, Cone R, Hanes J. Adv Drug Deliv Rev. 2012;64:557–570. doi: 10.1016/j.addr.2011.12.009. [DOI] [PMC free article] [PubMed] [Google Scholar]
- 73.Tadros T. General Principles of Colloid Stability and the Role of Surface Forces, Colloid Stability. Wiley-VCH Verlag GmbH & Co KGaA; 2006. pp. 1–22. [Google Scholar]
- 74.Mullin JW. Crystallization. Elsevier Science; 2001. [Google Scholar]
- 75.Loh ND, Sen S, Bosman M, Tan SF, Zhong J, Nijhuis CA, et al. Nat Chem. 2017;9:77–82. doi: 10.1038/nchem.2618. [DOI] [PubMed] [Google Scholar]
- 76.Vekilov PG. Crystal Growth & Design. 2004;4:671–685. [Google Scholar]
- 77.Baird JA, Santiago-Quinonez D, Rinaldi C, Taylor LS. Pharm Res. 2012;29:271–284. doi: 10.1007/s11095-011-0540-4. [DOI] [PubMed] [Google Scholar]
- 78.Kalra A, Tishmack P, Lubach JW, Munson EJ, Taylor LS, Byrn SR, et al. Mol Pharm. 2017;14:2126–2137. doi: 10.1021/acs.molpharmaceut.7b00245. [DOI] [PubMed] [Google Scholar]
- 79.Baird JA, Van Eerdenbrugh B, Taylor LS. J Pharm Sci. 2010;99:3787–3806. doi: 10.1002/jps.22197. [DOI] [PubMed] [Google Scholar]
- 80.Anton N, Benoit JP, Saulnier P. J Control Release. 2008;128:185–199. doi: 10.1016/j.jconrel.2008.02.007. [DOI] [PubMed] [Google Scholar]
- 81.Jackson MJ, Kestur US, Hussain MA, Taylor LS. Pharm Res. 2016;33:1276–1288. doi: 10.1007/s11095-016-1871-y. [DOI] [PubMed] [Google Scholar]
- 82.Ilevbare GA, Liu HY, Edgar KJ, Taylor LS. Crystal Growth & Design. 2013;13:740–751. [Google Scholar]
- 83.Chen J, Ormes JD, Higgins JD, Taylor LS. Mol Pharm. 2015;12:533–541. doi: 10.1021/mp5006245. [DOI] [PubMed] [Google Scholar]
- 84.Raina SA, Alonzo DE, Zhang GG, Gao Y, Taylor LS. Mol Pharm. 2014;11:3565–3576. doi: 10.1021/mp500333v. [DOI] [PubMed] [Google Scholar]
- 85.Schram CJ, Taylor LS, Beaudoin SP. Langmuir. 2015;31:11279–11287. doi: 10.1021/acs.langmuir.5b02486. [DOI] [PubMed] [Google Scholar]
- 86.Schram CJ, Beaudoin SP, Taylor LS. Crystal Growth & Design. 2016;16:2094–2103. [Google Scholar]
- 87.Rao H, Li Z, Li X, Ma X, Ung C, Li H, et al. J Comput Chem. 2010;31:752–763. doi: 10.1002/jcc.21347. [DOI] [PubMed] [Google Scholar]
- 88.Feng BY, Shelat A, Doman TN, Guy RK, Shoichet BK. Nat Chem Biol. 2005;1:146–148. doi: 10.1038/nchembio718. [DOI] [PubMed] [Google Scholar]
- 89.Irwin JJ, Duan D, Torosyan H, Doak AK, Ziebart KT, Sterling T, et al. J Med Chem. 2015;58:7076–7087. doi: 10.1021/acs.jmedchem.5b01105. [DOI] [PMC free article] [PubMed] [Google Scholar]
- 90.Jackson MJ, Kestur US, Hussain MA, Taylor LS. Mol Pharm. 2016;13:223–231. doi: 10.1021/acs.molpharmaceut.5b00652. [DOI] [PubMed] [Google Scholar]


