Abstract
This paper presents a smartphone app that performs real-time voice activity detection based on convolutional neural network. Real-time implementation issues are discussed showing how the slow inference time associated with convolutional neural networks is addressed. The developed smartphone app is meant to act as a switch for noise reduction in the signal processing pipelines of hearing devices, enabling noise estimation or classification to be conducted in noise-only parts of noisy speech signals. The developed smartphone app is compared with a previously developed voice activity detection app as well as with two highly cited voice activity detection algorithms. The experimental results indicate that the developed app using convolutional neural network outperforms the previously developed smartphone app.
Index Terms: Smartphone app for real-time voice activity detection, convolutional neural network voice activity detector, real-time implementation of convolutional neural network
I. Introduction
Voice activity detectors (VADs) are often used to identify sections or parts of noisy speech signals that contain speech activity. They constitute a key module in many speech processing pipelines, in particular in hearing improvement devices including hearing aids and cochlear implants. VADs have also been used as a switch to enable noise classification/estimation during noise-only portions of noisy speech signals. For example, in [1], a VAD was used for this purpose, see Figure 1, where a noise classification or estimation module was activated by the VAD to adjust the parameters of a noise reduction algorithm depending on the noise class or type. For signal sections or parts where speech in noise or speech+noise was detected, no noise classification/estimation was done and the noise reduction was performed based on the last identified noise type.
Fig. 1.
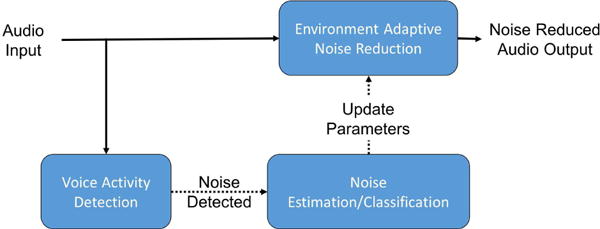
VAD used as a switch to activate noise classification or estimation during noise-only sections of noisy speech signals
Applications of VADs such as the one mentioned above require its operation to be carried out in a real-time and frame-based manner. A real-time VAD was developed in [2] to run on smartphones, where it was shown that the switching done automatically by the VAD matched the switching done manually.
The motivation behind using smartphones as the hardware platform is that the smartphone use is ubiquitous with more than three quarters of people in the US owning smartphones [3]. Smartphones are equipped with powerful ARM multicore processors and they can be easily interfaced with hearing devices wirelessly via low-latency Bluetooth [4] or by wire using headphone cables. Our research group has been working on developing various smartphone apps to enhance the listening experience of hearing device users, e.g. [2], [5], [6].
Traditionally, statistical modelling has been utilized in VADs to separate speech and noise parts or sections in noisy speech signals. The VAD which is specified as a standard by ITU is G.729 Annex B (G729.B) [7]. This VAD uses a fixed decision boundary in a feature space. The features used are line spectral frequencies, full-band energy, low-band energy and zero crossing difference. This VAD is widely used in Voice over Internet Protocol (VoIP) for silence compression. A highly cited VAD is the one developed by Sohn et al. [8], which considers the discrete Fourier transform (DFT) coefficients of noise and speech as independent Gaussian random variables to perform a likelihood ratio test (LRT). In another VAD developed by Gazor and Zhang [9], speech was considered to be a Laplacian random variable. Ramirez et al. in [10] extended the work in [8] and incorporated multiple observations from the past and future frames and named it multiple observations likelihood ratio test (MO-LRT). The VAD approach developed by Shin et al. in [11] showed that modelling the DFT coefficients as a generalized Gamma distribution (GΓD) provided more accuracy than the previously developed approaches.
Apart from the statistical modelling approaches noted above, more recently VAD approaches have been developed using machine learning techniques. Some examples of these approaches are mentioned here. Enqing et al. [12] used the same features in G729.B together with a support vector machine (SVM) classifier. Ramirez et al. [13] used long-term signal-to-noise ratio (SNR) and subband SNR features together with a SVM classifier. Jo et al. [14] used the likelihood ratios from a statistical model together with a SVM classifier. Saki and Kehtarnavaz [1] developed a VAD using subband features together with a random forest (RF) classifier. VADs using deep neural networks have also appeared in the literature. For example, Zhang and Wu [15] used a collection of features including pitch, DFT, mel-frequency cepstral coefficients (MFCC), linear predictive coding (LPC), relative-spectral perceptual linear predictive analysis (RASTA-PLP) and amplitude modulation spectrograms (AMS) together with a deep belief neural network. Hughes and Mierle [16] considered 13-dimensional perceptual linear prediction (PLP) features together with a recurrent neural network (RNN). Thomas et al. [17] used log-mel spectrogram with its delta and acceleration coefficients together with a convolutional neural network (CNN). In [18], Obuchi applied an augmented statistical noise suppression (ASNS) before voice activity detection to boost the accuracy of VAD. In this VAD, feature vectors consisting of log mel filterbank energies were fed into a decision tree (DT), a SVM and a CNN classifier.
As far as real-time VADs are concerned, in [19], Lezzoum et al. utilized normalized energy features along with a thresholding technique. The real-time VAD developed by Sehgal et al. in [2] was implemented to run on smartphones as an app using the features developed in [1].
Although many VADs have been reported in the literature, the real-time implementation aspects such as computational efficiency, frame processing rate, accuracy in the field or realistic scenarios are often not adequately addressed. Deep learning approaches have shown that voice activity detection can be performed more effectively. However, such approaches have very long inference times creating hindrance in their utilization in a real-time frame-based speech processing pipeline. This is mainly due to the fact that neural network architectures are normally defined to be as large and as deep as possible without taking into consideration real-time limitations in practice. The main contribution made in this paper lies in the development of a practical CNN architecture for voice activity detection to enable its real-time operation as an app running on smartphone platforms.
II. Implemented VAD Algorithm
This section discusses the features and classification used in the implemented VAD algorithm.
A. LOG-MEL Filterbank Energy Features
The input to the CNN are considered to be the log-mel filterbank energy images, similar to the ones utilized in [18]. The reasoning for choosing this feature is stated below.
In [20], it was shown that representing audio as images using mel-scaled short time Fourier transform (STFT) spectrograms consistently performed better than linear-scaled STFT spectrograms, constant-Q transform (CQT) spectrogram, continuous Wavelet transform (CWT) scalogram and MFCC cepstrogram as inputs to CNNs for audio classification tasks, especially when used with a two-dimensional CNN classifier. In addition, in [18] it was shown that using the log-mel filterbank energy extracted from the mel-scaled STFT spectrogram performed better when using CNN as compared to other classifiers. Furthermore, and more importantly, the feature log-mel filterbank energy used here is computationally more efficient for real-time implementation than CQT spectrogram, CWT scalogram and MFCC cepstrogram. Also, the log-mel filterbank energy feature possesses fewer coefficients per frame compared to linear-scaled STFT spectrogram and mel-scaled STFT spectrogram, leading to a reduced inference time and smaller CNN architecture.
A log-mel energy spectrum represents the short-term power of an audio signal in the mel-frequency scale [21] over some time duration. The log-mel energy spectrum is made up of mel-frequency spectral coefficients (MFSC). These coefficients are similar to MFCC noting that MFCC are obtained by taking the DCT of MFSC.
The mel scale of frequencies denotes a perceptual scale of frequencies which are subjectively judged to be equal in distance to one another in terms of hearing sensation. The function B for computing mth mel-frequency from frequency f in Hertz and its inverse B−1 are given by [21]:
| (1) |
| (2) |
To compute the MFSC of an audio signal, the signal is first divided into short frames of duration 20-40 ms. It is observed that shorter frames do not provide enough data samples for an accurate spectral estimate, and longer frames do not account for possible frequent signal changes within a frame. Frames are overlapped and a weighted window (e.g., Hanning) is applied to reduce artifacts that occur in the DFT computation due to rectangular windowing. As lower weights are allocated to the samples at the beginning and end of a frame, overlapping is done to capture the effect of these samples in a prior and in a post frame. After collecting and windowing an audio frame, its Fourier transform is computed via the Fast Fourier Transform (FFT) algorithm. Since the FFT is mirrored in time, only the first half of the FFT is used.
A triangular overlapping filterbank consisting of N triangular filters is considered to compute MFSC. A lower frequency and a higher frequency are specified to limit the spectrogram within a range of frequencies. Ideally, a value of 300 Hz is used for the lower frequency and 8000 Hz is used for the higher frequency for speech signals with the sampling frequency being greater than 16000 Hz. Next, N + 2 equally spaced frequencies in the mel-domain between the lower and higher frequencies are obtained. These edge frequencies are then converted to the frequency domain and their values in terms of the FFT bin number are found via multiplication with the number of FFT bins (K) and division by the sampling frequency (fs). The mel spaced filterbank is then created as follows:
| (3) |
| (4) |
where H denotes the amplitude of the nth filter at frequency bin k, and is the collection of N + 2 edge frequency bin values of the filters spaced equally in the mel domain. Figure 2 exhibits the relationship between the edge frequencies in the frequency and mel domains and Figure 3 illustrates the triangular filters of the filterbank as observed in the frequency domain.
Fig. 2.
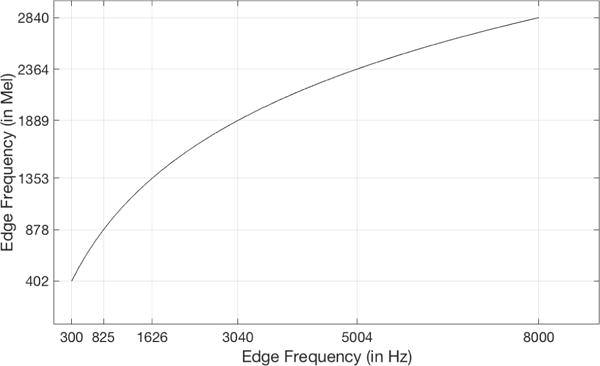
Graph displaying the relationship between edge frequencies in the frequency and mel domains; lower frequencies are spaced closer than higher frequencies in the frequency domain, whereas they are equally spaced in the mel domain. The lower frequency is 300 Hz and the higher frequency is 8000 Hz, and the sampling frequency is 16000 Hz for the construction of the filterbank.
Fig. 3.
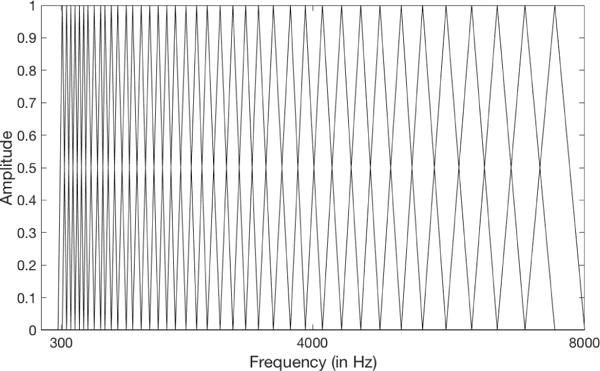
This figure exhibits the mel filterbank consisting of 40 overlapping triangular filters. The filters are spaced non-linearly in the frequency domain, with the filter width smaller in the lower frequencies and broader in higher frequencies. These filters are equally spaced in the mel domain.
The filterbank is then multiplied with the power spectrum estimate of the FFT. The product of each individual filter is summed and the log of each sum is taken to compute MFSC, as indicated in the following equation:
| (5) |
After finding N MFSC coefficients, they are concatenated to create an N × B image, where B represents the number of frames considered in the spectrum. This image is called the log-mel energy spectrum which is then fed into the CNN discussed in the next subsection. All the steps taken to obtain the log-mel energy spectrum are shown in Figure 4.
Fig. 4.

Illustration of the image formation module of the developed VAD app: The frames shown are collected with 50% overlap followed by the MFSC feature extraction. The extracted MFSC features are concatenated to form a log-mel energy spectrum image.
As shown in Figure 5, the use of log-mel energy spectrum images as input to the CNN allows the sections or parts of a noisy speech signal with speech content to be distinguishable from the sections or parts without the speech content or with pure noise. The sections of the log-mel energy spectrum appearing in red/yellow color show the presence of speech and the rest of the image appearing in green/blue color as background noise. The CNN discussed next has the capability to exploit these differences to classify a frame as pure noise or speech in noise.
Fig. 5.
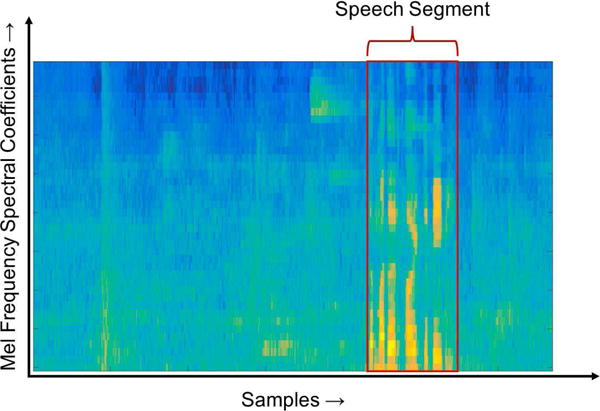
A labelled log-mel energy spectrum image showing a part or section containing speech in an audio file. The CNN is trained to classify such sections as speech in noise to prevent the noise classifier or estimator to execute during such sections.
B. Convolutional Neural Network Classification
The classification or decision is done by using Convolutional Neural Network (CNN). CNNs were introduced by Lecun et al. [22] for document recognition and have recently come into wide spread utilization. They have been applied to various speech processing applications such as speech recognition and VAD [17], [18], [23]. These neural networks process matrices as inputs, predominantly images, with their hidden layers performing convolution and pooling functions together with a fully-connected layer similar to a conventional backpropagation neural network. The convolution layers are capable of extracting local information from the input image/matrix via the weighted learnable kernels with nonlinear activations. These kernels are replicated over the entire input space. After every forward pass, each convolution layer generates a feature map. The convolution layers are trained to activate the feature maps when patterns of interest are observed in the input. These activated feature maps are sub-sampled to reduce their resolution using max-pooling or convolution with longer strides, and then fed into the next convolution layer. Fully connected layers are utilized to combine the output of the final convolution layer and thus to classify the overall input using a non-linear output layer. The output layer in our case is considered to be a softmax layer reflecting the probabilities associated with the two classes corresponding to pure noise or noise-only and speech+noise or speech in noise.
Figure 6 provides an illustration of how the CNN is structured for the VAD. A N × B log-mel energy spectrum image is used as the input. Normally B is considered to be greater than N for capturing temporal detail. However, in our case, in order to gain computational efficiency and allow frame-based classification, B is considered to be equal to N, that is a square log-mel energy spectrum image. The kernels of the convolutional neural network extract local features of the log-mel energy spectrum image, thereby examining local patterns in both time and frequency. This is different than traditional VADs that examine the spectrum in its entirety. This locality approach allows the CNN to focus on cleaner parts of the spectrum for speech presence and compensate for parts of the spectrum that may contain ambient noises. Also, the kernels can map the local temporal structure of the utterances, generating more effective temporal behavior mapping compared to other VADs.
Fig. 6.
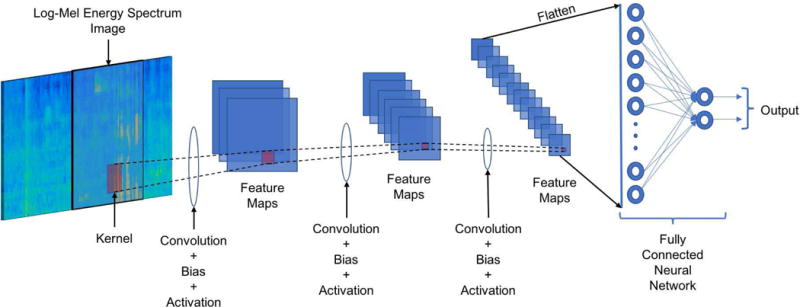
Illustration of the developed CNN-based VAD: The log-mel energy spectrum image is fed into the CNN convolution layers. The output of the final convolution layer is flattened into a vector and fed into a fully connected layer. Finally, the output of the fully connected layer is fed into a softmax layer.
To gain computational efficiency, the pooling layer is not used and instead the convolution layers are arranged in strides of 2 to reduce image sizes. When using strides of more than 2, there is a noticeable loss of accuracy. This reduces the computation time for the convolution layer and removes the computation time for the pooling layer. For gaining further computational efficiency, only a single channel image is used here and the delta and acceleration features are not used.
The activation function used is the ReLU activation function defined as:
| (6) |
where x denotes the input to the activation layer. The ReLU activation layer has an output of 0 if x is less than 0, and its output is equal to the input if x is positive.
III. Real-Time Implementation
This section discusses the major implementation steps taken in order to run the developed CNN-based VAD algorithm in real-time as an app on smartphone/tablet platforms.
A. Software Tools Utilized
The CNN VAD algorithm including input image formation and labelling was first implemented in MATLAB. The input images were used to perform the CNN training in an offline manner using the software tool Tensorflow in Python [24]. The reason for using Tensorflow was that this tool has a C++ API that can be used on smartphones to run the inference-only part of the CNN. The offline trained CNN with the trained weights was then taken as an inference-only structure by removing the backpropagation, training and dropout layers so that it could be used for real-time operation or testing on smartphone platforms.
The image formation or feature extraction module for the CNN-based VAD was then coded in C to generate a smartphone app by using the software shells developed in [25]. For deployment on the iOS mobile devices, the GUI was coded in Swift and the audio input/output (i/o) was coded in Objective-C using the software package Core Audio [26]. For Android smartphones, the GUI was coded in Java and the audio i/o was done using the software package Superpowered APK [27].
B. Low-Latency
There exists some latency associated with any frame-based audio processing app. This latency is due to the time it takes for the input hardware to collect audio samples required to fill an audio frame and output that frame through the i/o hardware. This latency is dependent on the smartphone i/o hardware and exists even in the absence of any processing. For real-time audio applications, if the time delay between input and output audio frame gets greater than 15 ms, it becomes noticeable and if it is greater than 30 ms, it can create a hindrance in maintaining a conversation.
To implement the lowest latency audio setup on iOS smartphones, it is required to read and write audio data samples at a sampling rate of 48 kHz with a buffer size of 64 samples or 1.34 ms. These constraints are met here by creating independent synchronous callbacks for reading and writing or outputting audio frames. As these constraints are not optimal for the developed VAD, an audio optimization technique is thus designed to run the VAD at its optimal parameters while maintaining these lowest latency constraints. The same approach is followed for Android smartphones noting that the i/o frame size varies from Android device to Android device due to different manufacturers. For example, for the Google Pixel Android smartphone, the smallest frame size to have the lowest latency is 192 samples or 4 ms at 48 kHz.
C. VAD Audio Processing Setup
The optimal parameters for the VAD constitute 16 kHz sampling frequency with a processing frame size of 400 samples or 25 ms with 50% overlap. As there is a mismatch between the lowest latency i/o parameters and the VAD feature extraction parameters, one needs to synchronize the two events. Figure 7 shows the steps taken to achieve this synchronization in a frame-based manner while maintaining the lowest latency. The steps explained in this subsection arewith respect to iOS smartphones noting that the same steps are applicable to Android smartphones as well.
Fig. 7.
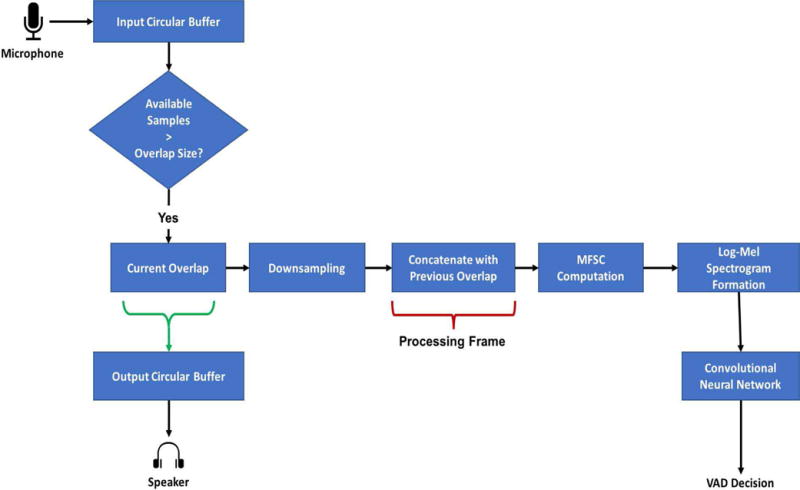
Real-time processing modules used in the developed CNN-based VAD app. Circular buffers are used to synchronize the VAD processing with the smartphone audio i/o hardware.
The audio is read from the microphone at a rate of 64 samples with a sampling frequency of 48 kHz. A circular buffer as discussed in [28] is used to collect audio samples till the required overlap size of 600 samples or 12.5 ms is reached, which is the size corresponding to 50% overlap of the processing frame. Frames are downsampled by passing them through a bandlimit lowpass filter that filters all frequency components above 8 kHz. A decimation in time is then carried out by selecting every 3rd sample from the bandlimited samples. This produces frames of 200 samples at 16 kHz, which is still 12.5 ms in time. An overlapped frame is concatenated with a previous overlapped frame to form a processing frame of 25 ms or 400 samples. The reason for doing this lies in the fact that the MFSC are extracted between 300 Hz to 8 kHz since most of the speech frequency content lies in this range.
Another reason for using the above approach is to save the FFT computation time. If audio samples are not downsampled, the FFT for the processing frame size of 1200 samples needs to be computed for a resolution of 2048 frequency bins with the Nyquist frequency of 24 kHz. As only the audio samples corresponding to 300 Hz to 8 kHz are needed, two-thirds of the FFT are not used, thus making the computation inefficient. If the number of FFT bins is increased, the computation time increases even further. In comparison, when the audio samples are downsampled to 16 kHz followed by the FFT, the 512 frequency bins are more than adequate for a processing frame size of 400 samples. As the Nyquist frequency is 8 kHz, a very small portion of the FFT is thrown away for the feature extraction and the frequency resolution becomes much higher than before.
D. CNN Architecture
To run the developed VAD app in real-time, the input images have to be extracted on a frame-by-frame basis but the classification is not required to be done per frame basis. Hence, a multi-threaded approach is used here for the classification. The CNN is run on a parallel synchronous thread and the image formation is done on the main audio i/o thread. This saves computation time in the main audio i/o thread for other processing modules to be executed in a speech processing pipeline.
The CNN architecture considered does not use pooling to reduce the image size. The convolution is done with a stride of 2 to reduce the amount of computation. The CNN architecture utilized is given in Table I.
TABLE I.
CNN ARCHITECTURE FOR VAD
| Layer | Number of Kernels/Nodes | Kernel Width |
|---|---|---|
| Convolution × 3 | 40-20-10 | 5 × 5 |
| Fully Connected | 100 | – |
| Softmax | 2 | – |
To train the CNN model, the Adam optimization algorithm [29] was used with cross-entropy as the loss. For a binary classification task, cross-entropy loss is computed as follows:
| (7) |
where y denotes the true binary prediction, which is set as 0 for “noise only” frames and 1 for “speech+noise” frames, and p is the output of the CNN reflecting the probability of occurrence of “speech+noise”.
The weights and biases for all the nodes and kernels were initialized with a truncated normal distribution with zero mean and a standard deviation of 0.05. As discussed in [30], a dropout of 25% was used with the fully connected layer to prevent over-fitting. The model was trained for 12 epochs, with 975 iterations per epoch. The learning rates were gradually decreased for the first 6 training epochs with a learning rate of 10−3, the next 4 epochs with a learning rate of 10−4, and the final 2 epochs with a learning rate of 10−5. A 10-fold non-overlapping cross-validation scheme was used for training with a single fold left-out for testing and the rest used for training.
IV. Experimental Results and Discussion
A. Offline Evaluation
To train and evaluate the developed CNN VAD, speech files were degraded with noise at different sNR levels to create a noisy speech dataset. The speech corpus used for evaluation was the PN/NC version 1.0 corpus [31]. This corpus consists of 20 speakers (10 male, 10 female) from two American English dialect regions (Pacific Northwest and Northern Cities) reciting 180 IEEE “Harvard” set sentences. In total, it consists of 3600 audio files. The noise dataset used was the DCASE 2017 challenge dataset [32] that consists of 15 different background noise environments. All the speech sentences were used for the evaluation.
Log-mel filterbank energy images were extracted and used for the CNN VAD and subband features were extracted and used for the RF VAD. Both classifiers were evaluated using a 10-fold cross-validation scheme. The images were extracted for a frame size of 25 ms with 50% overlap at a sampling frequency of 16 kHz. For the log-mel energy spectrum, the low frequency was taken to be 300 Hz and the high frequency was taken to be 8 kHz, the number of filters was set to 40 and the size of the FFT to 512 bins. The log-mel energy spectrum images were extracted every 62.5 ms and the probability output of the CNN VAD was averaged over the current and previous extracted images. The subband features were extracted with 8 subbands and with a 512 size FFT. A median smoothing filter was applied to about 20 frames to stabilize the decision output of the VAD.
In addition to the above two VADs, G729B and Sohn’s VADs were also evaluated on the same dataset using the codes for G729B provided at [33] and for Sohn’s VAD provided at [34]. These codes were run for the parameters specified in the codes.
The criteria used to evaluate the VADs was Speech Hit Rate (SHR), that is the number of speech frames correctly classified as speech, and Noise Hit Rate (NHR), that is the number of noise frames correctly classified as noise. For the speech processing pipeline of interest to us, it is critical to get both SHR and NHR high because a low NHR would mean an inaccurate estimation or classification of noise and a low SHR would mean that the speech is also used to estimate or classify the noise, leading to erroneous outcome.
Tables II and III show the comparison between the NHR and SHR of the four VADs examined, respectively. For the CNN and RF VAD, the accuracy provided denotes the average of the accuracy of the 10-fold cross-validation. As can be seen from these tables, the NHR of the statistical VADs (G729B and Sohn) was found to be low when compared to the machine learning VADs. The SHR of the VADs was found to be high, however, the CNN VAD performed better than the other VADs. The statistical VADs exhibited a bias towards speech classification and tended to label sections of noise as speech leading to their inflated SHR rates.
TABLE II.
Offline Average NHR (Noise hit Rate) in %
| G729B | Sohn | Random Forest | CNN | |
|---|---|---|---|---|
| NHR | 39.3 | 69 | 97.4 | 99.3 |
TABLE III.
Offline Average SHR (Speech Hit Rate) in %
| SNR (dB) |
G729B | Sohn | Random Forest | CNN |
|---|---|---|---|---|
| 10 | 88.8 | 83.9 | 85.6 | 94.8 |
| 5 | 85.4 | 79.8 | 78.9 | 92.8 |
| 0 | 81.8 | 73.5 | 66.7 | 90.0 |
Figure 8 shows the accuracy of the VADs in terms of NHR and SHR in different noise environments. As can be observed from this figure, the CNN VAD generated both high SHRs and high NHRs. The RF VAD generated a low SHR for 0 dB SNR and the statistical VADs generated low NHRs and inflated SHRs.
Fig. 8.
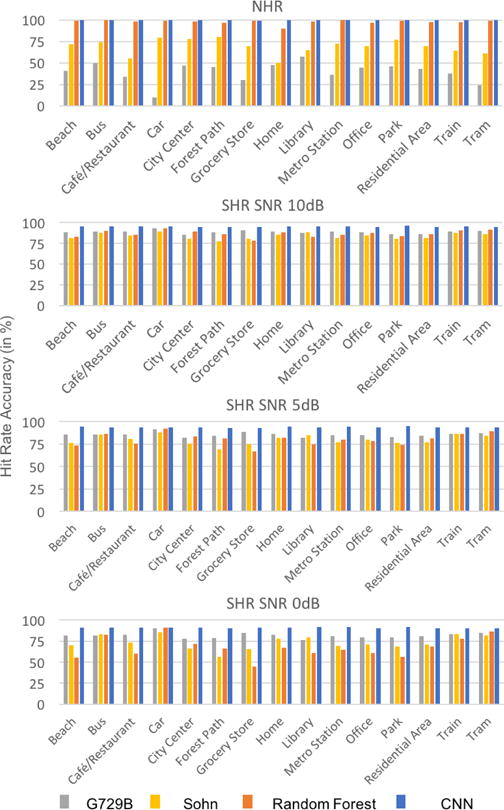
SHR and NHR comparison for the four VADs in different noise environments
B. Real-Time Testing
To evaluate the real-time operation of the CNN VAD app, 40 sentences were considered in a crowded noise environment scenario with 1 female and 3 male subjects each reciting 10 totally different sentences. The outcomes of the CNN VAD app were stored to compare to the ground truth, which had been manually labelled offline. The VADs had not been trained on either the environment or the subjects before. The audio was collected on the smartphone to evaluate the other 3 VADs as well. The audio files varied in SNR from 7 dB to 15 dB.
Table IV shows the NHR and the SHR of the 4 VADs for the real-time collected data files. As noted in this table, the NHR of G729B and Sohn VADs were found to be low, which led to inflated SHRs due to their bias towards speech. The RF VAD and the CNN VAD were found to have high NHRs but the CNN VAD outperformed the RF VAD in terms of SHRs. In addition, the RF VAD exhibited a delayed response due to the median filter decision post processing. Figure 9 shows an example speech sentence from a real-time scenario and the outputs of the VADs. This figure shows that G729B and Sohn’s VAD labeled many noise portions as speech. The Random Forest VAD decision was normally delayed after the speech was started. This would lead led to noise estimation errors in noise reduction or speech recognition tasks. This delay was not present in the CNN VAD.
TABLE IV.
REAL-TIME AVERAGE SHR AND NHR IN %
| G729B | Sohn | Random Forest | CNN | |
|---|---|---|---|---|
| NHR | 63.6 | 27.9 | 98.9 | 99 |
| SHR | 86.9 | 97.3 | 86.4 | 91.3 |
Fig. 9.
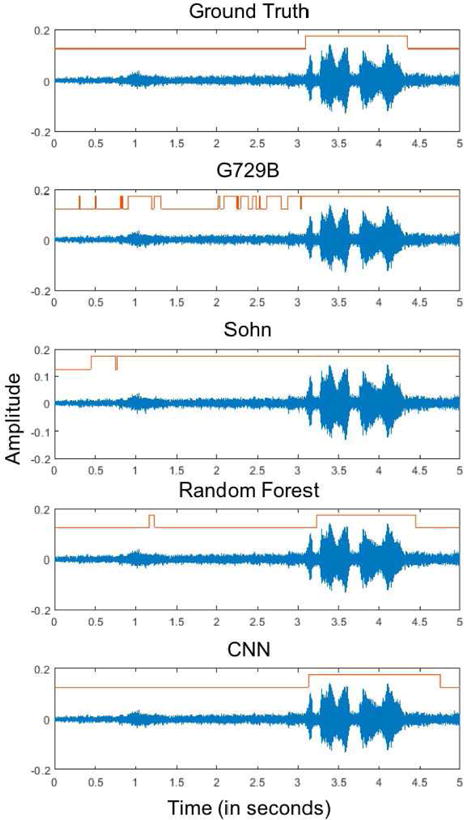
Example waveforms of a real-time speech signal in noisy background together with the VAD output shown in the form of binary signals indicating the presence and absence of speech activity.
V. Real-Time Charecteristics
This subsection provides the real-time running characteristics of the developed CNN VAD app. To test the app, an iPhone 7 iOS smartphone and a Google Pixel Android smartphone were used. The audio latency for these devices was measured to be 13-15 ms for iPhone 7 and 38-40 ms for Google Pixel. ideally for a real-time frame-based audio processing app to run smoothly at the lowest hardware permissible audio latency without any frames getting skipped, all processing should take place within the time frame of the audio i/o frame, that is within 64 samples or approximately 1.3 ms for iOS smartphones. This timing varies for Android smartphones depending on their audio i/o frame size corresponding to the lowest audio latency. For the Google Pixel Android smartphone used, it is 192 samples or 4 ms.
To implement the real-time VAD app, two optimization steps were taken. Firstly, the GCC compiler optimization level was set to level 2 (−O2). The processing time per frame without optimization was 0.72 ms and with optimization was 0.43 ms for iPhone 7. For Google Pixel, the frame time with optimization was 1.7 ms. Secondly, the CNN was run on a parallel synchronous thread as it was not necessary to run it on the main audio thread. Since the VAD decision was designed to run every 5 frames, a timed thread was executed periodically every 62.5 ms which handled the CNN computations. This approach provides extra computation time on the main audio thread to run other audio processing modules. Figure 10 shows the frame processing time per frame with and without multithreading for iPhone 7. As seen from this figure, without multithreading, the frame processing time crossed 1.3 ms which caused frames to get skipped, whereas with multithreading the timings remained within the permissible range.
Fig. 10.
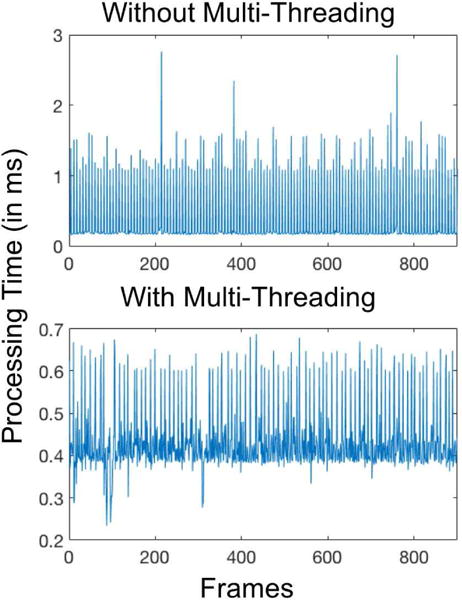
Frame processing time with and without multi-threading on iPhone 7 showing that multi-threading enables processing times to remain within the permissible 1.3 ms real-time processing.
The CPU, memory and battery usage of the app is also shown in Figure 11 for the iOS and Android smartphones used. The CPU consumption of the iOS version of the app are quite low compared to the Android version as the Tensorflow API on Android runs in Java causing more CPU consumption. Although both the iOS and Android versions of the app exhibit low memory consumption, the memory consumption is lower for the Android version than the iOS version because the GUI elements in iOS are written in Swift which occupy more memory than the ones written in Java for the Android version. The memory consumption of the iOS version without starting the app is 17.5 MB and after starting the app is 20.8 MB, which means the actual memory footprint of the algorithm is only 3.3 MB in iOS. This shows that the app does not crowd the CPU and the memory resources of smartphones.
Fig. 11.
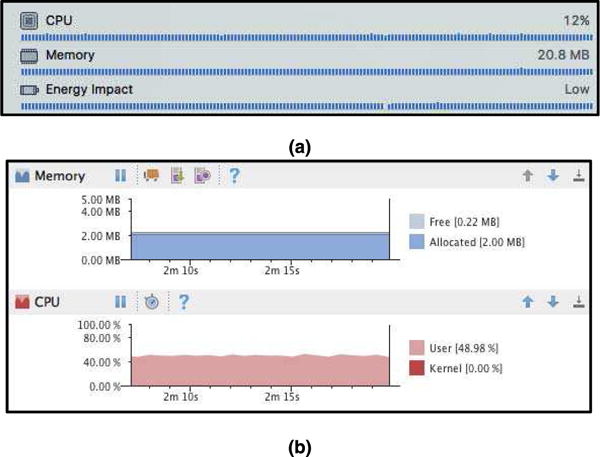
CPU and memory consumption for (a) iOS and (b) Android versions of the app.
The GUI of the app is displayed in Figure 12 for both the iOS and Android versions. The GUI consists of buttons to start and stop the app, a switch to store the audio signal from the smartphone microphone, a display of the CNN classification outcome, and a slider to update the GUI display rate.
Fig. 12.
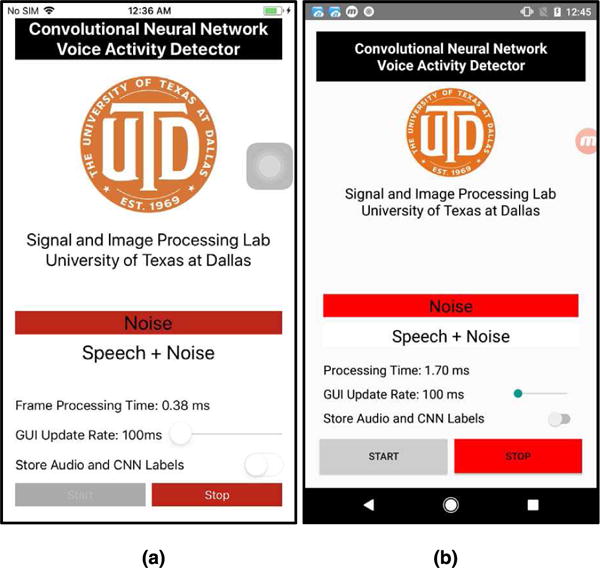
GUIs of (a) iOS and (b) Android versions of the app.
A video clip of the developed CNN VAD app running in real-time can be viewed at this link: www.utdallas.edu/~kehtar/CNN-VAD.mp4.
VI. Conclusion
This paper has provided a convolutional neural network smartphone app to perform voice activity detection in real-time with low audio latency. The app has been developed for both Android and iOS smartphones. The architecture of the convolutional neural network has been optimized to allow audio frames to be processed in real-time without any frames getting skipped while maintaining high accuracy of voice activity detection. Multi-threading has been utilized which makes the app to run in parallel to the main audio path thus providing a computationally efficient framework for running other signal processing modules in real-time. The results obtained indicate that the developed app based on convolutional neural network outperforms the previously developed app based on random forest.
Acknowledgments
This work was supported by the National Institute of the Deafness and Other Communication Disorders (NIDCD) of the National Institutes of Health (NIH) under the award number 1R01DC015430-01. The content is solely the responsibility of the authors and does not necessarily represent the official views of the NIH.
Biographies

ABHISHEK SEHGAL (S’15) received the B.E. degree in Instrumentation Technology from Visves-varaya Technological University, Belgaum, India, in 2012 and the MS degree in Electrical Engineering from the University of Texas at Dallas, Richardson, TX, in 2015. He is currently pursuing the Ph.D. degree in the Department of Electrical and Computer Engineering at the University of Texas at Dallas, Richardson, TX. His research interests include real-time signal processing, pattern recognition and machine learning.
NASSER KEHTARNAVAZ (S’82-M’86-SM’92-F’12) is an Erik Jonsson Distinguished Professor in the Department of Electrical and Computer Engineering and the Director of Signal and Image Processing Laboratory at the University of Texas at Dallas, Richardson, TX. His research interests include signal and image processing, machine learning, and real-time implementation on embedded processors. He has authored or co-authored 10 books and more than 360 journal papers, conference papers, patents, manuals, and editorials in these areas. He is a Fellow of IEEE, a Fellow of SPIE, a licensed Professional Engineer, and Editor-in-Chief of Journal of Real-Time Image Processing.
References
- 1.Saki F, Kehtarnavaz N. Automatic switching between noise classification and speech enhancement for hearing aid devices. Proceedings of the IEEE International Engineering in Medicine and Biology Conference (EMBC) 2016:736–739. doi: 10.1109/EMBC.2016.7590807. [DOI] [PubMed] [Google Scholar]
- 2.Sehgal A, Saki F, Kehtarnavaz N. Real-time implementation of voice activity detector on ARM embedded processor of smartphones. Proceedings of the IEEE International Symposium on Industrial Electronics (ISIE) 2017:1285–1290. [Google Scholar]
- 3.Pew Research Center. Demographics of Mobile Device Ownership and Adoption in the United States. Pew Research Centre. 2017 [Online]. Available: http://www.pewinternet.org/fact-sheet/mobile/
- 4.Apple. Hearing Accessibility - iPhone - Apple. 2017 [Online]. Available: https://www.apple.com/accessibility/iphone/hearing/
- 5.Saki F, Sehgal A, Panahi I, Kehtarnavaz N. Smartphone-based real-time classification of noise signals using subband features and random forest classifier. Proceedings of the IEEE International Conference on Acoustics, Speech and Signal Processing (ICASSP) 2016:2204–2208. [Google Scholar]
- 6.Bhattacharya A, Sehgal A, Kehtarnavaz N. Low-latency smartphone app for real-time noise reduction of noisy speech signals. Proceedings of the IEEE International Symposium on Industrial Electronics (ISIE) 2017:1280–1284. [Google Scholar]
- 7.Telecommunication Standardization Sector Of ITU. ITU-T Recommendation database. Recommendation ITU-T Y.2060. 2012 [Online]. Available: http://www.itu.int/ITU-T/recommendations/rec.aspx?rec=3946.
- 8.Sohn J, Kim NS, Sung W. A statistical model-based voice activity detection. IEEE Signal Processing Letters. 1999 Jan;6(1):1–3. [Google Scholar]
- 9.Gazor S, Zhang W. A soft voice activity detector based on a laplacian-gaussian model. IEEE Transactions on Speech and Audio Processing. 2003 Sep;11(5):498–505. [Google Scholar]
- 10.Ramirez J, Segura JC, Benitez C, Garcia L, Rubio A. Statistical voice activity detection using a multiple observation likelihood ratio test. IEEE Signal Processing Letters. 2005 Oct;12(10):689–692. [Google Scholar]
- 11.Shin JW, Chang JH, Barbara S, Yun HS, Kim NS. Voice Activity Detection based on Generalized Gamma Distribution. Proceedings of the IEEE International Conference on Acoustics, Speech and Signal Processing (ICASSP) 2005:781–784. [Google Scholar]
- 12.Enqing D, Guizhong L, Yatong Z, Xiaodi Z. Applying support vector machines to voice activity detection. Proceedings of the IEEE International Conference on Signal Processing. 2002:1124–1127. [Google Scholar]
- 13.Ramirez J, Yelamos P, Gorriz JM, Segura JC, Garcia L. Speech / Non-Speech discrimination combining advanced feature extraction and SVM learning. Proceedings of Interspeech. 2006 [Google Scholar]
- 14.Jo QH, Chang JH, Shin JW, Kim NS. Statistical model-based voice activity detection using support vector machine. IET Signal Processing. 2009 May;3(3):205–210. [Google Scholar]
- 15.Zhang X, Wu J. Deep Belief Networks Based Voice Activity Detection. IEEE Transactions on Audio, Speech and Language Processing. 2013 Apr;21(4):697–710. [Google Scholar]
- 16.Hughes T, Mierle K. Recurrent Neural Networks for Voice Activity Detection. Proceedings of the IEEE International Conference on Acoustics, Speech and Signal Processing (ICASSP) 2013:7378–7382. [Google Scholar]
- 17.Thomas S, Ganapathy S, Saon G, Soltau H. Analyzing convolutional neural networks for speech activity detection in mismatched acoustic conditions. Proceedings of the IEEE International Conference on Acoustics, Speech and Signal Processing (ICASSP) 2014:2519–2523. [Google Scholar]
- 18.Obuchi Y. Framewise speech-nonspeech classification by neural networks for voice activity detection with statistical noise suppression. Proceedings of the IEEE International Conference on Acoustics, Speech and Signal Processing (ICASSP) 2016:5715–5719. [Google Scholar]
- 19.Lezzoum N, Gagnon G, Voix J. Voice activity detection system for smart earphones. IEEE Transactions on Consumer Electronics. 2014 Nov;60(4):737–744. [Google Scholar]
- 20.Huzaifah M. Comparison of Time-Frequency Representations for Environmental Sound Classification using Convolutional Neural Networks. arXiv:1706.07156. 2017 Jun; cs CV. [Google Scholar]
- 21.Stevens SS, Volkmann J, Newman EB. A Scale for the Measurement of the Psychological Magnitude Pitch. Journal of the Acoustical Society of America. 1937 Jan;8(3):185–190. [Google Scholar]
- 22.Lecun Y, Bottou L, Bengio Y, Haffner P. Gradient-based learning applied to document recognition. Proceedings of the IEEE. 1998 Nov;86(11):2278–2324. [Google Scholar]
- 23.Deng L, Hinton G, Kingsbury B. New types of deep neural network learning for speech recognition and related applications: an overview. Proceedings of the IEEE International Conference on Acoustics, Speech and Signal Processing (ICASSP) 2013:8599–8603. [Google Scholar]
- 24.Google. TensorFlow. 2017 [Online]. Available: https://www.tensorflow.org/
- 25.Kehtarnavaz N, Parris S, Sehgal A. Smartphone-Based Real-Time Digital Signal Processing, Morgan and Claypool Publishers. 2015 [Online]. Available: http://www.morganclaypool.com/doi/abs/10.2200/S00666ED1V01Y201508SPR013.
- 26.Apple. Core Audio | Apple Developer Documentation. 2017 [Online]. Available: https://developer.apple.com/documentation/coreaudio.
- 27.Superpowered. iOS, OSX and Android Audio SDK, Low Latency, Cross Platform, Free. [Online] Available: http://superpowered.com/
- 28.Tyson M. TPCircularBuffer. 2017 [Online]. Available: https://github.com/michaeltyson/TPCircularBuffer.
- 29.Kingma DP, Ba J. Adam: A Method for Stochastic Optimization. arXiv:1412.6980. 2014 Dec; cs LG. [Google Scholar]
- 30.Srivastava N, Hinton G, Krizhevsky A, Sutskever I, Salakhutdinov R. Dropout: A Simple Way to Prevent Neural Networks from Overfitting. Journal of Machine Learning Research. 2014 Jun;15:1929–1958. [Google Scholar]
- 31.McCloy DR, Souza PE, Wright RA, Haywood J, Gehani N, Rudolph S. The PN/NC corpus Version 1.0. 2013 [Online]. Available: https://depts.washington.edu/phonlab/resources/pnnc/pnnc1/
- 32.Mesaros A, Heittola T, Virtanen T. TUT Acoustic Scenes 2017, Development Dataset. 01-Jan-2017. [Online]. Available: https://zenodo.org/record/400515.
- 33.Mathworks. G.729 Voice Activity Detection - MATLAB & Simulink. 2017 [Online]. Available: https://www.mathworks.com/help/dsp/examples/g-729-voice-activity-detection.html.
- 34.Brookes M. VOICEBOX. [Online] Available: http://www.ee.ic.ac.uk/hp/staff/dmb/voicebox/voicebox.html.


