Abstract
In recent years, photoacoustic tomography (PAT) is increasingly used in biomedical research, as it allows for direct visualization of optical absorption in deep tissue. In addition to vascular and hemodynamic imaging using endogenous contrasts, PAT is also capable of imaging neural and molecular dynamics with extrinsic contrasts. While near-infrared (NIR)-absorbing contrasts are preferred for deep tissue imaging, compared to visible-light-absorbing contrasts, they are much harder to design and synthesize with good environmental stability. We introduce here a new PAT mode which utilizes nonlinear multiphoton upconversion of NIR light in situ to visible light, thus exciting locally a dye that can generate strong photoacoustic signal. This approach allows to take advantage of a large library of visible-light-absorbing dyes that can enable functional imaging, such as imaging of voltage, oxygen, pH, and ion channel activities. Two types of upconversion materials are utilized in this work: 1) a two-photon absorbing and emitting dye that is efficiently excited by NIR nanosecond laser pulses to enable pulsed laser-based PAT (pulsed-PAT); and 2) rare-earth containing inorganic nanocrystals that absorb continuous-wave (CW) NIR light by sequential multiphoton absorption through real intermediate states to enable intensity-modulated CW laser-based PAT (CW-PAT). Since both cases produce highly localized nonlinear photoacoustic signal, which has very weak scattering in tissue, we can achieve high contrast 3-D volume imaging of deep tissues. In this study, we validated the principle of our approach in different PAT modes and successfully detected enhanced photoacoustic signals from a visible-light-absorbing dye embedded deep in tissue. With vast variety of functionalized organic dyes operating in the visible range, our mode of nonlinear photoacoustic imaging will find great applications in preclinical and clinical researches.
Keywords: nonlinear, photoacoustic imaging, upconversion, energy transfer
Graphical abstract
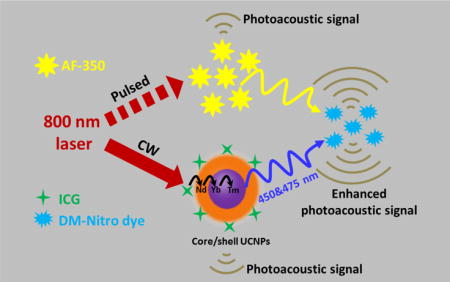
Photoacoustic tomography (PAT) is a hybrid imaging modality that combines optical and ultrasound techniques for high-resolution imaging of optical contrasts in deep tissue.1–6 Similar to other optical tomography modalities, PAT works ideally in the near-infrared (NIR) region which is known as the tissue optical window.7 However, NIR contrast organic dyes which may provide functional imaging, are relatively difficult to synthesize with sufficient environmental stability, thus prevents many functional imaging applications, such as probing the voltage or calcium change in cell membrane.8–9 To circumvent this problem, we propose a new PAT mode using design of paired contrast agent which takes advantage of multiphoton absorbing upconverting material that can convert NIR light into shorter wavelength light in situ to excite visible-absorbing organic probes and generate PA signals.10–11 With this method, deep brain dynamic activity could be photoacoustically monitored: the upconverting material will generate a constant background PA signal, while visible-absorbing organic probes (e.g., voltage sensitive dyes, calcium sensitive dyes, photoswitchable fluorescent proteins12) will produce a dynamic PA signal, depending on functional changes in the brain.
In this study, we rationally designed this approach and experimentally validated it through two types of PAT systems (Scheme 1): a pulsed-laser-based system (pulsed-PAT) and an intensity-modulated continuous-wave (CW) laser-based system (CW-PAT). Both types of systems are commonly used in the PAT field.13–14 For pulsed-PAT, we used a two-photon dye (AF-350) as the upconverting medium, because it responds to ~800 nm nanosecond to femtosecond laser pulses and possesses two-photon excited emission with high efficiency in the visible region.15–16 For CW-PAT, we used lanthanide-doped upconverting nanoparticles (UCNPs), because their upconverting luminescence efficiencies are much higher under CW irradiation due to the long fluorescence lifetime of lanthanide ions (~ microsecond). Under ~800 nm excitation, both AF-350 and UCNPs will emit blue-green light. This wavelength is also readily available from high-speed pulsed laser diodes, allowing us to achieve our ultimate goal of imaging neural activity. The emission of both AF-350 and UCNPs was absorbed by a “visible-light-absorbing” dye (DM-Nitro Dye, Figure S1) synthesized by us. DM-Nitro has a broad absorption band ranging from 350 nm to 600 nm, which partially and fully covers the emission spectrum of AF-350 and UCNPs, respectively. In both pulsed- and CW-PAT systems, we validated the principle of upconversion photoacoustic imaging through well-designed phantom experiments. Because our current visible dye does not exhibit any dynamic change in phantom, we differentiated PA signals generated by upconverting materials and by visible dyes through two sets of experiments, one with visible dyes and another with visible dyes + upconverting material. Subtracting the two reveals signals from the visible dye. Our experimental results agree with the theoretical justification.
Scheme 1.
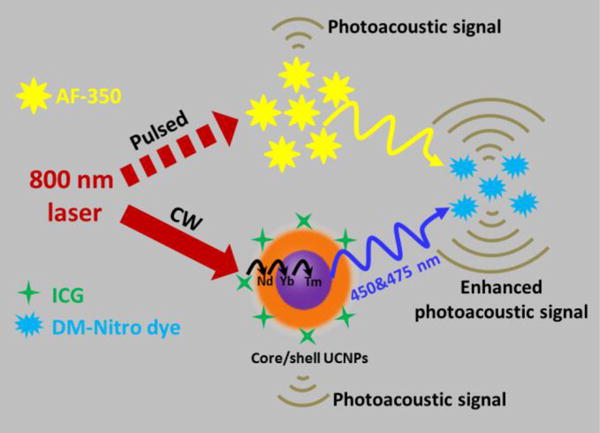
Schematic representation of two types of PAT systems: a pulsed-laser-based system (pulsed-PAT) and an intensity-modulated continuous-wave (CW) laser-based system (CW-PAT).
THEORETICAL CONSIDERATION
If Ae1 (mJ/cm3) is the specific optical energy deposition, the PA signal ( ) of upconversion materials can be expressed as
| (1) |
where , and are nanoparticle material’s Gruneisen parameter, and the percentage of absorbed light that is converted into heat17, respectively. If the upconversion efficiency for upconverting material is , the luminescence of upconverting material upon NIR excitation can be expressed as , which is the optical energy deposition for DM-Nitro dye. Thus, the PA signal originates from the DM-Nitro dye can be represented as
| (2) |
Here, and are the DM-Nitro dye’s Gruneisen parameter and percentage of absorbed light that is converted into heat, respectively. is the PA signal enhancement in the mixed solution (upconverting material + visible dye).
Thus for the pure upconverting material solution, the PA signal will be , while for the mixed solution, the total PA signal will be . Because is always positive, we would expect to observe higher PA amplitude in the mixed solution.
RESULTS AND DISCUSSION
The organic chromophore tris[4-(7-benzothiazol-2-yl-9, 9-diethylfluoren-2-yl) phenyl]amine (i.e. AF-350) selected for pulsed-PAT (Figure S2a) is featured with a short fluorescence life time (1.5 ns), large two-photon absorption cross section, and excellent photostability.15–16 The fluorescence life time of AF350 is shorter than width of the pulsed laser (10 ns), and it satisfies the stress confinement in PA signal generation:18
| (3) |
Here, is the desired spatial resolution (150 μm in our experiment), is the speed of sound (1.5 mm/μs), and is the stress confinement threshold (100 ns in our study). The thermal confinement is a looser constraint, which is satisfied in our system as well.
AF-350 can respond to ~800 nm laser pulses in both nanosecond and femtosecond regimes, and generate two-photon excited visible emission with high efficiency. The violet curve in Figure 1a shows the absorption spectrum of AF-350 in dimethylformamide (DMSO). It can be seen that AF-350 has a strong absorption band centered at 400 nm, which corresponds to two 800 nm photons. Upon absorption of one 400 nm photon or two 800 nm photons, AF-350 is capable of emitting yellow fluorescence with a spectrum show in Figure 1a (yellow curve). Figure 1b(i) and Figure 1c(i) show fluorescence images of AF-350 under mercury lamp (peak intensity at 365 nm) and 800 nm pulsed femtosecond laser excitations, respectively.
Figure 1.
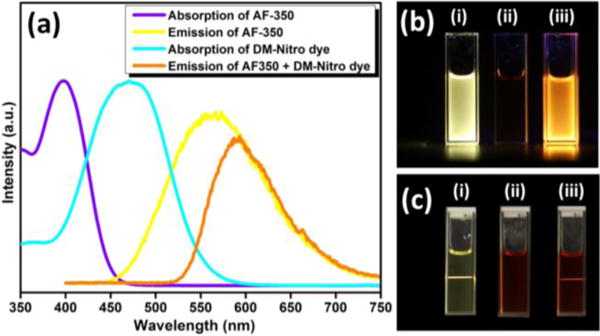
(a) Absorption spectra of AF-350 (violet curve) and DM-Nitro dye (cyan curve), and emission spectra of AF-350 (yellow curve) and the mixture of AF-350 & DM-Nitro dye (orange curve) under 800 nm femtosecond laser excitation in DMSO solution. (b) Fluorescence photographs of (i) AF-350, (ii) DM-Nitro dye and (iii) their mixture in DMSO solution under mercury light excitation. (c) Fluorescence photographs of (i) AF-350, (ii) DM-Nitro dye and (iii) their mixture in DMSO solution under 800 nm femtosecond laser excitation.
A visible-absorbing dye (DM-Nitro) with high absorption coefficient is utilized to absorb the upconverting luminescence from AF-350, and consequently generate PA signals. Figure 1a indicates that DM-Nitro dye has a broad absorption band with a peak located at 475 nm (cyan curve). Therefore, the absorption of the DM-Nitro dye partially overlaps with the emission of AF-350, which ensures energy transfer from AF-350 to DM-Nitro dye. Figures 1b(ii) and 1c(ii) suggest that the DM-Nitro dye does not have fluorescence under neither mercury light nor 800 nm femtosecond laser excitation.
Figure 2.
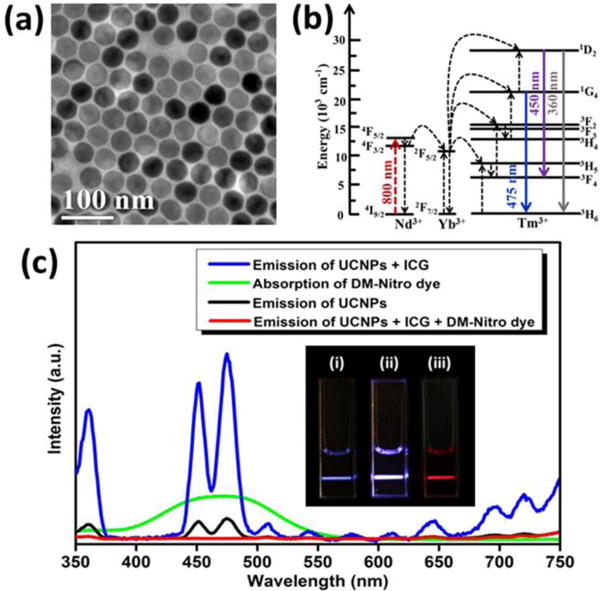
(a) TEM image of NaYF4:Yb/Tm@NaYF4:Nd core/shell UCNPs. (b) UC process of NaYF4:Yb/Tm@NaYF4:Nd UCNPs under 800 nm excitation. (c) Absorption spectrum of DM-Nitro dye (green curve), and UC emission spectra of UCNPs with ICG (blue curve), UCNPs alone (black curve), and the mixture of UCNPs & ICG & DM-Nitro dye (red curve) in DMSO solution upon 800 nm CW laser excitation. Inset: the corresponding luminescence photographs of (i) UCNPs alone, (ii) the mixture of UCNPs & ICG, and (iii) the mixture of UCNPs & ICG & DM-Nitro dye in DMSO solution under 800 nm CW laser excitation.
In the case of their mixture, because the DM-Nitro dye will absorb green emission region of AF350 (Figure 1a), the fluorescence emission color changed from yellow to orange under both mercury lamp [Figure 1b(iii)] and 800 nm femtosecond laser [Figure 1c(iii)] excitations. In this system, AF-350 serves as an energy donor, while the DM-nitro dye serves as an energy acceptor. The emission from AF-350 was partly absorbed by the DM-Nitro dye, causing an orange shift in the fluorescence emission (orange curve) and a decrease in the emission intensity. We quantified that the integrated emission intensity of the mixture accounts for only 60% of that of AF-350 alone, indicating that 40% of the original emission has been absorbed by the DM-Nitro dye. The absorbed energy will then generate PA signals.
For imaging using the CW-PAT system (Figure S2b), we utilized lanthanide-doped UCNPs with a high upconverting energy conversion efficiency of 9.3% when sensitized with Indocyanine green (ICG).19 UCNPs possess several advantages over conventional dyes, such as a large anti-stokes shift, sharp emission band, and high photo-stability.20–22 Our NaYF4:Yb20%/Tm1%@NaYF4:Nd30% core/shell UCNPs can absorb NIR light at 800 nm and emit blue-violet fluorescence at 450 and 475 nm, which thoroughly falls in the absorption region of DM-Nitro dye. Due to the relatively long fluorescence lifetime (including rise time and decay time) of lanthanide ions (~microsecond), emission of UCNPs is very weak under nanosecond laser excitation but strong under CW laser.
Figure 2a shows the TEM image of NaYF4:Yb20%/Tm1%@NaYF4:Nd30% UCNPs, in which UCNPs reveal a fairly uniform size and morphology with an average diameter of ~43 nm. After treatment with NOBF4, the NOBF4 coated UCNPs are able to be well-dispersed in DMSO. Upon 800 nm CW laser excitation, the UCNPs can emit blue-violet light as observed in Figure 2c(i), and its corresponding UC emission spectrum shows that the peaks are located at 450 and 475 nm (black curve in Figure 2c). The underlying UC mechanism has been illustrated in Figure 2b, ascribed to the energy transfer process of Nd3+ → Yb3+ → Tm3+.23 The UC mechanism suggests that the 450 nm emission results from a four-photon process, while the 475 nm emission comes from a three-photon process.24–25 As can be imagined, the brighter the luminescence of UCNPs, the stronger the resulting PA signal produced from DM-Nitro dye. To enhance the upconverting luminescence, we used the mechanism reported in our previous work, in which NIR-absorbing ICG was used to enhance UCNPs’ emission through FRET effect.26–27 In this study, we also added a trace amount of ICG (10 μg/mL) to the UCNPs solution and found a 9.2-fold increase in the UC emission intensity [blue curve and inset (ii) in Figure 2c]. After adding the DM-Nitro dye into the UCNPs solution or the mixture of UCNPs and ICG, the blue-violet lights originated from UCNPs were entirely quenched [Figure 2c and Figure 2c(iii)]. The red beam in Figure 2c(iii) is the 800 nm excitation light, because no low pass filter was applied when the photo was taken. The quenching of blue-violet lights implies that the DM-Nitro dye can efficiently absorb emission of UCNPs. Through modulating ~800 nm CW laser excitation, the UCNPs will generate modulated visible emission which can be absorbed by DM-Nitro dye, generating enhanced PA signals at the modulation frequency. In contrast, the weak emission of UCNP under pulsed laser provides negligible signal enhancement. Apparently, UCNP is a perfect candidate for imaging using the CW-PAT system.
Figure 3 shows images acquired from the pulsed-PAT system. Each image is a result of 100 times average to minimize effect of laser fluctuation. We also applied a threshold to all the images: values below that threshold were not shown. At 480 nm, because of strong optical absorption, the light attenuated very quickly through 1.3-cm chicken breast tissue and could not reach the tube placed underneath. Correspondently, tubes filled with different contrasts did not exhibit any PA signals (Figure 3a). In contrast, 800 nm light can easily penetrate through chicken breast tissue (Figure 3b). Because the DM-Nitro dye does not absorb 800 nm light, its PA signal is negligible. The tube filled with AF-350 alone can be clearly seen in Figure 3b due to partial non-radiative light absorption. For the DM-Nitro dye and AF-350 mixture, the upconverting luminescence of AF-350 was directly absorbed by the DM-Nitro dye, generating additional PA signals. By averaging signals within red boxes 1 and 2, we quantified that the tube with AF-350 and DM-Nitro mixture generates 25% more PA signals compared to that of pure AF-350. Thus our technique allows the visible dye to be seen by PA signal under NIR light excitation. To further demonstrate the imaging ability of our method, we also compared the signal of the mixed solution with that of blood at different concentrations (100%, 75%, 50%, 25%, 12.5% and 1%) (Figure S3). Our result reveals that the PA amplitude of the mixed solution is comparable to that of blood at a concentration of 30%, which is much higher than the average volume percentage of blood in tissue (less than 1%)28, indicating the potential of our method to be used in vivo.
Figure 3.
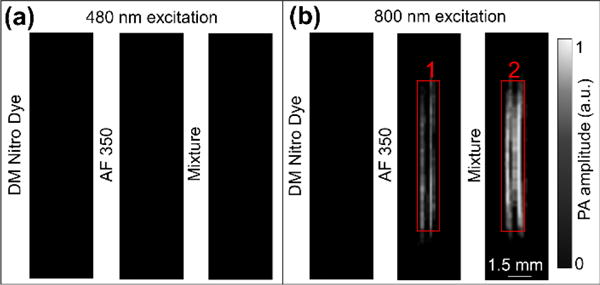
Results of tube phantom imaged through 1.3-cm-thick chicken breast tissue (100 times averaging was performed on each image). (a). Imaging results acquired with 480 nm light excitation. (b). Imaging results acquired with 800 nm light excitation.
We also verified our technique in the CW-PAT system. Similar to pulsed-PAT experiment, all samples were filled in 1.5-mm-dimater tubes. Because the excitation laser provides 1 MHz square wave output, the corresponding PA signals were also modulated at 1 MHz in frequency. For each experiment, we acquired 20 cycles of PA data and averaged them into one cycle. Figure 4a shows the averaged PA waveform of pure UCNPs imaged through 3-mm thick chicken breast tissue. The peak-to-peak amplitude of this waveform was used as a reference to normalize all other data as shown in Figure 4b. For experiments with chicken breast tissue on top of tube, the normalized amplitude of UCNPs and DM-Nitro mixture is 1.15, which is 15% higher than that of pure UCNPs. This increase originates from reabsorption of upconverting luminescence by the DM-Nitro dye. We also tested the mixture of ICG and UCNPs and found a 59% increase in PA signal due to the high NIR absorption of ICG. For the mixture of UCNPs, ICG and DM-Nitro dye, we found a signal increase of 32% compared to that of UCNPs and ICG mixture. This increase further proves that the upconverting emissions were reabsorbed by the DM-Nitro dye to generate additional PA signals.
Figure 4.
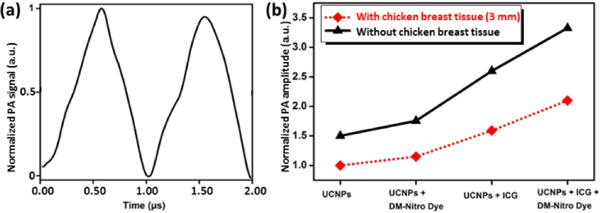
Imaging results of the CW-PAT system. (a) Normalized PA waveform of UCNPs with 3-mm chicken breast tissue overlaying on top. (b) Normalized PA amplitudes of all samples imaged with and without chicken breast tissue. 20 times averaging was performed on all the datasets.
Because our CW-PAT system could not provide depth information, we also removed the chicken breast tissue and performed the same sets of experiments to make sure that the observed PA signals do originate from contrasts filled in the tubes (instead of chicken breast tissue). As can be seen in Figure 4b, the results agree very well with the ones acquired with chicken breast tissue. Clearly, the DM-Nitro dye that initially lacks NIR imaging ability is able to produce sufficient PA signals using our technique.
CONCLUSIONS
In conclusion, we proposed a novel approach that allows visible-light-absorbing dyes to be used in deep-tissue imaging applications. The feasibility of this method is experimentally demonstrated through phantom imaging using both pulsed- and CW-PAT systems. For the proof of concept, we used a generic dye: DM-Nitro, however, the mechanism of this method is readily applicable for many other visible indicators/probes. For instance, our method may enable a recently developed calcium sensitive contrast to be used in deep brain imaging29. As for the imaging depth, for the pulsed-PAT system, we demonstrated a depth of 1.3 cm, while for the CW-PAT system, the depth is 3 mm. While these imaging depths are sufficient for our targeted imaging application: monitoring mouse cortex activities through intact scalp, we can further improve it with the following approaches: 1) increasing laser power (our current laser power is only 69% of safety limit in pulsed PAT and 15% of safety limit in CW-PAT), 2) developing upconverting materials with higher fluorescence efficiency, and 3) utilizing more sensitive ultrasound data acquisition systems: a system with higher pre-amplification gain is able to increase the signal-to-noise ratio (SNR) and reveal signals originating from deeper tissue.
A current limitation of both upconverting materials is their relatively poor luminescence efficiency in aqueous solvent. This issue can potentially be addressed by encapsulating upconverting materials within phospholipid micelles. Because our method works through near-field light transmission, it does not require the upconverting material to pass through the blood brain barrier (BBB), removing a major hurdle in the development of brain imaging contrast agents. Our technique will pave the way for neural imaging and enable the use of visible-light absorbing voltage,8 calcium,9 and glucose30 sensitive dyes for deep brain imaging. We believe that our method will also find many other applications in biomedical research. For instance, the upconversion mechanism will also benefit fluorescence imaging systems: we can utilize upconverting materials as internal light emitters to excite in situ dyes with visible fluorescence. The nonradiative decay part can be detected photoacoustically. Our method will also allow deep-tissue photoacoustic evaluation of photodynamic therapy through the nonlinear photo-conversion mechanism31.
METHODS
Materials
Yttrium(III) chloride hexahydrate (YCl3·6H2O, 99.99%), Neodymium(III) chloride hexahydrate (NdCl3·6H2O, 99.9%), Ytterbium chloride hexahydrate (YbCl3·6H2O, 99.99%), Thulium chloride hexahydrate (TmCl3·6H2O, 99.99%), Sodium hydroxide (NaOH, 98%), Ammonium fluoride (NH4F, 98%), ICG, nitrosyl tetrafluoroborate (NOBF4, 95%), N,N-dimethylformamide (DMF, anhydrous, 99.8%), 1-octadecene (90%), and oleic acid (OA, 90%) were all purchased from Sigma-Aldrich. Hexane (ACS reagent grade, ≥98.5%) and methanol (ACS reagent grade, ≥99.8%) were purchased from Fisher Scientific. Ethanol was provided by Decon Labs, Inc. The two photon dye AF-350 was donated by the U.S. Air Force Research Lab. All the chemicals were used without further purification.
Synthesis of NaYF4:Yb20%,Tm1% core UCNPs
A total amount of 1 mmol RECl3·6H2O (RE = Y, Yb, Tm) were added into a three-necked flask containing the mixture of 1-octadecene (15 mL) and oleic acid (7 mL) under vigorous stirring at room temperature (the ratio of RE varied according to the experiment requirements). The resulting mixture was then heated to 160 °C for 1 h, and then cooled down to room temperature. After that a methanol solution (10 mL) of NH4F (0.148g) and NaOH (0.1 g) was added into the flask. The temperature was then increased to 120 °C in order to remove the methanol from the mixture. Once the methanol was evaporated completely, the above mixture was heated to 300 °C for 1 h under an argon environment. Then the reaction mixture was cooled down to room temperature. The as-prepared nanoparticles were collected and precipitated by the addition of ethanol, followed by centrifugation, then washed with water and ethanol for several times, and finally dispersed in hexane.
Synthesis of NaYF4:Yb20%,Tm1%@NaYF4:Nd30% core/shell UCNPs
The RE(CF3COO)3 shell precursor was first synthesized by mixing Y2O3 (0.175 mmol) and Nd2O3 (0.075 mmol) with 50% concentrated trifluoroacetic acid, refluxing at 95 °C to get a transparent solution, and then evaporating the solution to dryness under argon gas in a three-neck flask. Next, the NaYF4:Yb20%,Tm1% core nanoparticles in 10 mL Hexane, the Na(CF3COO) (1 mmol), 10 mL oleic acid, and 10 mL 1-octadecene were added into the flask. The mixture was heated to 120 °C for 30 min in order to remove the hexane and the remaining water. After that, the resulting solution was heated to 320 °C and kept at this temperature for 30 min before naturally cooling down to room temperature. 20 mL ethanol was added to precipitate the NaYF4:Yb20%,Tm1%@NaYF4:Nd30% core/shell nanoparticles, and then followed by centrifugation at 18144 rcf for 7 min. Lastly, the as-prepared nanoparticles were dispersed in 10 mL Hexane.
Treatment of NaYF4:Yb20%,Tm1%@NaYF4:Nd30% core/shell UCNPs with NOBF4
5 mL of oleic acid coated UCNPs dispersed in hexane (10 mg/mL) was mixed with a 5 mL N,N-DMSO solution of NOBF4 (0.01 M) at room temperature. The resulting mixture was shaken gently for 10 minutes, allowing an extraction of nanoparticles from upper hexane layer into the bottom DMSO layer. After disposing the hexane layer, these nanoparticles dispersed in the DMSO were purified by adding a large amount of toluene and hexane (1:1 v/v) and centrifugation at 11000 rpm for 15 minutes. Subsequently, the precipitated nanoparticles were weighted and re-dispersed in DMSO.
Synthesis of DM-Nitro dye
DM-Nitro dye was synthesized by Knoevenagel condensation depicted in Figure S1. Briefly, a solution of 4-(dimethylamino) benzaldehyde (1.0 mmol) and 2-(4-nitrophenyl) acetonitrile (1.0 mmol) in absolute EtOH (10 mL) was treated portion wise with piperidine (0.1 mmol) and stirred at 65°C for 3-4 h. After cooling to room temperature, the precipitate was filtered and washed with chilled ethanol. The dried crude product was purified by column chromatography on silica gel using chloroform as an eluent to give a pure powder. Yield 86% (dark red solid). IR (KBr) cm−1: 2208 (−CN), 1585 (−C=C−), 2909 (−CH). 1H NMR spectrum, (400 MHz; CDCl3) δ (ppm): 8.22 (m, 2H, Ar), 8.02 (s, 1H), 7.91(m, 2H, Ar), 7.48 (d, 2H, Ar), 6.85 (d, 2H, Ar), 3.06 (s, 6H, −N(CH3)2). MS (MALDI), calcd for C17H15N3O2, m/z = 293.12, found, m/z = m/z: 293.12.
Pulsed-PAT system
To demonstrate our method, we first performed three phantoms experiments with a pulsed imaging system. All the phantoms were made of a straight silicon tube with 1.5 mm inner diameter. The tubes were filled with AF-350, DM-Nitro dye, or the mixture of these two. Only one tube was imaged at a time. For good positioning, the tube was placed on top of a piece of agar gel. To better verify the deep tissue imaging ability of our method, we also placed a piece of chicken breast tissue on top of the tube. The tube was then imaged at two wavelengths: 480 nm, where DM-Nitro dye shows strong absorption but the light penetration depth is shallow, and 800 nm, where AF-350 shows strong absorption and the light can penetrate deep. The two imaging wavelengths were provided by two Nd:YAG pumped optical parametric oscillator (OPO) lasers (SLIII-10, Continuum) with 10 Hz pulse repetition rate and 10 ns pulse duration. For 480 nm light, the pump source is 355 nm and the OPO can be tuned from 410 nm to 2500 nm, while for 800 nm light, the pump source is 532 nm and the OPO can be turned from 680 nm to 2500 nm. Light beam was redirected by a few mirrors to the sample and was diffused by an engineered diffuser to obtain an uniform beam (Figure S2a). To change wavelength, a flippable mirror is applied in front of lasers to alternatively guide the desired light to the imaging region. Size of light beam was 1.5-cm in diameter and the light intensity was around 22 mJ/cm2, which is below the ANSI safety limitation at 800 nm (32 mJ/cm2).32 PA signal of the tube was acquired by a 128-element clinical liner transducer array (ATL/Philips L7-4) with 5 MHz central frequency. L7-4 was chosen because of its large element size and low center frequency. While we can reach even deeper imaging depth using a lower frequency transducer (such as P4-2 with 3 MHz central frequency), the resolution would be degraded. The received PA signals were amplified (by 54 dB) and digitized by a 128-channel ultrasound data acquisition (DAQ) system (Vantage, Verasonics) with 20 MHz sampling rate. After each laser pulse, the raw channel data was reconstructed using the universal back-projection algorithm.33 For each experiment, we acquired 100 frames and averaged them to improve the SNR and to account for fluctuations in laser output.
CW-PAT system
Figure S2b shows the schematic drawing of the CW-PAT system, utilizing an inexpensive, compact, and durable laser diode (L808P1000MM, Thorlabs, maximum power: 1000 mW; wavelength: 808 nm) as the excitation source. The laser diode was installed in a laser mount (TCLDM9, Thorlabs), which was driven by a laser diode current controller (LDC240C, Thorlabs). We modulate the power of the laser diode at 1 MHz with 100% modulation depth by applying an 8.5 V square wave to the RF input of laser mount. In front of the laser diode, we used a convex lens (C230TMD-B, Thorlabs) to collimate the diode output. Similar to the pulsed PA experiment, we sealed the contrast in a tube, which was covered by a slice of 3-mm thick breast tissue. Position of the sample was adjusted to ensure that the tube phantom could generate the highest PA signal. The light intensity on the surface of chicken tissue was quantified to be 500 mW/cm2, which is within the ANSI safety limit of 808 nm (3.29 W/cm2). A 1 MHz single element transducer (E1012-SU, Mana) with a 12.7 mm diameter is co-axially placed beneath the laser beam to detect the generated PA signal, which was first amplified 80 dB by a low noise amplifier (351A-3-50-NI, Analog Modules) and then acquired by an oscilloscope (Tektronix DP3034).
Supplementary Material
Acknowledgments
This work was sponsored in part by the SUNY Brain Network of Excellence Big Idea Award, the National Institutes of Health (R21EY026411), and the Air Force Office of Scientific Research (Grant No. FA9550-15-1-0358).
Footnotes
Supporting Information.
The Supporting Information is available free of charge via the Internet at http://pubs.acs.org.
Notes
The authors declare no competing financial interest.
References
- 1.Wang LV, Hu S. Photoacoustic tomography: in vivo imaging from organelles to organs. Science. 2012;335(6075):1458–1462. doi: 10.1126/science.1216210. [DOI] [PMC free article] [PubMed] [Google Scholar]
- 2.Wang D, Wu Y, Xia J. Review on photoacoustic imaging of the brain using nanoprobes. Neurophotonics. 2016;3(1):010901–010901. doi: 10.1117/1.NPh.3.1.010901. [DOI] [PMC free article] [PubMed] [Google Scholar]
- 3.Zhang HF, Maslov K, Stoica G, Wang LV. Functional photoacoustic microscopy for high-resolution and noninvasive in vivo imaging. Nat Biotechnol. 2006;24(7):848. doi: 10.1038/nbt1220. [DOI] [PubMed] [Google Scholar]
- 4.Jin Y, Jia C, Huang S-W, O’Donnell M, Gao X. Multifunctional nanoparticles as coupled contrast agents. Nat Commun. 2010;1:41. doi: 10.1038/ncomms1042. [DOI] [PMC free article] [PubMed] [Google Scholar]
- 5.Yao J, Wang L, Yang J-M, Maslov KI, Wong TT, Li L, Huang C-H, Zou J, Wang LV. High-speed label-free functional photoacoustic microscopy of mouse brain in action. Nat Methods. 2015;12(5):407–410. doi: 10.1038/nmeth.3336. [DOI] [PMC free article] [PubMed] [Google Scholar]
- 6.Jathoul AP, Laufer J, Ogunlade O, Treeby B, Cox B, Zhang E, Johnson P, Pizzey AR, Philip B, Marafioti T, Lythgoe MF, Pedley RB, Pule MA, Beard P. Deep in vivo photoacoustic imaging of mammalian tissues using a tyrosinase-based genetic reporter. Nat Photon. 2015;9(4):239–246. [Google Scholar]
- 7.Jacques SL. Origins of tissue optical properties in the UVA, visible, and NIR regions. OSA TOPS on advances in optical imaging and photon migration. 1996;2:364–369. [Google Scholar]
- 8.Ferezou I, Bolea S, Petersen CC. Visualizing the cortical representation of whisker touch: voltage-sensitive dye imaging in freely moving mice. Neuron. 2006;50(4):617–629. doi: 10.1016/j.neuron.2006.03.043. [DOI] [PubMed] [Google Scholar]
- 9.Deán-Ben XL, Sela G, Lauri A, Kneipp M, Ntziachristos V, Westmeyer GG, Shoham S, Razansky D. Functional optoacoustic neuro-tomography for scalable whole-brain monitoring of calcium indicators. Light: Science & Applications. 2016;5(12):e16201. doi: 10.1038/lsa.2016.201. [DOI] [PMC free article] [PubMed] [Google Scholar]
- 10.Wu S, Butt HJ. Near‐Infrared‐Sensitive Materials Based on Upconverting Nanoparticles. Adv Mater. 2016;28(6):1208–1226. doi: 10.1002/adma.201502843. [DOI] [PubMed] [Google Scholar]
- 11.Yang G, Lv R, He F, Qu F, Gai S, Du S, Wei Z, Yang P. A core/shell/satellite anticancer platform for 808 NIR light-driven multimodal imaging and combined chemo-/photothermal therapy. Nanoscale. 2015;7(32):13747–13758. doi: 10.1039/c5nr03085d. [DOI] [PubMed] [Google Scholar]
- 12.Deán-Ben XL, Stiel AC, Jiang Y, Ntziachristos V, Westmeyer GG, Razansky D. Light fluence normalization in turbid tissues via temporally unmixed multispectral optoacoustic tomography. Opt Lett. 2015;40(20):4691–4694. doi: 10.1364/OL.40.004691. [DOI] [PubMed] [Google Scholar]
- 13.Wang D, Wang Y, Wang W, Luo D, Chitgupi U, Geng J, Zhou Y, Wang L, Lovell JF, Xia J. Deep tissue photoacoustic computed tomography with a fast and compact laser system. Biomed Opt Express. 2017;8(1):112–123. doi: 10.1364/BOE.8.000112. [DOI] [PMC free article] [PubMed] [Google Scholar]
- 14.Maslov K, Wang LV. Photoacoustic imaging of biological tissue with intensity-modulated continuous-wave laser. J Biomed Opt. 2008;13(2) doi: 10.1117/1.2904965. 024006-024006-5. [DOI] [PubMed] [Google Scholar]
- 15.Kannan R, He GS, Lin T-C, Prasad PN, Vaia RA, Tan L-S. Toward Highly Active Two-Photon Absorbing Liquids. Synthesis and Characterization of 1,3,5-Triazine-Based Octupolar Molecules. Chem Mater. 2004;16(1):185–194. [Google Scholar]
- 16.He GS, Swiatkiewicz J, Jiang Y, Prasad PN, Reinhardt BA, Tan L-S, Kannan R. Two-Photon Excitation and Optical Spatial-Profile Reshaping via a Nonlinear Absorbing Medium. The Journal of Physical Chemistry A. 2000;104(20):4805–4810. [Google Scholar]
- 17.Zhou Y, Yao J, Wang LV. Tutorial on photoacoustic tomography. J Biomed Opt. 2016;21(6):061007–061007. doi: 10.1117/1.JBO.21.6.061007. [DOI] [PMC free article] [PubMed] [Google Scholar]
- 18.Xia J, Yao J, Wang LV. Photoacoustic tomography: principles and advances. Electromagnetic waves (Cambridge, Mass) 2014;147:1. doi: 10.2528/pier14032303. [DOI] [PMC free article] [PubMed] [Google Scholar]
- 19.Chen G, Damasco J, Qiu H, Shao W, Ohulchanskyy TY, Valiev RR, Wu X, Han G, Wang Y, Yang C. Energy-cascaded upconversion in an organic dye-sensitized core/shell fluoride nanocrystal. Nano letters. 2015;15(11):7400–7407. doi: 10.1021/acs.nanolett.5b02830. [DOI] [PMC free article] [PubMed] [Google Scholar]
- 20.Chen G, Qiu H, Prasad PN, Chen X. Upconversion Nanoparticles: Design, Nanochemistry, and Applications in Theranostics. Chem Rev. 2014;114(10):5161–5214. doi: 10.1021/cr400425h. [DOI] [PMC free article] [PubMed] [Google Scholar]
- 21.Wei W, Zhang Y, Chen R, Goggi J, Ren N, Huang L, Bhakoo KK, Sun H, Tan TTY. Cross Relaxation Induced Pure Red Upconversion in Activator- and Sensitizer-Rich Lanthanide Nanoparticles. Chem Mater. 2014;26(18):5183–5186. [Google Scholar]
- 22.Zhang Y, Wei W, Das GK, Yang Tan TT. Engineering lanthanide-based materials for nanomedicine. J Photochem Photobiol, C. 2014;20:71–96. [Google Scholar]
- 23.Xie X, Gao N, Deng R, Sun Q, Xu Q-H, Liu X. Mechanistic Investigation of Photon Upconversion in Nd3+-Sensitized Core–Shell Nanoparticles. J Am Chem Soc. 2013;135(34):12608–12611. doi: 10.1021/ja4075002. [DOI] [PubMed] [Google Scholar]
- 24.Xu W, Song H, Chen X, Wang H, Cui S, Zhou D, Zhou P, Xu S. Upconversion luminescence enhancement of Yb3+, Nd3+ sensitized NaYF4 core-shell nanocrystals on Ag grating films. Chem Commun. 2015;51(8):1502–1505. doi: 10.1039/c4cc08955c. [DOI] [PubMed] [Google Scholar]
- 25.Wang K, Qincheng W, Zhang Y, Qiao R, Li S, Li Z. Synthesis of Nd3+/Yb3+ sensitized upconversion core-shell nanocrystals with optimized hosts and doping concentrations. RSC Advances. 2015;5(77):62899–62904. [Google Scholar]
- 26.Wei W, Chen G, Baev A, He GS, Shao W, Damasco J, Prasad PN. Alleviating Luminescence Concentration Quenching in Upconversion Nanoparticles through Organic Dye Sensitization. J Am Chem Soc. 2016;138(46):15130–15133. doi: 10.1021/jacs.6b09474. [DOI] [PubMed] [Google Scholar]
- 27.Chen G, Damasco J, Qiu H, Shao W, Ohulchanskyy TY, Valiev RR, Wu X, Han G, Wang Y, Yang C, Ågren H, Prasad PN. Energy-Cascaded Upconversion in an Organic Dye-Sensitized Core/Shell Fluoride Nanocrystal. Nano Lett. 2015;15(11):7400–7407. doi: 10.1021/acs.nanolett.5b02830. [DOI] [PMC free article] [PubMed] [Google Scholar]
- 28.Jacques SL. Optical properties of biological tissues: a review. PMB. 2013;58(11):R37. doi: 10.1088/0031-9155/58/11/R37. [DOI] [PubMed] [Google Scholar]
- 29.Zhang HK, Kang J, Yan P, Abou DS, Le HN, Thorek DL, Kang JU, Gjedde A, Rahmim A, Wong DF. Recording membrane potential changes through photoacoustic voltage sensitive dye. SPIE BiOS, International Society for Optics and Photonics; 2017. 1006407-1006407-10. [DOI] [PMC free article] [PubMed] [Google Scholar]
- 30.Yao J, Xia J, Maslov KI, Nasiriavanaki M, Tsytsarev V, Demchenko AV, Wang LV. Noninvasive photoacoustic computed tomography of mouse brain metabolism in vivo. NeuroImage. 2013;64:257–266. doi: 10.1016/j.neuroimage.2012.08.054. [DOI] [PMC free article] [PubMed] [Google Scholar]
- 31.Kachynski A, Pliss A, Kuzmin A, Ohulchanskyy T, Baev A, Qu J, Prasad P. Photodynamic therapy by in situ nonlinear photon conversion. Nature Photonics. 2014;8(6):455–461. [Google Scholar]
- 32.ANSI, Z. 136.1, American National Standard for Safe Use of Lasers. Laser Institute of America; Orlando: 2000. [Google Scholar]
- 33.Xu M, Wang LV. Universal back-projection algorithm for photoacoustic computed tomography. Physical Review E. 2005;71(1):016706. doi: 10.1103/PhysRevE.71.016706. [DOI] [PubMed] [Google Scholar]
Associated Data
This section collects any data citations, data availability statements, or supplementary materials included in this article.


