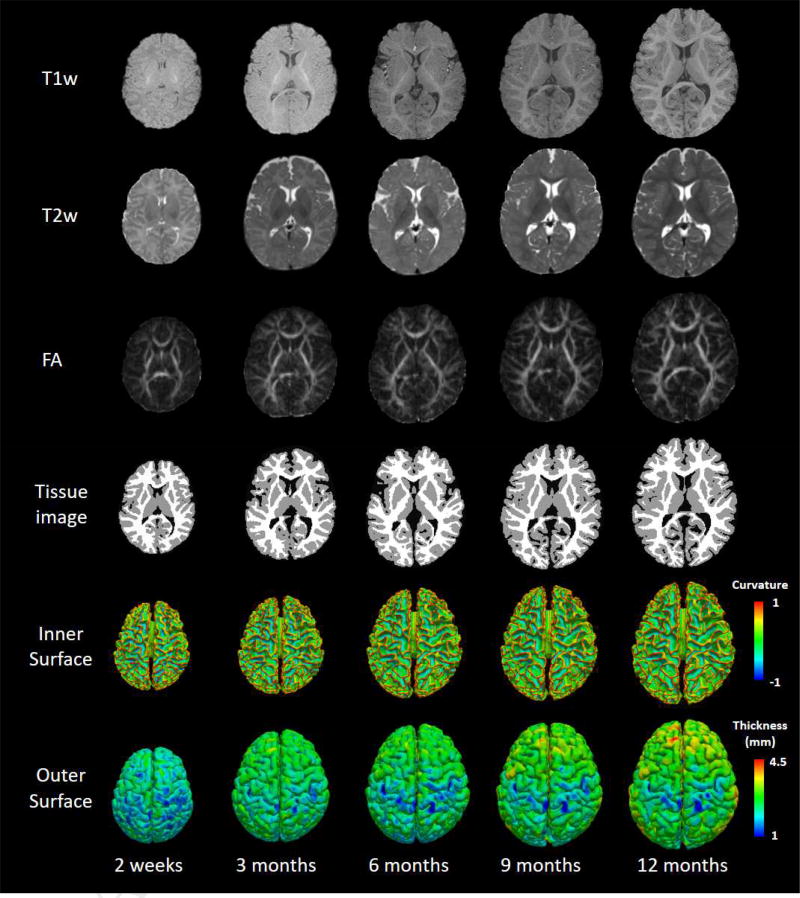
Fig. 1.
T1w, T2w, FA images, tissue segmentation results (by LINKS, (Wang et al., 2015)) as well as the reconstructed inner and outer surfaces of a typically-developing infant, scanned longitudinally at 2 weeks, 3, 6, 9 and 12 months of age. Inner surfaces are color-coded with the maximum principal curvature, and outer surfaces are color-coded with cortical thickness.

