

Abstract
Purpose
To select reference genes with stable messenger RNA (mRNA) expression for quantitative real-time reverse transcription-polymerase chain reaction (qRT-PCR) analysis of vitrified/thawed human ovarian tissue and to evaluate in human ovarian tissue the levels of key proteins which are commonly used as reference proteins.
Methods
Pieces of ovarian tissue were obtained during laparoscopy from patients (n = 10, 24–36 years old) who suffered from types of cancer that does not affect reproductive system. Tissue strips from the intact group were immediately placed into liquid nitrogen. Tissue strips from the second group were successively placed into solutions with cryoprotective agents. Then, these strips were rapidly placed into liquid nitrogen. After thawing, ovarian tissue strips were cultured during 2 h in complete growth medium. Gene expression levels were measured using quantitative RT-PCR. Also, protein levels of three key reference genes were measured using Western blot. Statistical analysis of obtained data was performed by BestKeeper, NormFinder, and geNorm software utilities; correlation coefficients were also calculated.
Results
The most suitable reference genes for qRT-PCR analysis of human cortical ovarian tissue after cryopreservation by vitrification are genes of ribosomal proteins RPL4, RPLP0, RPS18, and heat shock protein HSP90AB1. The protein levels of three commonly used reference genes (ACTB, GAPDH, and HSP90) were measured in two groups of samples of human ovarian tissue: intact and vitrified/thawed. The levels of ACTB, GAPDH, and HSP90 proteins were similar in native and vitrified/thawed samples.
Conclusion
Selection of suitable reference genes is the first aim of any research dedicated to the investigation of gene expression, because the interpretation of obtained results largely depends on selection of appropriate reference genes. Nowadays, there are many mathematical approaches allowing to select not only single reference gene but also a group of the most stably expressed reference genes. The use of mathematical models which take into account multiple reference genes will allow to obtain more accurate data on the expression of target genes.
Keywords: Cryopreservation, Vitrification, Ovary, Housekeeping genes, Reference genes, Real-time PCR, Western blot
Introduction
Common methods of anticancer treatment such as chemotherapy and radiotherapy often cause female reproductive dysfunction [1]. The recent increase in cancer survival rates urge scientists to find new approaches to fertility preservation. Moreover, the latest data show that ovarian tissue cryopreservation could make childbirth after cancer treatment possible [2]. Despite the fact that researches have been developing this technique for several decades, only a few dozens of children were born after application of this treatment approach [2]. Thus, introduction of ovarian tissue cryopreservation technique into clinical practice requires additional investigation. Studies dedicated to this question increasingly exploit qRT-PCR for assessment of cryopreservation-induced processes in ovarian tissues [3–7]. However, there is no data about suitable reference genes that are stable expressed during cryopreservation procedure of human ovarian tissue which is essential for receiving reliable qRT-PCR results.
Quantitative real-time PCR is a standard method for gene expression analysis. This technique is considered to be the most sensitive, accurate, and reproducible for examination of gene expression levels [8]. In order to obtain reliable results, it is important to carry out the process of normalization with reference genes and to interpret them rationally [9, 10]. Absolute quantification and normalization in relation to the amount of total RNA are not applicable in a number of experimental actions that entail global changes in cellular physiology, such as changes in transcriptional activity. So-called “housekeeping genes” are commonly used for qRT-PCR data normalization. Despite a large number of papers devoted to selection of reference genes, there are certain evidences demonstrating that the expression of genes ordinarily used as reliable internal controls is often depending on the specific experimental conditions and samples [11, 12]. Therefore, the crucially important step of the experimental design is to select appropriate genes that display a stable expression pattern.
Nowadays, there is only one study performed on cryopreserved ovarian tissue and dedicated to reference genes selection for gene expression analysis [13]. However, the work of Yuanyuan et al. [13] was performed on murine ovarian tissue, so it is unclear how these results correspond to gene expression levels in human ovarian tissue and whether it is possible to use the selected reference genes for qRT-PCR data normalization in case of human ovarian tissue analysis, particularly in clinical practice. Thus, it is essential to select suitable genes for qRT-PCR data normalization specifically for human ovarian tissue with respect to cryopreservation procedure.
In the current study, evaluation of reference genes stability was performed in human ovarian tissue before and after cryopreservation by vitrification. Sixteen reference genes belonging to different functional classes were selected to minimize the chance of their co-regulation: ABL proto-oncogene 1, non-receptor tyrosine kinase (ABL1), actin beta (ACTB), beta-2-microglobulin (B2M), cyclin dependent kinase inhibitor 1A (CDKN1A), glyceraldehyde-3-phosphate dehydrogenase (GAPDH), hydroxymethylbilane synthase (HMBS), hypoxanthine phosphoribosyltransferase 1 (HPRT1), heat shock protein 90 alpha family class B member 1 (HSP90AB1), insulin like growth factor 1 receptor (IGF1R), peptidylprolyl isomerase A (PPIA), ribosomal protein L30 (RPL30), ribosomal protein L4 (RPL4), ribosomal protein lateral stalk subunit P0 (RPLP0), ribosomal protein S18 (RPS18), TATA-box binding protein (TBP), and topoisomerase (DNA) II beta (TOP2B).
Several statistical approaches have recently been developed to identify genes having the most stable expression, regardless of the method of sampling and the quality of the starting material. To assess the stability of reference gene expression, the most widespread algorithms were applied: geNorm [14], BestKeeper [15], and NormFinder [16].
The geNorm is a software tool which can be used to identify the reference genes with the most stable expression [14]. In this software, a complex approach is employed for the analysis of gene expression stability. As a result, M value of each gene is calculated. M value is a parameter which defines expression stability. The gene with the lowest M value may be accepted as a gene with the most stable expression.
BestKeeper is a software utility applied to identify the most stable reference genes. Mathematical approach for analysis of gene expression stability is based on the comparison of the correlation coefficients for all possible pairs of candidate reference genes. The BestKeeper software utilizes a two-step analysis. Firstly, standard deviation (SD) of the Ct values is calculated for all genes involved into investigation. Genes which have SD > 1 are considered inconsistent and are rejected from the further analysis. At the second step, the BestKeeper software calculates a specific index, which is computed as the geometric mean of the Ct values of highly correlated candidate reference genes. After that, the correlation coefficient between the BestKeeper index and the expression level of each gene is calculated. The reference genes which are most closely correlated with the BestKeeper index can be assumed as the most stable genes [15].
The NormFinder is another software utility which allows to select the most suitable reference genes. NormFinder calculates intragroup and intergroup variations in gene expression stability. After these calculations, reference genes are ranked according to their expression stability [16].
In the current work, all of the abovementioned software tools (geNorm, BestKeeper, and NormFinder) were used to find the most suitable reference genes in native and vitrified/thawed human ovarian cortical tissue. Moreover, protein levels of three commonly used reference genes (ACTB, GAPDH, and HSP90) were measured to determine whether there is a correlation between mRNA and corresponding protein levels in vitrified/thawed human ovarian tissue.
Materials and methods
Source of ovarian tissue
This study was approved by the ethical committee of the Medical Radiological Research Center. Ovarian tissue was obtained from patients undergoing anticancer treatment with their informed consent and according to the current legislation of the Russian Federation.
Ovarian tissue samples
Ovarian tissue samples (n = 10) were received from the Medical Radiological Research Center, Ministry of Health of the Russian Federation (MRRC). Average age of patients was 31 years (range 24–36 years). Ovarian cortical strips (approximately 5 mm × 5 mm × 10 mm) were obtained from ovaries during laparoscopy. Preparing for the surgery procedure and assessment of the patient’s health status were made in accordance with the protocol described previously [17, 18]. The obtained strips of ovarian cortical tissue were placed to the medium based on DMEM with addition of HEPES (25 mM, Sigma) and 20% fetal bovine serum. After that, ovarian cortical tissue strips from each patient were divided into two groups (intact group and group for vitrification). Tissue strips from the intact group were immediately placed into liquid nitrogen and stored there directly until the RNA extraction. Tissue strips from the second group were cryopreserved by vitrification. The strips were subjected to the vitrification and thawing accordingly to the protocol used in clinical practice [19]. Briefly, the strips were placed into solutions with cryoprotective agents: firstly, these strips were placed into the solution based on DMEM (PanEco, Russia) with addition of 15% DMSO (dimethyl sulfoxide, Sigma) and 15% ethylene glycol (Sigma) for 15 min, and then strips were moved into the solution based on DMEM which contained 30% DMSO and 30% ethylene glycol for 15 min. Then these strips were rapidly placed into liquid nitrogen. Cryovials (2 ml, Corning) were used for storage of all ovarian tissue samples in liquid nitrogen. After thawing, ovarian tissue strips were cultured during 2 h in complete growth medium containing DMEM/F12 (1:1, PanEco, Russia); 2 mM/l l-glutamine (PanEco, Russia); 50 μg/ml gentamicin (PanEco, Russia); 5 μg/ml insulin, 5 μg/ml transferrin, and 5 ng/ml selenite (1:100, PanEco, Russia); 20 ng/ml bFGF (ProSpec, Israel); and 10% fetal bovine serum (HyClone, USA).
RNA isolation and cDNA synthesis
RNA was extracted from all samples using the RNeasy Mini Kit (Qiagen, USA) following the manufacturer’s instructions. The concentration of total RNA was measured by NanoDrop1000 Spectrophotometer (Thermo Scientific, USA) with A260/280 quality control. M-MLV RT kit (Evrogen, Russia) was used to synthesize complementary DNA (cDNA) from 1.5 μg of total RNA with random oligonucleotide primers (dN)10 and 40 U/μl RiboLock RNase Inhibitor (Thermo Scientific, USA). cDNA concentration was evaluated using NanoDrop1000 Spectrophotometer (Thermo Scientific). All cDNA samples were diluted to 0.5 μg/μl with nuclease-free water and stored at − 80 °C until qRT-PCR analysis.
Primer design for selected candidate reference genes
Primers (Table 1) were designed by Lasergene PrimerSelect (DNASTAR) software using sequences from the NCBI GenBank database.
Table 1.
Reference genes for gene expression normalization
| Gene name | NCBI gene ID | Forward primer sequence (5′- > 3′) | Reverse primer sequence (5′- > 3′) | Product length (bp) | Ampl. eff. (%) | Standard curve, R2 |
|---|---|---|---|---|---|---|
| ABL1 | 25 | CCGACGTCTGGGCATTTGGAGTAT | AGGAGGGCCGGTCAGAGGGATTC | 198 | 95.048 | 0.996 |
| ACTB | 60 | CAACTGGGACGACATGGAGAAAAT | CCAGAGGCGTACAGGGATAGCAC | 207 | 71.6 | 0.993 |
| B2M | 567 | GGGTTTCATCCATCCGACATTG | ACACGGCAGGCATACTCATCTTTT | 161 | 90.14 | 0.998 |
| CDKN1A | 1026 | GCGAGGCCGGGATGAGTTGG | CCGCCGTTTTCGACCCTGAGAGT | 181 | 81.532 | 0.999 |
| GAPDH | 2597 | GGGGGAGCCAAAAGGGTCATCATCT | GAGGGGCCATCCACAGTCTTC | 236 | 75.592 | 0.991 |
| HMBS* | 3145 | CTGTTTACCAAGGAGCTGGAAC | TGAAGCCAGGAGGAAGCA | 100 | 96.413 | 1.000 |
| HPRT1 | 3251 | AAAAGCAAAATACAAAGCCTAAGATGAG | CTACTAAGCAGATGGCCACAGAACTA | 119 | 82.525 | 0.995 |
| HSP90AB1 | 3326 | CCAGGCACTTCGGGACAACTC | CAAGGGAAAAGCCAGAAGATAGCA | 188 | 91.905 | 0.999 |
| IGF1R | 3480 | CCGAGAAGGAGGAGGCTGAATA | CGGGTCGGTGATGTTGTAGG | 173 | 86.753 | 0.995 |
| PPIA | 5478 | GCAGAGGGTTAAGGCGCAGACTAC | TGCAAAACCTCAAAGCCTCCATAA | 100 | 77.93 | 1.000 |
| RPL30 | 6156 | GTGGCCGCAAAGAAGACGAAAAA | CTGGGCAGTTGTTAGCGAGAATGA | 157 | 73.696 | 0.995 |
| RPL4 | 6124 | GCTCTGGCCAGGGTGCTTTTG | ATGGCGTATCGTTTTTGGGTTGTG | 115 | 96.099 | 1.000 |
| RPLP0 | 6175 | GGGGGAATGTGGGCTTTGTGT | GGTGCCCCTGGAGATTTTAGTGG | 206 | 97.92 | 0.999 |
| RPS18 | 6222 | ACGCCGCCGCTTGTGCT | AGTTCTCCCGCCCTCTTGGTGA | 199 | 96.195 | 0.998 |
| TBP | 6908 | CATGACTCCCGGAATCCCTATCTTT | TGTTGCTGCTGCTGCCTTTGTT | 126 | 95.18 | 0.994 |
| TOP2B | 7155 | GGCCTGCTTATTAATTTCATCCATC | CTGCTTATTTTTGCTTGCCTTTACA | 105 | 76.48 | 0.998 |
*Primers are from [21]
Real-time quantitative PCR and construction of external standards for absolute quantification
Quantitative RT-PCR was performed on a StepOnePlus real-time PCR system (Applied BioSystems, USA) using SYBR® green I with ROX as an internal loading standard. The qPCRmix-HS SYBR+ROX kit (Evrogen, Russia) was utilized for all reference gene qRT-PCR assays according to the manufacturer’s protocol. Each reaction contained the following: 5× qPCRmix-HS SYBR+ROX master mix (Evrogen, Russia), forward and reverse primers 0.5 μM each (Evrogen, Russia), and 500 ng template cDNA; this mixture was brought to a final volume of 20 μl with nuclease-free water. PCR cycles were run as follows: 2 min at 50 °C, then denaturation for 10 min at 95 °C followed by 40 cycles of 15 s at 95 °C, 1 min at 60 °C. Fluorescence was measured following each annealing and extension phase. Melt curve was produced to confirm a single gene-specific peak and to detect primer/dimer formation by heating the samples from 70 to 95 °C in 0.5 °C increments with a dwell time of 10 s at each temperature while continuously monitoring the fluorescence. The reactions were set up in a 96-well PCR plate (Applied BioSystems, USA) in three technical replicates.
Controls included non-RT controls (total RNA without reverse transcription was used to monitor genomic DNA contamination) and non-template controls (water template).
Absolute quantification of housekeeping gene expression
For absolute quantification, recombinant plasmid DNA was used as external standard. Recombinant plasmids were generated by PCR product insertion into pAL2-T vector using AT-cloning method with Quick-TA kit (Evrogen, Russia). Each PCR run was carried out with co-amplification of plasmid standards diluted to the following concentrations: 1000, 200, 40, 8, 1.6, 1, 0.2, 0.04, 0.008, and 0.0016 pg/μl. This allowed determining copy number of PCR products in relation to the amount of total RNA that has undergone reverse transcription and generating external calibration curves for a subset of the genes.
Data analysis
Statistical significance of DNA amount differences between samples was calculated by the Wilcoxon signed rank test using the GraphPad Prism 5 software (GraphPad Software, Inc., USA). To test the hypothesis of normal distribution, Shapiro-Wilk normality test was used. The Shapiro-Wilk normality test was performed using Statistica 7.0 software (Dell, Inc., USA). For the analysis of differences between intact and vitrified/thawed groups of ovarian tissue samples, Wilcoxon matched pairs signed rank test was applied because no normal distribution was observed for the expression of each gene. Also, the Wilcoxon signed rank test was used to analyze the protein expression differences. Differences were considered statistically significant if p < 0.05. To find interrelations in the expression levels of studied genes, Spearman’s rank correlation coefficient was calculated. The expression stability of 16 selected internal control genes was evaluated by three commonly used freeware software tools: geNorm v.3.5 [14], Bestkeeper [15], and NormFinder [16].
Western blot
Tissue samples were homogenized in RIPA buffer, and protein concentration was measured by the BCA Pierce™ BCA Protein Assay Kit (Thermo Scientific). Samples were denatured at 95 °C for 5 min in Laemmli sample buffer consisting of 2% SDS, 10% glycerol, 5% mercaptoethanol, 62.5 mM Tris (pH 6.8), and 0.004% bromophenol blue. Proteins were separated by 10% sodium dodecyl sulfate polyacrylamide gel electrophoresis (SDS-PAGE) and then electrophoretically transferred onto Immun-Blot® PVDF Membrane (Bio-Rad). Loading normalization was accomplished by Ponceau-S staining of each Western blot lane on the membrane [20]. The Ponceau-S was then removed by washing with PBS buffer. The membranes were blocked with 5% nonfat dry milk for 1 h and incubated overnight at 4 °C with primary monoclonal antibodies: mouse anti-ACTB (Sigma-Aldrich A5441; 1:5000), rabbit anti-GAPDH (Cell Signaling Technology #2118; 1:5000), and rat anti-HSP90 (Enzo ADI-SPA-835; 1:2000). After washing five times in PBST, the membranes were incubated for 1 h at room temperature with horseradish peroxidase-conjugated secondary polyclonal goat antibodies. Membranes which were previously incubated with primary monoclonal antibodies mouse anti-ACTB were placed into the solution with secondary polyclonal goat antibodies anti-mouse IgG (Jackson ImmunoResearch Laboratories 115-035-003; 1:50000). Membranes which were previously incubated with primary monoclonal antibodies rabbit anti-GAPDH were placed into the solution with secondary polyclonal goat antibodies anti-rabbit IgG (Jackson ImmunoResearch Laboratories 111–035-144; 1:50000). Membranes which were previously incubated with primary monoclonal antibodies rat anti-HSP90 were placed into the solution with secondary polyclonal goat antibodies anti-rat IgG (Santa Cruz Biotechnology sc-2032; 1:10000) After washing five times in PBST, conjugated antibodies were visualized using enhanced chemiluminescence in 0.1 М Tris-HCl, pH 8.5, 12.5 mМ luminol, 2 mМ coumaric acid, and 0.09% Н2О2. The intensity of protein bands was measured using ChemiDoc™ Imaging System (Bio-Rad) and Image Lab Software (Bio-Rad). Expression levels were normalized to total protein measured by Ponceau-S staining. The mean value of protein expression in an intact group was taken equal to 1.0.
Results
Absolute quantification of housekeeping gene expression
The primary analysis was performed using the method of constructing a standard curve and absolute quantification in relation to the amount of total RNA. The parameters of the standard curves constructed, as well as the PCR efficiency values, are given in Table 2. GAPDH showed the highest expression level (709,221 copies/μg total RNA). ABL1 showed the lowest expression level (2029 copies/μg total RNA). Coefficient of variation was the lowest for GAPDH (18.32%), TBP (29.62%), and HPRT (32.66%) and the highest for CDKN1A (121.95%), ABL1 (107.66%), and TOP2B (99.5%).
Table 2.
Statistical analysis of reference gene expression levels
| Gene | Q mean (copy number/μg total RNA) | Standard deviation | Coefficient of variation (%) | Wilcoxon matched pairs signed rank test p value* |
|---|---|---|---|---|
| ABL1 | 2029 | 1.370 | 107.66 | 0.0313 |
| ACTB | 634,975 | 1.000 | 64.47 | 0.0313 |
| B2M | 163,912 | 1.220 | 85.74 | 0.0313 |
| CDKN1A | 2767 | 2.300 | 121.95 | 0.4375 |
| GAPDH | 709,221 | 0.270 | 18.32 | 0.8438 |
| HMBS | 13,741 | 0.780 | 60.86 | 0.2188 |
| HPRT | 16,050 | 0.460 | 32.66 | 0.6875 |
| HSP90AB1 | 29,767 | 0.720 | 55.10 | 0.0313 |
| IGF1R | 3380 | 0.900 | 71.15 | 0.0625 |
| PPIA | 2671 | 0.530 | 34.11 | 0.1563 |
| RPL30 | 72,917 | 2.110 | 58.84 | 0.0313 |
| RPL4 | 225,242 | 0.840 | 65.81 | 0.0313 |
| RPLP0 | 111,446 | 0.580 | 46.24 | 0.0313 |
| RPS18 | 131,832 | 0.730 | 53.73 | 0.0313 |
| TBP | 4044 | 0.340 | 29.62 | 0.8438 |
| TOP2B | 6727 | 1.570 | 99.50 | 0.0313 |
*Wilcoxon matched pairs signed rank test p value calculated for analysis of Q mean of each gene in native and vitrified/thawed samples of ovarian tissue
Reference gene stability in native and vitrified/thawed human ovarian tissue
According to the absolute quantification, nine of analyzed housekeeping genes were significantly downregulated in vitrified/thawed samples in comparison to the native samples—ABL1, ACTB, B2M, HSP90AB1, RPL4, RPL30, RPLP0, RPS18, and TOP2B (p < 0.05). Among the other genes, GAPDH, TBP, and HPRT had the least significant differences in gene expression levels between the two groups of tissue samples (p > 0.5). The results obtained are presented in Table 2 and in Fig. 1.
Fig. 1.

Effect of vitrification procedure on transcript abundance in human ovarian tissue. The absolute expression of reference genes was analyzed before cryopreservation and after vitrification/thawing. Copy number values were calculated and normalized to initial amounts of RNA used for cDNA preparation. The number of RNA copies per microgram of total RNA is represented on Y-axis. Data obtained from six independent samples are shown as median (horizontal lines inside the boxes), interquartile range (boxes), and 5th to 95th percentile (horizontal lines outside the boxes). Asterisks indicate that there are statistically significant differences between groups (p < 0.05)
We analyzed data obtained for each of the reference genes with GeNorm, BestKeeper, and NormFinder software utilities. Moreover, coefficient of variation was calculated for the expression levels of each gene selected for the analysis. The main parameters which indicate gene expression stability analyzed by the abovementioned software utilities are represented in Fig. 2.
Fig. 2.

The main statistical indexes which characterize stability of gene expression. Along the Y-axis, there are the names of genes; along the X-axis, there are the values of the investigated indexes. Coefficient of variation—coefficient of variation for each investigated gene; geNorm—M values calculated by geNorm are represented; BestKeeper—coefficient of correlation to BestKeeper index calculated for each investigated gene; NormFinder—index of gene expression stability calculated for each gene by NormFinder software utility. Genes are ranked from the most stable (at the top of the diagram) to the less stable for all the diagrams which characterize different indexes of gene expression stability
The GeNorm utility ranked TBP and HPRT as the most stable genes (M value = 0.290), followed by GAPDH (M value = 0.358) and PPIA (M value = 0.387). The other genes were ranked from most to least stable as follows: RPLP0 > HSP90AB1 > RPS18 > RPL4 > ACTB > IGF1R > B2M > ABL1 > TOP2B > RPL30 > HMBS > CDKN1A.
The BestKeeper software provides two parameters that can be used for assessing the stability of the reference genes. The first one is the standard deviation of the raw Ct values. According to the obtained data, GAPDH has the most stable expression (SD = 0.27). CDKN1A, RPL30, TOP2B, ABL1, B2M, and ACTB were unstable (SD ≥ 1). The final ranking of the BestKeeper software is performed by assessing the correlation coefficient of the expression levels of each individual gene with the geometric mean of the expression levels for all genes. RPL4, RPS18, RPLP0, and HSP90AB1 were ranked as the most stable genes with the highest correlation with BestKeeper index. The other genes were ranked from most to least stable as follows: PPIA > ABL1 > TOP2B > ACTB > TBP > HPRT > GAPDH > CDKN1A > B2M > RPL30 > IGF1R > HMBS.
The NormFinder utility ranked RPLP0 as the most stable gene (0.131), followed by RPS18 (0.171), HSP90AB1 (0.18), ACTB (0.204), and RPL4 (0.216). The other genes were ranked from most to least stable as follows: IGF1R > PPIA > B2M > GAPDH > TBP > RPL30 > HPRT > ABL1 > TOP2B > CDKN1A > HMBS.
Correlative analysis was performed to evaluate the relationship between the expression levels of studied genes; it is represented in Fig. 3. It has been shown that reference genes studied in the current work can be divided into two groups based on correlation of their expression levels: the first group includes GAPDH, HPRT, PPIA, TBP, and HMBS; the second group includes all the other studied genes.
Fig. 3.

Correlation matrix calculated for expression levels of investigated 16 candidate reference genes. The bright red squares in the matrix indicate that expression levels of two genes have strong positive correlation; dark blue squares in the matrix indicate that expression levels of two genes have strong negative correlation
Evaluation of reference gene expression at the protein level
In the current study, expression levels of three reference genes (ACTB, GAPDH, and HSP90) were also measured at the protein level using Western blot analysis. Example images of Western blot for each studied gene are presented in Fig. 4. The levels of ACTB, GAPDH, and HSP90 proteins were similar in native and vitrified/thawed samples; there were no statistically significant difference in protein synthesis in two groups of samples. The boxes and whisker plots illustrating the protein synthesis in different groups of samples are given in Fig. 5.
Fig. 4.
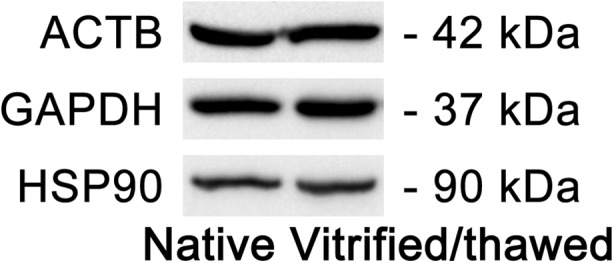
Example of Western blot analysis of three reference gene (ACTB, GAPDH, and HSP90) expression at the protein level in native and vitrified/thawed human ovarian tissue
Fig. 5.

Statistical analysis of protein expression levels of three reference genes: ACTB, GAPDH, and HSP90 in native and vitrified/thawed human ovarian tissue. Data obtained from four independent samples are shown as median (horizontal lines inside the boxes), interquartile range (boxes), and 5th to 95th percentile (horizontal lines outside the boxes). There is no statistically significant difference between groups (p > 0.05)
Discussion
An appropriate normalization of qRT-PCR data is essential for correct transcript quantification. The validity of the normalization process largely depends on the normalizer (housekeeping gene) itself. It is of great importance to select an appropriate control gene according to its property to maintain constant expression levels between samples in various experimental conditions.
In the current work, three most commonly used software tools were applied to analyze stability of gene expression: geNorm [14], BestKeeper [15], and NormFinder [16]. Unexpectedly, these utilities proposed different reference genes as most suitable in the case of human vitrified/thawed cortical ovarian tissue.
Interestingly, list of genes obtained after ranking coefficients of variation of expression levels of studied genes seems to be very close to the gene list derived from analysis of gene expression levels performed by geNorm software utility. This similarity may indicate that mathematical approach used in geNorm software shows insufficient consideration of sample variability. Furthermore, previously, it has been shown that the geNorm output is more affected by fluctuations in PCR efficiencies compared to the NormFinder analysis [21]. Another disadvantage of geNorm software utility is the impossibility of performing target gene analysis [14].
Although TBP, GAPDH, and HPRT (the most commonly used reference genes) normalized to the total RNA show low variability, the results of analysis performed by BestKeeper and Normfinder software utilities indicate that these genes are not the most stable reference genes. According to the analysis performed by BestKeeper and Normfinder software, the most stable expression in native and vitrified/thawed human cortical ovarian tissue is observed among RPL4, RPLP0, RPS18, and HSP90AB1genes. However, it was detected that RPL4, RPLP0, RPS18, HSP90AB1, and many other studied genes have reduced expression levels after normalization to the total RNA. It is known that the greatest amount of RNA in cell is represented by rRNA [11, 22] which is more stable in comparison to mRNA. We have not detected differences in the amount and the integrity of the total RNA in intact and vitrified/thawed groups of human ovarian tissue samples (data not shown). However, it has been previously shown that there is a statistically significant difference in transcript abundance in cells before and after vitrification [23–25]. Therefore, distortion of results can occur in the following cases: normalization to the total RNA or normalization to the mRNA of nonrepresentative reference gene.
Another analysis performed in the current work was evaluation of reference gene expression at the protein level by Western blotting. In this study, three reference genes were used: ACTB, GAPDH, and HSP90AB1. According to the results of qRT-PCR, ACTB and HSP90AB1 are the members of a group of genes which expression is stable in both types of samples of human ovarian tissue: native and vitrified/thawed. GAPDH belongs to the group of genes which expression show low variability when normalization to the total RNA is used. Western blot analysis has shown that levels of protein expression for all of these genes (ACTB, GAPDH, and HSP90) are similar in both intact and vitrified/thawed human ovarian tissue. Therefore, although significant changes in the mRNA expression take place, the levels of proteins in the cells of intact and vitrified/thawed human ovarian tissue remain constant. This is due to the fact that proteins are more resistant to the vitrification/thawing procedures than mRNA. Taking into consideration the abovementioned results, it can be assumed that evaluation of mRNA expression levels is the most appropriate method to assess the quality of vitrification/thawing procedures and to select suitable reference genes.
The development of a system allowing to assort appropriate reference genes is a primary purpose in this field of research. Application of unsuitable reference genes can lead to distortion of research results. Nowadays, many approaches enabling to select the most correct reference genes are developed. GeNorm [14], BestKeeper [15], and NormFinder [16] are the commonly used software utilities which allow to solve this task. In the current work, it has been shown that the BestKeeper and the Normfinder software seem to be the most efficient for determining highly stable reference genes. It has been shown that the most stable reference genes in the case of vitrified/thawed human ovarian cortical tissue are RPL4, RPLP0, RPS18, and HSP90AB1.
It is important to notice that list of the most stable reference genes obtained in the current work for human ovarian cortical tissue differs from that list derived from the similar experiments carried out on the murine cryopreserved and thawed ovarian tissue [13]. Therefore, specific selection of the most suitable reference genes for the further analysis should be performed for each species and kind of tissue. Moreover, researches should take into account that application of only one reference gene for analysis can lead to distortion of research results because the fluctuations in gene expression levels always take place. The best way to avoid such issues is to calculate especial index based on several reference genes and then analyze changes in expression of target genes. This approach allows to minimize the influence of the fluctuations in expression levels of each individual gene. Nowadays, BestKeeper [14] and NormFinder [15] software utilities allow to perform the type of analysis discussed above. Application of novel methods providing selection of the appropriate reference genes remains a major challenge for many research groups. Therefore, new publications dedicated to this subject can be expected in the near future.
Acknowledgements
We thank Filatova Polina for language editing and proofreading. The research was done using equipment of the Core Centrum of Institute of Developmental Biology RAS.
Study funding
The qRT-PCR analysis in this study was funded by the Russian Science Foundation (project no. 14-50-00029). Western blot analysis was supported by the Russian Foundation for Basic Research (project no. 16-34-60250 mol_a_dk).
Conflict of interest
The authors declare that they have no conflict of interest.
Informed consent
Informed consent was obtained from all individual participants included in the study.
Ethical approval
All procedures performed in studies involving human participants were in accordance with the ethical standards of the institutional research committee and with the 1964 Helsinki declaration and its later amendments or comparable ethical standards.
References
- 1.Meirow D, Nugent D. The effects of radiotherapy and chemotherapy on female reproduction. Hum Reprod Update. 2001;7:535–543. doi: 10.1093/humupd/7.6.535. [DOI] [PubMed] [Google Scholar]
- 2.Filatov MA, Khramova YV, Kiseleva MV, Malinova IV, Komarova EV, Semenova ML. Female fertility preservation strategies: cryopreservation and ovarian tissue in vitro culture, current state of the art and future perspectives. Zygote. 2016;24:635–653. doi: 10.1017/S096719941600006X. [DOI] [PubMed] [Google Scholar]
- 3.Abdollahi M, Salehnia M, Salehpour S, Ghorbanmehr N. Human ovarian tissue vitrification/warming has minor effect on the expression of apoptosis-related genes. Iran Biomed J. 2013;17:179–186. doi: 10.6091/ibj.1243.2013. [DOI] [PMC free article] [PubMed] [Google Scholar]
- 4.Fatehi R, Ebrahimi B, Shahhosseini M, Farrokhi A, Fathi R. Effect of ovarian tissue vitrification method on mice preantral follicular development and gene expression. Theriogenology. 2014;81:302–308. doi: 10.1016/j.theriogenology.2013.09.029. [DOI] [PubMed] [Google Scholar]
- 5.Tsai YC, Tzeng CR, Wang CW, Hsu MI, Tan SJ, Chen CH. Antiapoptotic agent sphingosine-1-phosphate protects vitrified murine ovarian grafts. Reprod Sci. 2014;21:236–243. doi: 10.1177/1933719113493515. [DOI] [PMC free article] [PubMed] [Google Scholar]
- 6.Jafarabadi M, Abdollahi M, Salehnia M. Assessment of vitrification outcome by xenotransplantation of ovarian cortex pieces in γ-irradiated mice: morphological and molecular analyses of apoptosis. J Assist Reprod Genet. 2015;32:195–205. doi: 10.1007/s10815-014-0382-1. [DOI] [PMC free article] [PubMed] [Google Scholar]
- 7.Shams Mofarahe Z, Ghaffari Novin M, Jafarabadi M, Salehnia M, Noroozian M, Ghorbanmehr N. Effect of human ovarian tissue vitrification/warming on the expression of genes related to folliculogenesis. Iran Biomed J. 2015;19:220–225. doi: 10.7508/ibj.2015.04.005. [DOI] [PMC free article] [PubMed] [Google Scholar]
- 8.Bustin SA, Benes V, Nolan T, Pfaffl MW. Quantitative real-time RT-PCR—a perspective. J Mol Endocrinol. 2005;34:597–601. doi: 10.1677/jme.1.01755. [DOI] [PubMed] [Google Scholar]
- 9.Kozera B, Rapacz M. Reference genes in real-time PCR. J Appl Genet. 2013;54:391–406. doi: 10.1007/s13353-013-0173-x. [DOI] [PMC free article] [PubMed] [Google Scholar]
- 10.Chapman JR, Waldenström J. With reference to reference genes: a systematic review of endogenous controls in gene expression studies. PLoS One. 2015;10:e0141853. doi: 10.1371/journal.pone.0141853. [DOI] [PMC free article] [PubMed] [Google Scholar]
- 11.Zhong H, Simons JW. Direct comparison of GAPDH, b-actin, cyclophilin, and 28S rRNA as internal standards for quantifying RNA levels under hypoxia. Biochem Biophys Res Commun. 1999;259:523–526. doi: 10.1006/bbrc.1999.0815. [DOI] [PubMed] [Google Scholar]
- 12.Selvey S, Thompson EW, Matthaei K, Lea RA, Irving MG, Griffiths LR. Beta-actin—an unsuitable internal control for RT-PCR. Mol Cell Probes. 2001;15:307–311. doi: 10.1006/mcpr.2001.0376. [DOI] [PubMed] [Google Scholar]
- 13.Yuanyuan S, Qin S, Rongrong X, Yujing G, Chengbin P, Jianjun M, Yanzhou Y, Xiuying P. Reference gene selection for real-time quantitative PCR analysis on ovarian cryopreservation by vitrification in mice. J Assist Reprod Genet. 2015;32:1277–1284. doi: 10.1007/s10815-015-0503-5. [DOI] [PMC free article] [PubMed] [Google Scholar]
- 14.Vandesompele J, De Preter K, Pattyn F, Poppe B, Van Roy N, De Paepe A, Speleman F. Accurate normalization of real-time quantitative RT-PCR data by geometric averaging of multiple internal control genes. Genome Biol. 2002;3:RESEARCH0034. doi: 10.1186/gb-2002-3-7-research0034. [DOI] [PMC free article] [PubMed] [Google Scholar]
- 15.Pfaffl MW, Tichopad A, Prgomet C, Neuvians TP. Determination of stable housekeeping genes, differentially regulated target genes and sample integrity: BestKeeper—Excel-based tool using pair-wise correlations. Biotechnol Lett. 2004;26:509–515. doi: 10.1023/B:BILE.0000019559.84305.47. [DOI] [PubMed] [Google Scholar]
- 16.Andersen CL, Jensen JL, Ørntoft TF. Normalization of real-time quantitative reverse transcription-PCR data: a model-based variance estimation approach to identify genes suited for normalization, applied to bladder and colon cancer data sets. Cancer Res. 2004;64:5245–5250. doi: 10.1158/0008-5472.CAN-04-0496. [DOI] [PubMed] [Google Scholar]
- 17.Kiseleva M, Malinova I, Komarova E, Shvedova T, Chudakov K, Kaprin A. The first Russian case of pregnancy after orthotopic transplantation of vitrified ovarian tissue. Gynecol Endocrinol. 2015;31(Suppl 1):91–92. doi: 10.3109/09513590.2015.1086518. [DOI] [PubMed] [Google Scholar]
- 18.Kiseleva M, Malinova I, Komarova E, Shvedova T, Chudakov K. The Russian experience of autotransplantation of vitrified ovarian tissue to a cancer patient. Gynecol Endocrinol. 2014;30(Suppl 1):30–31. doi: 10.3109/09513590.2014.945781. [DOI] [PubMed] [Google Scholar]
- 19.Yuzhakov VV, Malinova IV, Kiseleva MV, Fomina NK, Bandurko LN, Komarova EV, Sevan’kaeva LE, Ingel' IE, Yakovleva ND, Kaprin AD. Effect of vitrification on functional morphology and viability of the ovarian tissue. Bull Exp Biol Med. 2018;164:502–507. doi: 10.1007/s10517-018-4021-1. [DOI] [PubMed] [Google Scholar]
- 20.Aldridge GM, Podrebarac DM, Greenough WT, Weiler IJ. The use of total protein stains as loading controls: an alternative to high-abundance single-protein controls in semi-quantitative immunoblotting. J Neurosci Methods. 2008;172:250–254. doi: 10.1016/j.jneumeth.2008.05.003. [DOI] [PMC free article] [PubMed] [Google Scholar]
- 21.De Spiegelaere W, Dern-Wieloch J, Weigel R, Schumacher V, Schorle H, Nettersheim D, Bergmann M, Brehm R, Kliesch S, Vandekerckhove L, Fink C. Reference gene validation for RT-qPCR, a note on different available software packages. PLoS One. 2015;10:e0122515. doi: 10.1371/journal.pone.0122515. [DOI] [PMC free article] [PubMed] [Google Scholar]
- 22.Bhatia P, Taylor WR, Greenberg AH, Wright JA. Comparison of glyceraldehyde-3-phosphate dehydrogenase and 28S-ribosomal RNA gene expression as RNA loading controls for Northern blot analysis of cell lines of varying malignant potential. Anal Biochem. 1994;216:223–226. doi: 10.1006/abio.1994.1028. [DOI] [PubMed] [Google Scholar]
- 23.Azari M, Kafi M, Ebrahimi B, Fatehi R, Jamalzadeh M. Oocyte maturation, embryo development and gene expression following two different methods of bovine cumulus-oocyte complexes vitrification. Vet Res Commun. 2017;41:49–56. doi: 10.1007/s11259-016-9671-8. [DOI] [PubMed] [Google Scholar]
- 24.Wang N, Li CY, Zhu HB, Hao HS, Wang HY, Yan CL, Zhao SJ, Du WH, Wang D, Liu Y, Pang YW, Zhao XM. Effect of vitrification on the mRNA transcriptome of bovine oocytes. Reprod Domest Anim. 2017;52:531–541. doi: 10.1111/rda.12942. [DOI] [PubMed] [Google Scholar]
- 25.Succu S, Bebbere D, Bogliolo L, Ariu F, Fois S, Leoni GG, Berlinguer F, Naitana S, Ledda S. Vitrification of in vitro matured ovine oocytes affects in vitro pre-implantation development and mRNA abundance. Mol Reprod Dev. 2008;75:538–546. doi: 10.1002/mrd.20784. [DOI] [PubMed] [Google Scholar]