

Summary
Ribonucleoprotein (RNP) granules play an important role in organizing eukaryotic mRNA metabolism via liquid-liquid phase separation (LLPS) of mRNA decay factors into membrane-less organelles in the cytoplasm. Here we show that the bacterium Caulobacter crescentus Ribonuclease (RNase) E assembles RNP LLPS condensates that we term bacterial RNP-bodies (BR-bodies) similar to eukaryotic P-bodies and stress granules. RNase E requires RNA to assemble a BR-body, and disassembly requires RNA cleavage, suggesting BR-bodies provide localized sites of RNA degradation. The unstructured C-terminal domain of RNase E is both necessary and sufficient to assemble the core of the BR-body, is functionally conserved in related α-proteobacteria, and influences mRNA degradation. BR-bodies are rapidly induced under cellular stresses and provide enhanced cell growth under stress. To our knowledge, Caulobacter RNase E is the first bacterial protein identified that forms LLPS condensates, providing an effective strategy for subcellular organization in cells lacking membrane-bound compartments.
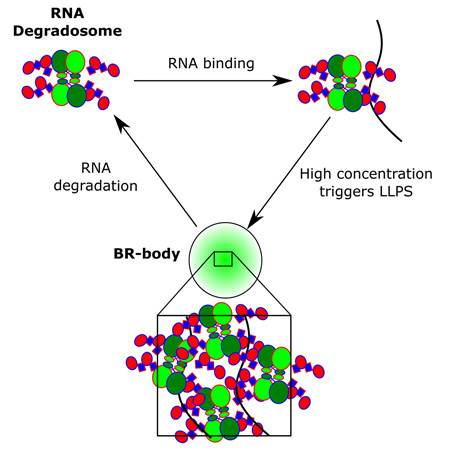
Graphical Abstract
Introduction
mRNA turnover provides an essential pathway in the control of gene expression across the domains of life. The most common bacterial protein controlling mRNA turnover is RNase E, which is conserved in approximately half of all bacteria (Ait-Bara and Carpousis, 2015; Mohanty and Kushner, 2016). In the γ-proteobacteria E. coli (Eco) RNase E is a membrane tethered protein whose membrane anchoring sequence is required for its ability to localize into short-lived membrane anchored foci (Khemici et al., 2008; Strahl et al., 2015; Taghbalout and Rothfield, 2007). In the α-proteobacteria Caulobacter crescentus (Ccr) RNase E was instead found to localize into patchy foci within the nucleoid filled cytoplasm (Bayas et al., 2018; Montero Llopis et al., 2010). The Ccr RNase E protein also scaffolds an RNA degradosome multi-protein complex containing the DEAD-box RNA helicase RhlB, the metabolic enzyme Aconitase, the exonuclease PNPase, and the exonuclease RNase D (Hardwick et al., 2011; Vosset al., 2014). The functional role of Ccr’s cytoplasmic RNase E foci and their role in the subcellular organization of the Ccr RNA degradosome has remained unclear.
In eukaryotes, enzymes involved in mRNA turnover are organized in discrete cytoplasmic ribonucleoprotein (RNP) granules termed processing-bodies (P-bodies) or stress granules where mRNAs can be stored or degraded (Parker and Sheth, 2007). Interestingly, P-bodies and stress granules contain Xrn1, an eukaryotic exonuclease whose catalytic activity controls mRNA turnover (Kedersha et al., 2005), a key cellular function that is shared by RNase E (Hammarlof et al., 2015; Ono and Kuwano, 1979). P-bodies are conserved in eukaryotes from yeast to humans and require intrinsically disordered domains to facilitate assembly into discrete cytoplasmic liquid-liquid phase separated (LLPS) biomolecular condensates (henceforth condensates) (Banani et al., 2017; Courchaine et al., 2016; Parker and Sheth, 2007). Importantly, LLPS RNP bodies provide membrane-less intracellular compartments to organize the mRNA turnover process in the eukaryotic cytoplasm and are thought to function as membrane-less organelles (Banani et al., 2017; Brangwynne et al., 2009; Courchaine et al., 2016). Such membrane-less organelles exist in other cellular contexts such as nucleoli, cajal bodies, stress granules, and nuclear bodies, yet no such structures have been identified in bacterial cells (Banani et al., 2017; Boeynaems et al., 2018; Brangwynne, 2013; Courchaine et al., 2016).
Here we provide evidence that Ccr RNase E assembles bacterial RNP bodies (BR-bodies) that share many similarities with eukaryotic P-bodies and stress granules. Ccr RNase E forms RNA dependent bodies via its intrinsically disordered CTD which is both necessary and sufficient for BR-body assembly. Alternating blocks of positive and negative charges are needed for self-assembly and are present across all α-proteobacterial RNase E CTDs where BR-bodies are functionally conserved. Ccr RNase E BR-bodies are dynamic under log-growth conditions and RNA cleavage by RNase E is required for their dissociation, suggesting BR-bodies provide active sites of RNA cleavage. Like Xrn1 in P-bodies and stress granules, Ccr RNase E can also co-assemble with RNA into LLPS condensates that recruit other mRNA decay clients into BR-bodies. BR-bodies likely play an important role in facilitating mRNA decay as BR-bodies compete with translating ribosomes for mRNA substrates and RNase E mutants lacking the CTD are defective in degradation of an RNase E controlled mRNA. Finally, the assembly of RNase E based BR-bodies is rapidly induced by certain cell stresses and the ability to assemble BR-bodies gives Ccr cells enhanced stress resistance. The identification of BR-bodies suggests that the organization of mRNA degradation machinery into membrane-less organelles is more widespread than previously appreciated. To our knowledge, this is the first bacterial RNP-body found to be assembled by a LLPS condensate, and LLPS may provide an important general mechanism for organizing biochemical reactions in bacterial membrane-less organelles.
Results
mRNA dependent foci formation of α-proteobacterial RNase E
To investigate whether Ccr RNase E shares the ability to assemble RNP granules, like the eukaryotic Xrn1 exonuclease, an RNase E-YFP fusion strain was visualized under log growth conditions and after depletion of cellular mRNA. As noted (Montero Llopis et al., 2010), Ccr RNase E-YFP localizes into patchy foci within the cytoplasm (Fig 1A). Cells in all stages of the cell cycle contain these patchy foci with significant cell to cell variability in position, number (0–5/cell), and intensity of foci (Fig 1A). The observed foci do not appear to be a result of the YFP tag’s propensity to aggregate (Landgraf et al., 2012), as monomeric superfolder GFP tagged RNase E and untagged RNase E localizes into similar patchy foci (Fig S1A,B). To examine whether the presence of mRNA was required for the RNase E foci to form, cells were treated with high levels of rifampicin (100µg/mL) to rapidly deplete cellular mRNAs without disrupting the protein level of RNase E-YFP. Treatment of rifampicin for 30′ significantly diminished RNase E-YFP fluorescent foci while the total cell intensity of YFP signal remains similar (Fig 1A,S1C,D) (Bayas et al., 2018). The loss in RNase E-YFP foci upon rifampicin treatment suggests that mRNA is indeed required for RNase E foci to assemble.
Figure 1.
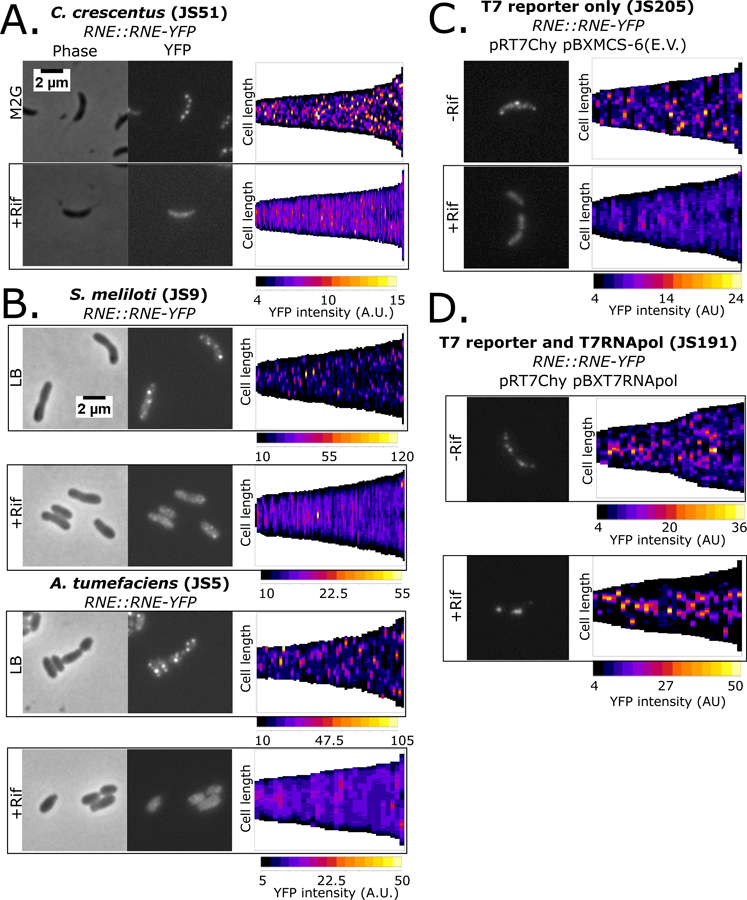
α-proteobacterial RNase E assembles mRNA dependent foci. A.) Localization patterns for RNase E – YFP strain grown in M2G minimal media. Demograph displays the YFP intensity as a heat map across the long axis of single cells as vertical slices arranged by cell length (generated with microbeJ). B.) Localization patterns for log phase Sme 1021 or Atu C58 RNase E – YFP strains. C.) Localization patterns for Ccr cells expressing RNase E – YFP containing a T7 polymerase driven mCherry reporter plasmid (pRT7Chy) and a pBX empty vector plasmid (pBXMCS-6). D.) Localization patterns for Ccr cells expressing RNase E – YFP containing a pBX plasmid with rifR T7 polymerase (pBXT7RNApol) and a T7 driven mCherry reporter plasmid (pRT7Chy).
RNase E is conserved in all α-proteobacterial genomes and its ability to assemble BR-bodies in other α-proteobacteria was examined. RNase E-YFP fusions in Sinorhizobium meliloti (Sme) and Agrobacterium tumefaciens (Atu) were generated and their subcellular localization patterns examined. Sme and Atu RNase E-YFP yielded a similar pattern of YFP foci to that of Ccr (Fig 1A,B). Of note, there appear to be fewer RNase E-YFP foci per cell in Sme than in Ccr or Atu (Fig 1B,S1E-G). The foci range in size from a median width of 0.2µm for Ccr to 0.4µm in Sme and Atu (Fig S1G), all on the same size scale as eukaryotic P-bodies and stress granules (Wheeler et al., 2016). Importantly, both Atu and Sme RNase E foci disperse after a 30′ treatment with rifampicin, suggesting RNase E-YFP foci also require mRNA in Atu and Sme (Fig 1,S1F).
In addition to its blockage of transcription and subsequent depletion of cellular mRNA, rifampicin treatment also disrupts chromosome structure (Le et al., 2013). Therefore, rifampicin treatment data alone do not distinguish which cellular effect (mRNA depletion or disruption of chromosome structure) was responsible for the abolishment of the RNase E YFP foci. To determine which cellular effect is the cause of the loss of RNase E foci, the rifampicin resistant T7 RNA polymerase system was utilized to produce mRNAs in the presence of rifampicin (Strahl et al., 2015). The rifampicin resistant T7 RNA polymerase was introduced into Ccr on a high copy pBX replicating plasmid together with a low copy replicating plasmid containing a T7 driven mCherry gene and a chromosomally tagged RNase E-YFP (Fig S1H). Ccr cells harboring the T7 promoter mCherry plasmid and a pBX-empty vector plasmid had rifampicin sensitive RNase E foci as observed in the wild type strain (Fig 1C,S1I). In cells containing both the T7 promoter driven mCherry plasmid and the T7 RNA polymerase containing pBX plasmids, robust RNase E foci with increased numbers were observed (Fig 1D,S1I), likely due to higher mRNA concentration in the cells. Upon treatment with rifampicin, which disrupts chromosome structure but does not affect transcription of the T7 driven mCherry mRNA, robust RNase E foci were observed composed of nearly all the RNase E in the cell with localization near the 1/3 and 2/3 points along the long cell axis (Fig 1D,S1I) where the reporter plasmids have been found to localize (Kahng and Shapiro, 2003). These data show that the abolishment of RNase E foci by rifampicin is a result of the depletion of cellular mRNAs and not the disruption of chromosome structure.
The intrinsically disordered CTD is necessary and sufficient for LLPS
Ccr RNase E is composed of two major protein domains, the catalytic N-terminal Domain (NTD), which is essential for cellular viability (Christen et al., 2011) and its sequence is highly conserved across bacterial species, and a poorly conserved CTD (Fig 2A,S2A). The NTD contains the S1 RNA binding domain that unwinds folded mRNA substrates near the active site, the active site within the DNase I domain, and the 5′ monophosphate sensor domain, while the CTD contains an intrinsically disordered region with conserved Arg-rich RNA binding sites (Fig S2A,S3A). When the CTD region was deleted from RNase E the protein became diffuse throughout the cytoplasm (Fig 2A,S3B-D), showing that the CTD is necessary for assembly into foci. In contrast, when the NTD was deleted robust foci formation was observed as with the full-length protein (Fig 2A,S3B-D).
Figure 2.
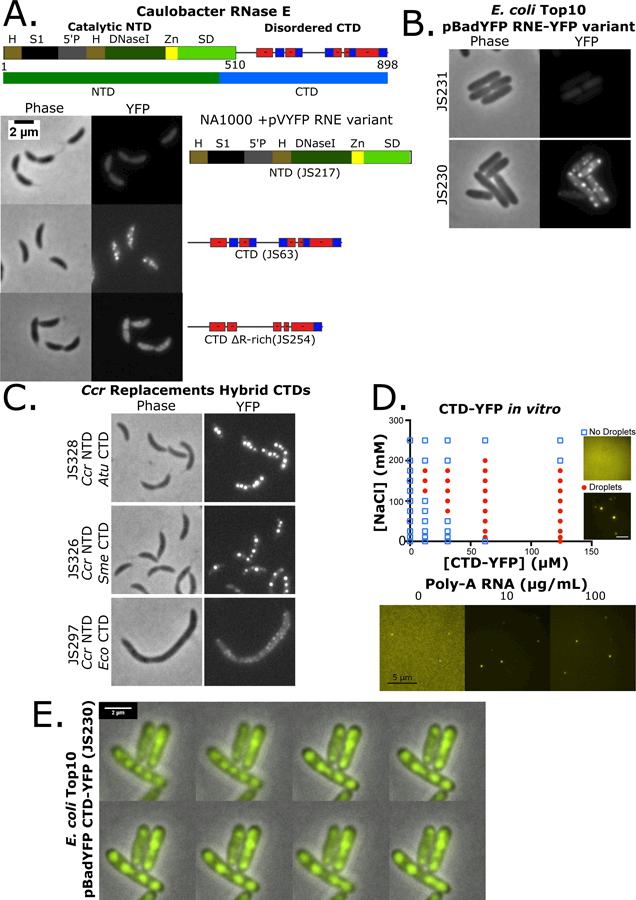
α-proteobacterial RNase E CTD is required for BR-body assembly into liquid-liquid phase separated condensates. A.) Domain architecture for the Ccr RNase E protein (Hardwick et al., 2011). The catalytic N-terminal domain (NTD, 1–450 amino acids) and disordered C-terminal domain (CTD, 451–898) are highlighted. H= RNase H domain, S1= ribosomal protein S1 domain, 5′P = 5′ monophosphate sensor domain, DNaseI= Catalytic region, Zn = Zinc link, SD= small domain, and AR= Arginine rich RNA binding sites. Positive and negative charged patches are indicated with red and blue boxes. Subcellular localization patterns in Ccr of the YFP tagged mutants of RNase E as indicated. B.) Heterologous subcellular localization patterns of Ccr RNase E in Eco cells with the YFP tagged mutants of RNase E as indicated. C.) RNase E CTD domain fusions with the CTD domains from Atu, Sme, or Eco fused to the Ccr NTD in RNase E replacement strains. D.) Phase diagram of purified Ccr RNase E CTD-YFP incubated at the indicated concentrations of protein and NaCl. LLPS condensate phase boundary is indicated by red circles. Right, condensates were formed with addition of the indicated concentrations of poly-A RNA at 100mM NaCl and 12.4 µM CTD-YFP. E.) Time-lapse images of JS230 showing condensate droplet fusion. Images were taken at 1′ intervals and the white arrows indicate the two BR-bodies that fuse.
One striking feature of the disordered C-terminus is that the charged residues are organized as clustered blocks of negative and positive charge across the CTD (Fig 2A,S2C). Each block is 10–30 residues long with a sliding net charge per 10 amino acids that range from +2 to +8 for positively charged blocks and −2 to −8 for negatively charged blocks. Such amino acid organization is like the primary constituent of eukaryotic germ granules Ddx4 (Nott et al., 2015). The disruption of Ddx4’s charge patterning resulted in a loss of LLPS, suggesting that the multivalent electrostatic protein-protein interactions play an important role in self-assembly (Nott et al., 2015). To test the importance of charged blocks, the positively charged blocks were deleted from the CTD (ΔR-rich) which resulted in diffuse localization of CTD-YFP. This suggests that charged blocks and/or RNA binding capabilities are critical for foci formation (Fig 2A). Eco cells are evolutionarily distinct from Ccr and provide an in vivo test tube for the examination of the intrinsic protein localization pattern of proteins. In line with the results in Ccr cells, expression of Ccr NTD-YFP showed diffuse localization in Eco cells (Fig 2B), while the Ccr CTD in Eco cells showed robust rifampicin sensitive Ccr CTD-YFP foci (Fig 2B,S3D). Collectively, these data show that the Ccr RNase E CTD is also sufficient for foci formation in a RNA-dependent manner.
The conservation of CTD foci formation capabilities across α-proteobacteria was then examined to explore how widespread BR-bodies are distributed. α-proteobacterial species contain a degenerate and poorly conserved CTD (Fig S2A). Despite the sequence heterogeneity, the CTD domains were predicted to contain a high degree of disorder with an alternating charge pattern across all α-proteobacterial (Fig S2D). The disordered CTDs of different species were then assayed on their ability to promote BR-body assembly in Ccr when fused to the Ccr NTD. Here, control of the expressed form of RNase E can be performed using a xylose inducible copy of the wild type RNase E gene and a vanillate inducible copy of the mutant RNase E gene (Thanbichler et al., 2007) (Fig S4A). Despite different sequence composition, the α-proteobacterial Sme or Atu CTDs robustly supported BR-body assembly when fused to the Ccr NTD (Fig 2C). The γ-proteobacterial Eco CTD which contains a membrane targeting sequence generated small weak foci that are localized at the cell membrane like the localization pattern observed in Eco cells (Strahl et al., 2015) (Fig 2C). These data show that robust cytoplasmic RNase E BR-bodies are a modular property of the α-proteobacterial CTDs, while those of γ-proteobacteria form small membrane associated foci (Strahl et al., 2015).
Many eukaryotic proteins that assemble into LLPS condensates, such as those in p-bodies and stress granules, are also able to assemble into LLPS condensates in vitro (Elbaum-Garfinkle et al., 2015b; Lin et al., 2015). The intrinsically disordered regions of these proteins are often both necessary and sufficient for in vitro condensate formation. We similarly observed that the intrinsically disordered CTD of Ccr RNase E was able to form LLPS condensates in vitro (Fig 2D,S5). The CTD condensates were sensitive to ionic strength as observed with LLPS condensates of other membrane-less organelles (Elbaum-Garfinkle et al., 2015a; Lin et al., 2015) (Fig 2D,S5C,D). Condensate assembly occurs at NaCl concentrations below 200mM and requires protein concentrations of at least 12.4µM (Fig 2D,S5C). The strong dependence of the RNase E phase boundary on the salt concentration (Fig 2D) and patterns of alternating charged residues (Fig 2A,S2C,D) suggests that electrostatics play an important role in RNase E’s self-assembly into condensates. These in vitro RNase E condensates displayed YFP intensities 1.4 to 9.5-fold higher than the dilute background (Fig S5C). Because in vivo RNase E foci required the presence of RNA it was tested whether addition of RNA could induce LLPS of the CTD-YFP protein in vitro. Addition of 5–175µg/mL poly-A RNA at a low concentration (12.4µM) of CTD-YFP induced LLPS condensates and broadened the range in salt concentration over which they assemble (Fig 2D,S5E,F). Interestingly, addition of excess poly-A RNA above 175µg/mL prevented the assembly of condensates (Fig S5E). This is likely due to stoichiometric interactions between the protein and RNA as observed in other systems (Lin et al., 2015), or could be exclusion of RNase E from poly-A rich condensates that have been shown to form at high poly-A concentrations (Van Treeck et al., 2018). This result suggests that RNase E condensate formation may also involve multivalent interactions between an RNA molecule and multiple copies of RNase E proteins. A protein variant lacking the YFP and labeled instead on cysteine residues with BODIPY-FL formed condensates over similar protein and NaCl concentrations and yielded similar stoichiometric interactions with RNA, suggesting that these properties were not a result of the YFP tag (Fig S5D). Taken together, the RNase E condensate formation’s dependence upon salt and RNA suggest that condensate formation likely involves a combination of both electrostatic protein-protein interactions and protein-RNA interactions.
To investigate whether in vivo foci fusions display liquid-like properties, time-lapse microscopy was performed on the CTD-YFP protein in Eco cells. As highlighted, Ccr CTD-YFP foci can fuse together and quickly collapse into a spherical shape increasing the size of the YFP focus (Fig 2E). Rapid change of the joining foci shape is indicative of a liquid condensate while solid protein aggregates are rigid and resist deformation. Taken together, these experiments suggest that Ccr RNase E CTD-YFP foci have the hallmark characteristics of LLPS condensates both in vitro and in vivo and that their assembly is controlled by association with RNA. Therefore, we term these RNase E LLPS condensates bacterial RNP bodies (BR-bodies).
RNase E recruits RNA degradosome components into BR-bodies
In addition to the alternating charge blocks, the CTD is also the primary scaffold for the RNA degradosome protein complex. In Ccr, the RNA degradosome complex contains RhlB, Aconitase, RNase D, and PNPase under logarithmic growth conditions (Fig 3). As the degradosome protein binding sites in the CTD are all near charged regions, it remained possible that the binding of the degradosome proteins to RNase E might physically block the charged regions from making protein-protein interactions that drive self-assembly into condensates. To differentiate if the degradosome proteins localize in BR-bodies with RNase E or outside the bodies to inhibit RNase E assembly into bodies, two fluorescent fusions were generated for RhlB and Aconitase. Both RhlB-CFP and Aconitase-Chy fusions showed patchy foci within the cytoplasm with rifampicin sensitivity (Fig S4B,C) suggesting RhlB and Aconitase likely localize in BR-bodies. To confirm that these RhlB-CFP and Aconitase-Chy foci were in BR-bodies colocalization with RNase E-YFP was assayed. RNase E-YFP foci were highly correlated with Aconitase-Chy or RhlB-CFP foci (Fig 3), suggesting that these degradosome proteins are indeed assembled into the BR-bodies.
Figure 3.
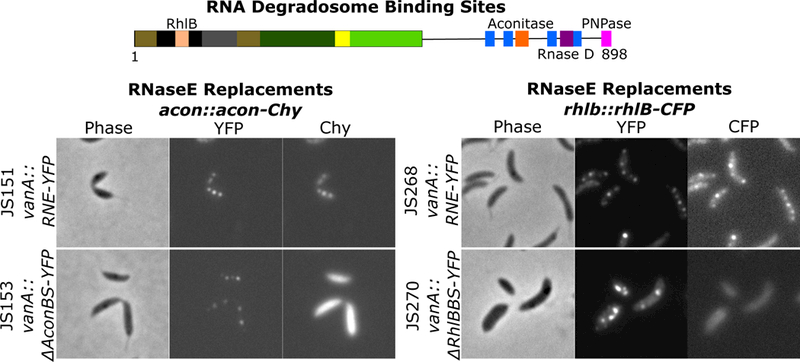
RNase E recruits degradosome components into BR-bodies. Ccr RNase E protein with the RNA degradosome binding sites highlighted (Hardwick et al., 2011; Voss et al., 2014). Replacement strains harboring YFP tagged (RNE= full length, ΔAconBS=aconitase binding site deletion, ΔRhlBBS=RhlB binding site deletion) variants under control of the vanillate promoter and a natively tagged copy of acon-Chy or RhlB-CFP.
We next tested if degradosome client proteins were required for BR-body assembly. To investigate the dependency of BR-body assembly on RNase E and degradosome components, RNase E was depleted from the cells and subcellular localization of RhlB-CFP and Aconitase-Chy was examined. Localization of RhlB-CFP and Aconitase-Chy into cytoplasmic foci were both dependent on the presence of RNase E, as depletion of RNase E from cells led to a complete loss in RhlB or Aconitase foci (Fig S4B,C). To test the dependency of RNase E assembly into BR-bodies on the degradosome proteins, RNase E deletion mutants in each of the respective degradosome protein binding sites were generated and their subcellular localization was assayed (Hardwick et al., 2011). In the aconitase and RhlB binding site deletion strains (ΔAconBS and ΔRhlBBS), the RNase E-YFP assembled robust BR-bodies; however, the Aconitase-Chy and RhlB-CFP were diffuse across the cell body (Fig 3,S4B,C), suggesting that in vivo assembly of RNase E into BR-bodies does not depend on these degradosome proteins. In addition, deletion of the PNPase binding site (ΔPnpBS) or RNase D binding site (ΔRNDBS) also yielded RNase E proteins that maintained the ability to assemble BR-bodies (Fig S4D). The ΔPnpBS and ΔAconBS mutants yielded slightly lower fluorescent protein levels (Fig S4D), possibly due to lower protein stability or expression, but still maintained the ability to form BR-bodies. Interestingly, cells expressing the ΔRhlBBS variant showed an increase in the number of BR-bodies per cell; however, these cells also displayed a significant increase in cell size with apparent defects in cell division (Fig S4D). As any single binding site mutant tested maintained the ability to assemble BR-bodies, a ΔDBS (degradosome binding site) mutant (ΔAconBS/ΔRndBS/ΔPnpBS triple mutant) was generated that lacks all the degradosome binding sites in the CTD (Fig S4D,E). The ΔDBS mutant yielded BR-bodies which were more diffuse but were similar in abundance to the wild type and maintained the ability fuse foci, suggesting LLPS (Fig S4D,E). In summary, deletion of any single degradosome binding site or a triple deletion mutant of all three degradosome binding sites in the CTD maintained the ability to assemble BR-bodies. This suggests that RNase E plays a major role in scaffolding BR-body assembly including recruitment of degradosome clients.
BR-bodies play a role in the Ccr stress response
In yeast, P-bodies and stress granules are increased rapidly upon cell stress (Brengues et al., 2005; Ramachandran et al., 2011; Shah et al., 2013). To test if BR-bodies are induced upon stress Ccr cells were subjected to several acute stresses and the subcellular distribution of RNase E-YFP was visualized. Like eukaryotes, several stresses led to an increase in the number of Ccr RNase E-YFP BR-bodies per cell and a decrease in diffuse RNase E-YFP signal including 10% ethanol, 30′ 5mM EDTA, and 5′ 42°C heat shock (Fig 4A, Table S1). Washing away the ethanol with fresh M2G resulted in rapid disassembly of the BR-bodies, suggesting that the stress-induced BR-bodies dynamically disassemble after relieving the stress (Fig S6A). Other stresses led to only minor increases in the number of Ccr RNase E-YFP BR-bodies including 5′ 0°C cold shock, 10mM H2O2, 110mM sucrose, 30′ carbon starvation, stationary phase, and 200mM NaCl (Table S1).
Figure 4.
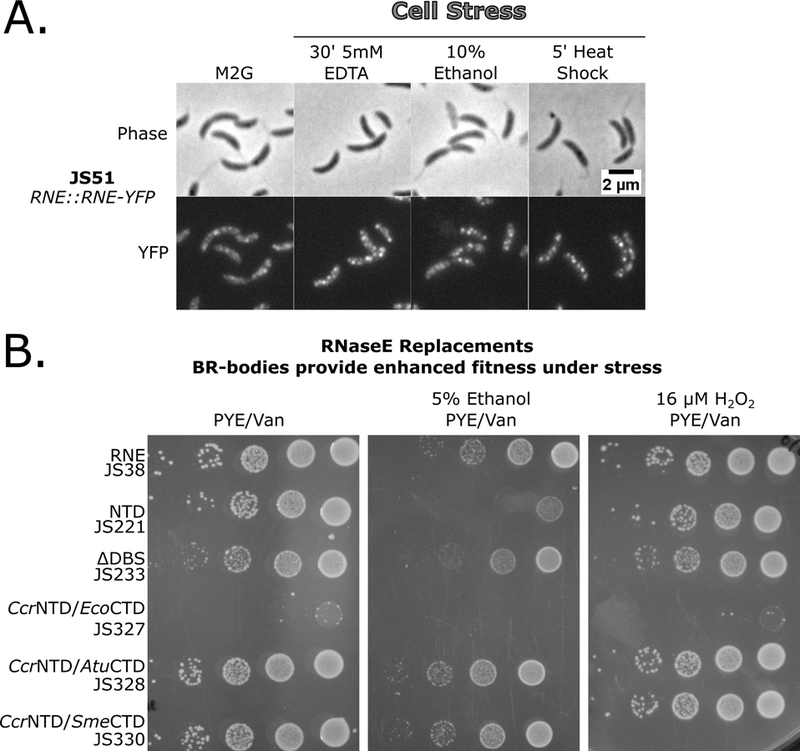
BR-body assembly is increased under specific stresses and provides increased stress tolerance. A.) Cells containing the RNase E-YFP fusion were subjected to cell stresses as indicated, gently mixed, spotted on the agarose pad, and immediately imaged. B.) BR-bodies provide enhanced survival under cell stress independent of degradosome formation. RNase E Replacement strains were grown under replacement conditions, diluted to the same OD600, and 1:10 serial dilutions were plated on PYE plates containing the selectable markers and indicated stress.
The fitness of an RNase E replacement strain expressing either the full length Ccr RNase E or the NTD which lacks the ability to assemble BR-bodies were assayed. Because the CTD contains three degradosome protein binding sites, fitness of the ΔDBS replacement strain was also assayed. This allows the distinction of effects resulting from the lack of complete degradosome formation from those resulting from a lack of BR-body assembly. Under normal growth conditions, only subtle differences in growth were observed between the full length, NTD, and ΔDBS constructs (Fig 4B) suggesting that BR-body assembly and degradosome assembly are not required for log growth. Additionally, CcrNTD/AtuCTD and CcrNTD/SmeCTD assembled into cytoplasmic BR-bodies (Fig 2C, Table S1) and grew normally but the CcrNTD/EcoCTD strain, which localizes RNase E to the inner membrane, was extremely sick. This suggests that RNase E is functional in both dilute and condensed states when localized within the nucleoid; however, when RNase E is mislocalized to the inner membrane it does not support robust Cauobacter growth.
As BR-bodies are induced upon certain stress conditions (Fig 4A), growth of these strains under strong BR-body inducing conditions (ethanol stress) and weak BR-body inducing conditions (H2O2 stress) were compared. Under strongly inducing conditions the strain expressing the NTD showed marked defects in growth as compared to cells expressing the full-length version of RNase E (Fig 4B,S6B). The stress sensitivity was specific to conditions that increased BR-body assembly, as growth on weak inducing conditions only minimally lowered growth of cells expressing the NTD (Fig 4B). Interestingly, the ΔDBS triple mutant lacking the ability to recruit multiple degradosome components while maintaining the ability to from a condensate was able to grow equivalent to wild type (Fig 4B,S4E). This result indicates BR-body formation and not degradosome assembly is critical for high fitness under stress conditions. Additionally, CcrNTD/AtuCTD and CcrNTD/SmeCTD constructs, which are able to form cytoplasmic BR-bodies (Fig 2C), but likely assemble with different degradosome components (Zhang and Hong, 2009), were also resistant to ethanol stress. This suggests that BR-bodies give Ccr cells a fitness advantage under stress independent of RNA degradosome proteins.
RNase E BR-body disassembly requires RNA cleavage
Time-lapse microscopy was performed on live cells on M2G agarose pads to examine the dynamics of RNase E-YFP foci. Under normal log-growth conditions, Ccr RNase E-YFP formed dynamic BR-bodies that assembled and disassembled within the 1′ time scale at many locations along the long cell axis (Fig 5A). Upon treatment of cells with rifampicin to deplete mRNA, RNase E-YFP BR-bodies were dramatically diminished (Fig 1A,5A). However, a small number of transient BR-bodies were observed that rapidly disassembled within 1′ (Fig 5A). To test if the cleavage of mRNA was responsible for the rapid disassembly of BR-bodies, two separate active site mutants (ASMs) in the DNase I region of RNase E were generated. One mutant is a deletion of active site residue N362 (JS138) and the other has D360N/D403N mutations (JS299), in both cases disrupting residues that chelate the catalytic Mg2+ ion (Callaghan et al., 2005). Both ASM variants displayed an increased number of BR-bodies when compared to the wild type RNase E (Table S1). The dynamics of the ASM variants were then monitored in an RNase E-YFP replacement strain where expression can be switched from the wild type RNase E to the catalytically inactive mutant using independent xylose and vanillate inducible promoters (Fig S4A). The ASM-YFP replacement strains both assembled long lived foci that were stable across the entire 10′ time lapse (Fig 5B). A replacement strain of the CTD-YFP construct, which assembles robust BR-bodies, but lacks a catalytic domain, also showed stable foci across the entire duration of the time-lapse and events of LLPS condensates fusing and growing were also observed (Fig 5B). These data show that mRNA cleavage is required for the dynamic disassembly of BR-bodies.
Figure 5.
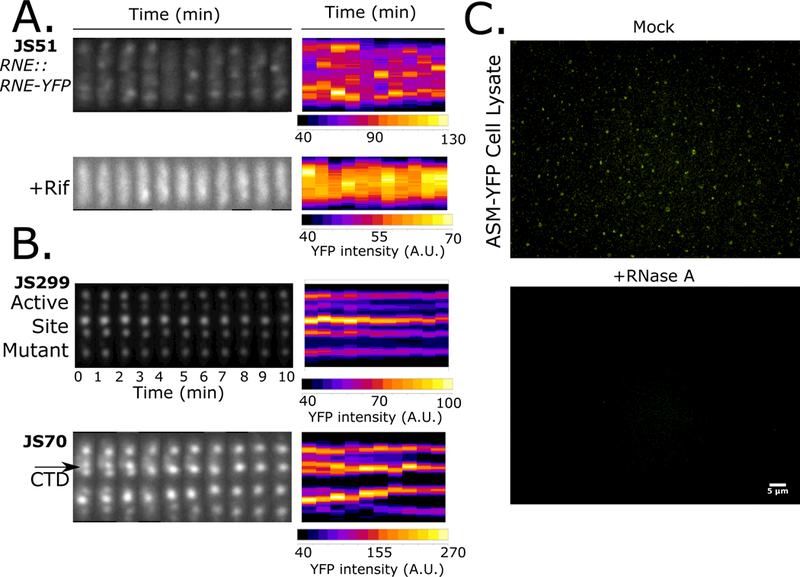
BR-bodies are dynamic and require RNA cleavage for disassembly. A.) Ccr RNase E-YFP localization patterns were monitored by time-lapse microscopy. All images were taken in 1′ intervals. A representative time-lapse from a cell is shown for each condition with the straightened cell images placed side by side (kymograph heat map generated via microbeJ). B.) Time lapse was performed in the catalytically inactive Ccr ASM and CTD replacement strains. Black arrow indicates a BR-body fusion event. C.) Lysates of the ASM-YFP replacement strain were prepared in a replacement strain. Lysates were then either treated with 0.1mg/mL RNase A or mock treated and imaged.
As rifampicin treatments suggest that RNA is required to assemble BR-bodies (Fig 5A) and the cleavage activity of RNase E is required to disassemble them (Fig 5B), the direct dependence of BR-body assembly on RNA was assayed in a cell lysate. Here a lysate of the replacement strain expressing only the ASM-YFP (JS138) was generated since it lacks the ability to cleave RNA substrates and assembles long lived foci that were predicted to remain stable after cell lysis. In ASM-YFP lysates, many BR-bodies remained associated after cell lysis for the duration of our lysis and purification procedure (Fig 5C). After treating the lysate with RNase A for 30′ the BR-bodies were no longer detectable (Fig 5C) while mock treated lysates still contained BR-bodies, further supporting the findings that BR-body formation is regulated by RNase E-RNA interactions.
Ribosomes and BR-bodies compete for mRNA substrates and affect decay
Eukaryotic mRNAs have been shown to go down competing paths: ribosomes can engage on the mRNA for translation or P-bodies can engage untranslated mRNA leading to degradation (Brengues et al., 2005). To determine if BR-bodies and ribosomes compete for mRNAs in Ccr the number of BR-bodies per cell was assayed under conditions known to alter the amount of translating and non-translating mRNA in the cell (Fig 6A,B,S7A). When cells are depleted for mRNA by rifampicin treatment, the number of BR-bodies per cell is reduced (Fig 1A,6A). Addition of translation elongation inhibitors chloramphenicol or tetracycline is known to accumulate ribosomes on mRNA, leading to a decrease in the amount of untranslated mRNA in the cell (Oh et al., 2011), which reduces the number of BR-bodies per cell (Fig 6A). Conversely, puromycin prematurely cleaves the peptide chain, releasing the ribosome subunits and mRNA and increasing the amount of untranslated mRNA in the cell, which causes an increased number of BR-bodies per cell (Fig 6A). The rate of cellular translation can also be controlled by altering the protein level of the cell’s translation initiation factors. Here, the gene for initiation factor IF3 was placed under the sole control of the xylose promoter, allowing depletion of IF3 upon switching the cells to media lacking xylose. The IF3 depletion strain showed increased abundance of BR-bodies per cell (Fig 6B,S7A) when IF3 is depleted for 8 hours, a depletion time short enough that the cells still have enough IF3 to remain viable (Fig S6D). Growth under different nutrient conditions is also known to alter the cellular rates of mRNA translation. Polysome profiling showed that in Ccr cells grown in minimal medium (M2G) have slower rates of translation than cells grown in a rich medium (PYE) and have a higher number of BR-bodies per cell (Fig S6C). The observed inverse relationship between BR-body abundance and cellular translation rates across conditions suggests that BR-bodies and ribosomes compete for mRNA substrates.
Figure 6.
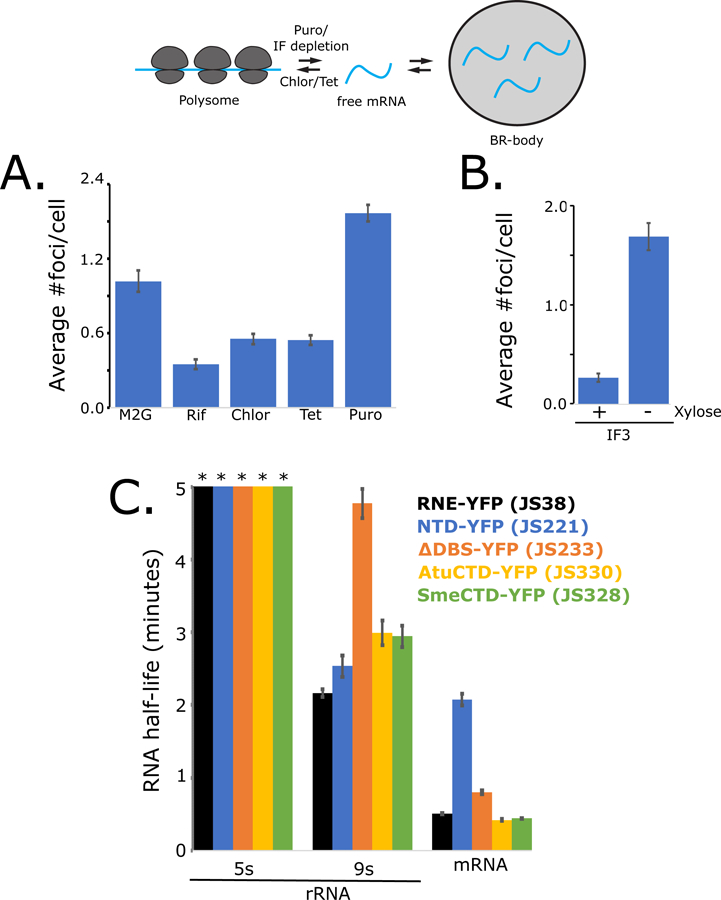
BR-bodies compete with ribosomes for untranslated mRNAs and affect mRNA turnover. A.) Number of RNase E-YFP foci per cell measured upon different translation inhibitor treatments. Error bars represent standard error. B.) Number of RNase E-YFP foci per cell measured upon depletion of translation initiation factor. Error bars represent standard error. C.) qRT-PCR measure of RNA half-life. RNA samples were taken after rifampicin treatment and measured by qRT-PCR using primers for the mature 5s rRNA, 9s pre-rRNA, and RNase E 5′ UTR of the Ccr RNase E replacement strains indicated. Error bars represent standard error of at least three replicates.
To examine the effects of BR-bodies on mRNA decay activity of RNase E, qRT-PCR assays to measure RNA half-life after rifampicin treatment were used. We explored the rate of decay of the RNase E 5′ UTR, which is known to be an mRNA substrate of RNase E (Jain and Belasco, 1995). Decay of this mRNA occurred in 0.51′ for the full-length replacement strain (JS38) while the NTD-YFP strain, which cannot form a condensate or degradosome (JS221), was delayed with a mRNA half-life of 2.1′ (Fig 6C). The ΔDBS strain, which forms a condensate (Fig S4E) but lacks the ability to recruit a complete degradosome, showed a partial restoration in mRNA decay rates (JS233, 0.80′). Replacement strains containing CTDs of Atu or Sme species (JS330, JS328), which form condensates but likely have altered degradosome protein composition (Zhang and Hong, 2009), also restored mRNA decay rates (0.42′ and 0.44′) (Fig 6C). These data were also validated by western blot using an RNase E autoregulation assay (Fig S7B,C). More subtle mutations deleting individual degradosome binding sites had no effect on mRNA decay rates (Fig 6,S7,Table S1). The acceleration of mRNA decay rates in RNase E variants that form condensates suggests that LLPS enhances the rate of mRNA decay.
The rates of 9s pre-rRNA processing were also investigated by analyzing the rate of turnover of the 9s rRNA extension which is cleaved off by RNase E to form the mature 5s rRNA. 9s pre-rRNA processing occurred with a half-life of 2.2′ for the full-length replacement strain (JS38) while the NTD-YFP strain showed a similar half-life of 2.5′ (Fig 6C). Interestingly, the half-lives increased to 4.8′ in the ΔDBS strain (JS233), 3.0′ in the Atu CTD variant (JS326), and 2.9′ in the Sme CTD variant (JS328). The slower rates of rRNA processing in these strains suggest that in BR-bodies, RNA degradosome proteins accelerate the rate of rRNA processing. Interestingly, more subtle variants lacking single degradosome binding sites had no effect on rRNA processing rates (Table S2), suggesting that the effect of the CTD degradosome proteins on the rate of rRNA processing may be redundant. Overall these results show that the ability of RNase E to form a condensate is important for accelerated mRNA decay rates, while the formation of the degradosome protein complex is likely important for processing rRNA in the BR-body. Interestingly, mature 5s rRNA and tRNAs accumulated normally in all variants (Fig S7D), suggesting that stable rRNA and tRNA processing does not strictly require BR-body or degradosome formation.
Discussion
Role of liquid-liquid phase separation in bacterial cell organization
Bacteria were once thought of as amorphous “bags of enzymes” due to the general lack of membrane-bound organelles. It has become increasingly apparent that there are many mechanisms for organizing cellular processes within the bacterial cytoplasm including diffusion and capture, cell wall curvature recognition, nucleoid occlusion, protein shell assembly, and affinity for membrane and/or cell-wall components for establishing subcellular zones to organize cellular biochemistry (Barry et al., 2014; Laloux and Jacobs-Wagner, 2014; Rudner and Losick, 2010). This report extends these bacterial organization mechanisms to include liquid-liquid phase separation of membrane-less organelles with the capacity to partition mRNA degrading enzymes and mRNA substrates into BR-bodies. Interestingly, 129 other proteins with “patchy foci” subcellular localization patterns have been observed in Ccr (Werner et al., 2009), including Aconitase which functions in the TCA cycle (Fig 3), suggesting that the LLPS mechanism of organization may be more broadly utilized across other biochemical pathways in this bacterium.
The intrinsically disordered CTD of Ccr RNase E is necessary and sufficient for LLPS condensate formation in vivo and in vitro (Fig 2) and contains patches of positively and negatively charged residues similar to eukaryotic LLPS proteins (Banani et al., 2017; Nott et al., 2015). These charged patches allow the BR-bodies to self-assemble into condensates through electrostatic interactions and the positively charged patches may also facilitate multivalent interactions with RNA, thereby allowing RNase E to increase its local concentration to accelerate ribonuclease activity (Fig 7). Interestingly, the concentration of RNase E in Caulobacter cells grown in M2G (6.3µM) is at the border of the in vitro phase boundary (Fig 2), potentially allowing tunable assembly and disassembly in the presence of untranslated mRNA. Several intrinsically disordered proteins may have properties like RNase E’s CTD; as Nott et al. predicted, several E. coli proteins have similar sequence characteristics to the condensate forming protein DDX4. One of the four proteins with similarity, DnaJ, has a diffuse localization pattern at 30°C and upon heat shock at 45°C it forms foci, suggesting DnaJ may also form a condensate (Winkler et al., 2010). Future studies are needed to understand the breadth of how and when membrane-less organelles are assembled, regulated, and used in bacteria.
Figure 7.
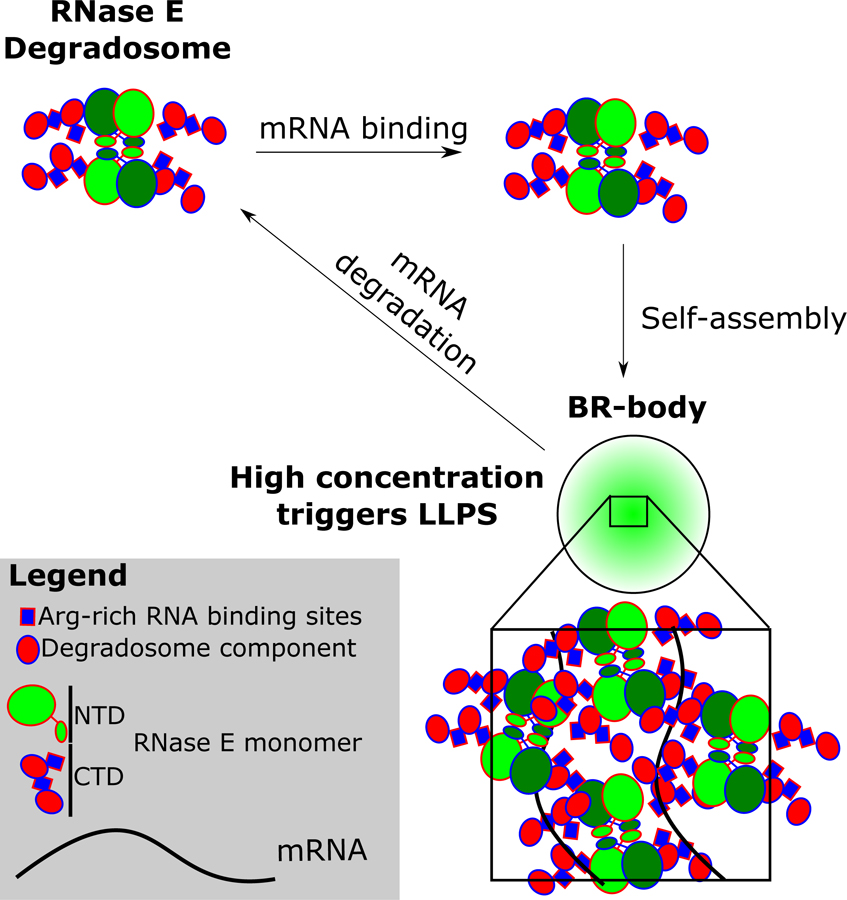
Model of Ccr RNase E BR-body assembly and disassembly. Free RNase E tetramers scaffold the RNA degradosome protein complex. In the presence of untranslated mRNA, RNA degradosomes can bind to the mRNA, increasing local concentration and causing liquid-liquid phase condensation from self-assembly of the disordered alternating charged-blocks. High local concentrations of RNase E accelerates mRNA degradation, facilitating dissolution from the BR-body.
BR-bodies – multifunctional RNP bodies
In this study α-proteobacterial cells were shown to contain LLPS BR-bodies, providing evidence that some bacterial species and eukaryotes use a similar method to organize their cellular mRNA turnover machinery (Fig 7). Eukaryotic P-bodies and stress granules and BR-bodies require RNA to assemble, require proteins with intrinsically disordered regions, are induced upon cell stress, and contain the cell’s major mRNA degrading nuclease and other mRNA decay factors. Interestingly, super resolution imaging of Ccr BR-bodies by RNase E-YFP found their size (between 0.1 to 0.4 µM) (Bayas et al., 2018) is on the same order of magnitude as those of p-bodies and stress granules (Wheeler et al., 2016). Additionally, 3D single molecule particle tracking of Ccr RNase E-YFP found that diffusion of RNase E-YFP molecules was confined, most likely within LLPS condensates, and the number of confined RNase E-YFP molecules dropped after rifampicin treatment (Bayas et al., 2018). BR-bodies and P-bodies have also been shown to compete against ribosomes for mRNA substrates (Fig 6) (Brengues et al., 2005) suggesting BR-bodies likely accumulate non-translating mRNAs. BR-bodies appear to play an important role in mRNA turnover in Ccr cells as mutants lacking the ability to form BR-bodies were found to be deficient in decay of the RNase E mRNA independent of RNA degradosome formation (Fig 6). How BR-bodies facilitate mRNA decay is still a mystery, but it remains possible that BR-body assembly helps concentrate RNase E and mRNAs increasing the reaction rates of the decay process. Non-stop decay factors such as tmRNA and SmpB were also shown to localize into discrete foci in Ccr, suggesting that non-stop decay and ribosome rescue may be performed in BR-bodies (Russell and Keiler, 2009). Yet many established functions of eukaryotic P-bodies and stress granules are still unclear in bacteria.
Like P-bodies and stress granules, BR-bodies accumulate rapidly upon certain stresses (Grousl et al., 2009; Shah et al., 2013; Teixeira et al., 2005). More similar to P-bodies, BR-bodies appear to rapidly disassemble when the stress is removed (Fig S6A), whereas stress granules have slower assembly/disassembly dynamics. Replacement of RNase E with a variant lacking the CTD (JS221) that is unable to assemble BR-bodies and led to a significant fitness defect to Ccr cells when grown under strongly inducing stress (ethanol stress) and only a mild fitness defect under weakly inducing stress (H2O2 stress) (Fig 3B). Importantly, increased cell fitness under stress was independent of the degradosome formation defects in the CTD deletion, as the ΔDBS mutant (JS233), which can assemble BR-bodies while lacking all degradosome binding sites in the CTD, grew similarly to wild type under ethanol and H2O2 stresses. This data suggests that the enhanced stress resistance is provided by BR-body assembly itself and not the formation of the degradosome protein complex.
While the eukaryotic nuclease Xrn1 has its main function in cytoplasmic mRNA decay, Ccr RNase E functions in mRNA decay in addition to rRNA processing (Hardwick et al., 2011) and tRNA processing (Ow and Kushner, 2002). BR-bodies are a multifunctional “swiss army knife,” RNP body, encompassing functions of P-bodies, stress granules, and the nucleolus within a single entity. In another study, BR-bodies were found to assemble at significant levels adjacent to both rRNA loci (Bayas et al., 2018) on the chromosome where RNase E may facilitate cotranscriptional 9s rRNA processing (Hardwick et al., 2011) bearing similarity to the LLPS eukaryotic nucleolus (Courchaine et al., 2016). Additionally, RNase D is a component of the Ccr degradosome and it plays a role in tRNA 3′ end maturation, suggesting that tRNA processing may occur in BR-bodies as well. Surprisingly, replacement of RNase E with the CTD deletion variant which cannot form BR-bodies still led to normal accumulation of mature 5s rRNA and tRNAs, suggesting that BR-bodies are not essential for stable RNA processing (Fig 4B,S7D).
BR-bodies can assemble with RNase E as the sole core protein component, which is simpler than that multi-component core of eukaryotic P-bodies where assembly in vivo can occur even in the absence of Xrn1 (Sheth and Parker, 2003). While a set of four degradosome proteins purify with RNase E in stoichiometric amounts under normal growth conditions (Hardwick et al., 2011; Voss et al., 2014), when Ccr cells are grown in the cold, RhlB was shown to be displaced from RNase E and another DEAD box helicase RhlE and the transcription termination factor Rho were associated with the degradosome (Aguirre et al., 2017). The changes in RNase E association across different environmental conditions suggests that the composition of the BR-body may be regulated according to the the cell’s changing RNA processing/decay needs.
STAR Methods
Contact for reagent and resource sharing
Further information and requests for resources and reagents should be directed to and will be fulfilled by the Lead Contact, Jared Schrader (schrader@wayne.edu).
Experimental model and subject details
See table S3 for the list of bacterial strains used in this study.
Caulobacter crescentus cell growth
All Caulobacter crescentus strains used in this study (Table S3) were derived from the wildtype strain NA1000, and were grown at 28°C in peptone-yeast extract (PYE) medium or M2 minimal medium supplemented with 0.2% D-glucose (M2G) (Schrader and Shapiro, 2015). When appropriate, the indicated concentration of vanillate (5μM), Xylose (0.2%), gentamycin (0.5μg/ml), kanamycin (5μg/ml), chloramphenicol (2μg/ml), spectinomycin (25μg/ml), and/or streptomycin (5μg/ml) was added. Strains were analyzed at mid-exponential phase of growth (OD 0.3–0.6). Optical density was measured at 600 nm in a cuvette using a NanoDrop 2000C spectrophotometer. For acute drug treatment, the log phase cells were treated with Rifampicin (100μg/ml) for 30′, 200µg/mL chlor for 15′, 40µg/mL tet for 15′, and 150µg/mL Puro for 30′. Cell stress treatments were performed by incubating cells with the desired stress then immediately spotted on a 1.5% agarose pad and imaged or by incubating with the stress for the indicated time then spotting on the pad and imaging. Replacements strains containing a xylose inducible copy of RNase E and a Vanillate inducible test construct were first grown in media containing xylose overnight, then washed 3 times with 1mL growth media, and resuspended in growth media containing vanillate, diluted, and grown overnight (Fig S4A). Log-phase cultures were then spotted on M2G 1.5% agarose pads for imaging. For serial dilution assays, cells were grown overnight in xylose containing media, washed 3 times, and diluted to OD 0.05. Serial dilutions were then performed and spotted on plates with indicated composition and incubated at 28°C.
E. coli cell growth
E. coli strains were grown at 37°C and cultured in Luria-Bertani medium (L3522, Sigma), supplemented with the indicated concentration of kanamycin (30μg/ml) or Ampicillin (50μg/ml). For induction, BL21 DE3 cells were induced with isopropyl-3-Dthiogalactopyranoside (IPTG) (1μM) for 2 hours and TOP10 cells were induced with 0.0004% arabinose for one hour. Strains were analyzed at mid-exponential phase of growth (OD600 0.3–0.6). Optical density was measured at 600 nm in a cuvette using a NanoDrop 2000C spectrophotometer.
Agrobacterium tumefaciens and Sinorhizobium meliloti cell growth
Agrobacterium tumefaciens C58 cells were grown in Luria-Bertani medium at 28°C. When appropriate, the indicated concentration of gentamycin (100μg/ml) was added. Sinorhizobium meliloti 1021 cells were grown in Luria-Bertani medium. When appropriate, the concentration of gentamycin (50μg/ml) was added. Strains were analyzed at mid-exponential phase of growth (OD 0.3–0.6). Optical density was measured at 600 nm in a cuvette using a nanodrop 2000C spectrophotometer.
Strain and plasmid construction
All strains are listed in Table S3, plasmids in Table S4, and DNA oligos in Table S5. A detailed protocol for the generation of all strains and plasmids are listed below.
JS51: NA1000 RNE::RNE-YFP SpecR
RNase E-YFP fusion was generated by cloning the last 534bp of the RNase E gene (CCNA_01954) lacking a stop codon into pYFPC-1 (Thanbichler et al., 2007). First the last 534bp of the RNase E gene were amplified by PCR from the NA1000 genome using the following DNA primers:
CCNA_01954 F AAACATATGCCGAGCGGGCCGAGCGCG
CCNA_01954 R TATGGTACCCCGGCGCCACCAGCCCCGACG
Next, the resulting PCR product was digested with NdeI and KpnI enzymes, column purified, then ligated to NdeI/KpnI cut pYFPC-1 plasmid. The ligation was transformed into E. coli top10 cells and selected on LB-spec plates. Resulting specR colonies were then screened by PCR for the insert, and then verified by sanger sequencing (genewiz). The purified plasmid was then transformed into NA1000 cells via electroporation and plated on PYE-spec-strep plates. Resulting colonies were verified to be expressing the YFP fusion by fluorescence microscopy and the protein product was verified by western blot.
JS93: NA1000 vanA::RNE-Chy gentR
RNase E-Chy fusion was generated by subcloning the mChy fragment (745 bp) from pVCHYC-4 (Thanbichler et al., 2007) into pVRNE-YFPC-4 plasmid. First, both pVCHYC-4 and pVRNE-YFPC-4 were cut with EcoRI/NheI. The mChy fragment from pVCHYC-4 and EcoRI/NheI cut pVRNE-YFPC-4 vector were gel purified and ligated. The ligation was transformed into E. coli TOP10 cells and selected on LB-gent plates. Resulted colonies were screened by PCR for the mChy insert, confirmed by sanger sequencing (genewiz). The purified pVRNE-CHY plasmid was then transformed into NA1000 cells by electroporation and plated on PYE-gent plates. Resulting colonies were grown in the presence and absence of vanillate and verified by fluorescence microscopy.
JS87: NA1000 RNE::RNE-msfGFP GentR
RNase E-msfGFP fusion was generated by cutting the last 534bp of RNase E from pRNE-YFPC-1 using NdeI and KpnI and inserting it into pmsfGFPC-4 (msfGFP a gift from Grant Bowman). Both products were cut with NdeI/KpnI, gel purified, ligated, and transformed into E. coli top10 cells and selected on LB-gent plates. Resulting GentR colonies were then screened by PCR for the RNase E insert, and then verified by sanger sequencing (genewiz). The purified plasmid was then transformed into NA1000 cells via electroporation and plated on PYE-Gent plates. Resulting colonies were verified to be expressing the msfGFP fusion by fluorescence microscopy.
JS189: RNE::RNE-YFP pRT7-Chy SpecR KanR
The strain was generated by transforming JS51 cells with pRT7Chy (alternatively known as pRT7ChyC-2), a replicating plasmid containing the mChy gene under the control of T7 promoter. To generate pRT7Chy: First the T7 promoter fragment was ordered as readymade oligos (Invitrogen):
T7 RBS TS CTAATACGACTCACTATAGGGGATGCGAGGAAACGCATATGTCGAAGAAGATGCTGCA
T7 RBS BS TATGCAGCATCTTCTTCGACATATGCGTTTCCTCGCATCCCCTATAGTGAGTCGTATTAGCATG
Next, the oligoes were kinased with T4 PNK and annealed before ligating to Sph1/NdeI cut pRV-ChyC-2 plasmid (Thanbichler et al., 2007). The ligation was transformed into E. coli TOP10 cells and selected on LB-kan plates. Resulting kanR colonies were then screened by PCR for the insert, and then verified by sanger sequencing (genewiz). The purified plasmid was then transformed into JS51 cells via electroporation and plated on PYE-spec/strep/kan plates.
JS190: RNE::RNE-YFP pBXT7RNApol SpecR ChlorR
The strain was generated by transforming JS51 cells with a replicating plasmid containing the T7 polymerase gene under the control of xylose promoter. First, T7 polymerase was PCR amplified from pAR1219 (Gift from Olke C. Uhlenbeck) with the following gibson primers:
j5_00375 (rbs)_(T7-polymerase)_forward GACGCTCGAGTTTTGGGGAGACGACCAGATGCGAGGAAACGCATATGTCGAAGAAGATGCTGATGAACACGATTAACATCGCTAAGAACGACT
j5_00372 (T7-polymerase)_reverse GATCCCCCGGGCTGCAGGAATTCGATTTACGCGAACGCGAAGTCCGA
Next, the resulting PCR product was gel purified, then gibson-ligated to NdeI/EcoRV cut pBXMCS-6 plasmid (Thanbichler et al., 2007). The gibson reaction was transformed into E. coli TOP10 cells and selected on LB-cm plates. Resulting cmR colonies were then screened by PCR for the insert, and verified by sanger sequencing (genewiz). The purified pBXT7RNApol plasmid was then transformed into JS51 cells via electroporation and plated on PYE-spec-strep/cm plates.
JS191: RNE::RNE-YFP pBXT7RNApol pRT7Chy SpecR ChlorR KanR
The strain was generated by electroporation of JS190 with pRT7Chy plasmid described above. The cells were plated on PYE-kan-spec-strp-cm plates.
JS205: NA1000 RNE::RNE-YFP pBXMCS-6 pRT7Chy SpecR ChlorR KanR
The strain was generated by electroporation of JS189 with pBXMCS-6 plasmid (Thanbichler et al., 2007). The cells were plated on PYE-spec-strp-kan-cm plates.
JS8: NA1000 RNE::pXRNEssrAC KanR
The strain was generated in multiple steps. First, we generated the pXRNEssrAC-2 plasmid (alternatively named pXRNEssrAC). To generate this plasmid, we first cloned ssrA fragment into pXMCS-2 plasmid (Thanbichler et al., 2007) to generate pXMCS-2-ssrA plasmid. The ssrA was ordered as readymade oligos (IDT):
5` SsrA(KpnI) CGCGAACGATAACTTCGCTGAAGAGTTCGCCGTCGCTGCGTAAG
3` SsrA(Nhe1) CTAGCTTACGCAGCGACGGCGAACTCTTCAGCGAAGTTATCGTTCGCGGTAC
The oligos were T4 PNK kinased before annealing and ligating into the Kpn1/Nhe1 cut pXMCS-2 plasmid. The ligation was transformed into E. coli DH5 alpha cells and selected on LB-kan plates. Resulting kanR colonies were then screened by PCR for the insert, and verified by sanger sequencing (genewiz). Second, we gibsoned the first 501 bp of RNase E into pXMCS-ssrA-2 to be in frame with the ssrA tag. The 501 bp RNE fragment was PCR amplified from the genome using the following DNA primers:
j5_00242_(Nde1)_(500RNE)_forward GCTTCAGACGCTCGAGTTTTGGGGAGACGACCATATGTCGAAGAAGATGCTGATCGACGC
j5_00243_(500RNE)_(Kpn1)_reverse GCGAACTCTTCAGCGAAGTTATCGTTCGCGGTACCGCCACGCTCTTCCTTGACCACC
Next, the resulting PCR product was gel purified, then gibson inserted into NdeI/KpnI cut pXMCS-ssrA-2 plasmid. The ligation was transformed into E. coli DH5 alpha cells and selected on LB-kan plates. Resulting kanR colonies were then screened by PCR for the insert, and verified by sanger sequencing (genewiz). The purified plasmid was then transformed into NA1000 cells by electroporation and plated on PYE-kan plates. Resulting colonies were patched on PYE-kan plates with and without xylose to verify the RNE depletion phenotype.
JS138: NA1000 vanA::RNE(ASM mut1)-YFP RNE::pXRNEssrAC GentR KanR
The strain was generated by transducing JS124 cells with RNE depletion phage lysate from JS8 strain and the cells were plated on PYE-kan-gent-xylose plates. The growing colonies were patched on PYE-kangent plates with or without xylose to verify RNE depletion.
JS299: NA1000 vanA:: RNE(ASM mut2)-YFP RNE::pXRNEssrAC-2 GentR KanR
The strain was generated in multiple steps. First, we generated the NA1000 vanA::RNE(ASMmut2)-YFP strain (JS293). Next, these cells were transduced with RNE depletion phage lysate from JS8 strain and the cells were plated on PYE-kan-gent-xylose plates. The growing colonies were patched on PYE-kangent plates with or without xylose to verify the depletion.
JS9: Sm1021 RNE::RNE-YFP GentR
Sinorhizobium meliloti RNase E-YFP fusion was generated by cloning the last 1101 bp of the RNase E gene (SMc01336 ) lacking a stop codon into pYFPC-4 (Thanbichler et al., 2007). First the last 1101bp of the RNase E gene were amplified by PCR from the SME1021 genome using the following DNA primers:
SME RNE YFP F AAACATATGGTCTCCATCTTCATCGAAGCGG
SME RNE YFP R AAAGGTACCGAAGAAACCGCGGCGCTG
Next, the resulting PCR product was gel purified and digested with NdeI and KpnI enzymes then ligated to NdeI/KpnI cut pYFPC-4 plasmid. The ligation was transformed into E. coli DH5 alpha cells and selected on LB-gent plates. Resulting gentR colonies were then screened by PCR for the insert, and verified by sanger sequencing (genewiz). The purified plasmid was then transformed into the recipient strain (SME1021) cells by triparental mating using E.coli MT616 (chlorR) helper cells. The mated cells were streaked out twice on M9 sucrose-gent plates to insure complete killing of E. coli cells. Resulting colonies were verified to be expressing the YFP fusion by fluorescence microscopy.
JS5: Atu C58 RNE::RNE-YFP GentR
Agrobacterium tumefaciens RNase E-YFP fusion was generated by cloning the last 915 bp of the RNase E gene (Atu1339) lacking a stop codon into pYFPC-4 (Thanbichler et al., 2007). First the last 915 bp of the RNase E gene were amplified by PCR from the C58 genome using the following DNA primers:
Agro RNE YFP F AAACATATGTACGAAGGCCGCTTCGG
Agro RNE YFP R AAAGGTACCGAAGAAGCCTTTGCGCTGCC
Next, the resulting PCR product was gel purified and digested with NdeI and KpnI enzymes, then ligated to NdeI/KpnI cut pYFPC-4 plasmid. The ligation was transformed into E. coli DH5 alpha cells and selected on LB-gent plates. Resulting gentR colonies were then screened by PCR for the insert, and verified by sanger sequencing (genewiz). The purified plasmid was then transformed into the recipient strain (C58) cells by electroporation and cells were plated on LB-gent plates. Resulting colonies were verified to be expressing the YFP fusion by fluorescence microscopy.
JS63: NA1000 vanA::RNE(CTD)-YFP GentR
This strain contains the first 15 and the last 1344 bp of RNE lacking the stop codon fused to YFP tag and integrated under the vanillate promoter. The plasmid was generated starting with the full length RNE containing plasmid (pVRNE-YFPC-4) by site directed mutagenesis using the following DNA primers:
pVYFPC-delta E/G F ACCGGCGTGCTGGAAGGCA
pVYFPC delta S1 R (+5 aa) CAGCATCTTCTTCGACATATGCGTTTCCTC
The mutated gene containing plasmid was PCR amplified using the T4 PNK kinased oligos and using pVRNE-YFPC-4 as a template. The resulting PCR reaction was gel purified and self-ligated. The ligation was transformed into E. coli TOP10 cells and selected on LB-gent plates. Resulting gentR colonies were verified by sanger sequencing (genewiz). The purified plasmid was then transformed into NA1000 cells by electroporation and plated on PYE-gent plates. Resulting colonies were grown in the presence and absence of vanillate and verified by fluorescence microscopy.
JS135: NA1000 vanA::RNE(ΔAconBS)-YFP GentR
The strain contains Aconitase binding site (R675-A725) deleted-RNE fused to YFP tag and integrated under the vanillate promoter. The plasmid was generated starting with the full length RNE containing plasmid (pVRNE-YFPC-4) by site directed mutagenesis using the following DNA primers:
delta aconitase BS-F ACCGAGGCCGCGCCGCG
delta aconitase BS-R CCCGCCACGACGGCCG
The mutated gene containing plasmid was PCR amplified using the T4 PNK kinased oligos and using pVRNE-YFPC-4 as a template. The resulting PCR reaction was gel purified and self-ligated. The ligation was transformed into E. coli TOP10 cells and selected on LB-gent plates. Resulting gentR colonies were then verified by sanger sequencing (genewiz). The purified plasmid was transformed into NA1000 cells by electroporation and plated on PYE-gent plates. Resulting colonies were grown in the presence and absence of vanillate and verified by fluorescence microscopy.
JS136: NA1000 vanA::RNE(ΔPnpBS)-YFP GentR
The strain contains PNPase binding site (P888-R898) deleted-RNE fused to YFP tag and integrated under the vanillate promoter. The plasmid was generated starting with the full length RNE containing plasmid (pVRNE-YFPC-4) by site directed mutagenesis using the following DNA primers:
delta PNPase BS-F GGTACCTTAAGATCTCGAGCTCCG
delta PNPase BS-R CGGCGCGGTGATCTCGTT
The mutated gene containing plasmid was PCR amplified using the T4 PNK kinased oligos and using pVRNE-YFPC-4 as a template. The resulting PCR reaction was gel purified and self-ligated. The ligation was transformed into E. coli TOP10 cells and selected on LB-gent plates. Resulting gentR colonies were verified by sanger sequencing (genewiz). The purified plasmid was then transformed into NA1000 cells by electroporation and plated on PYE-gent plates. Resulting colonies were grown in the presence and absence of vanillate and verified by fluorescence microscopy
JS62: NA1000 vanA::RNE(ΔRhlBBS)-YFP GentR
The strain contains the first 15 and the last 2166 bp of RNE lacking the stop codon fused to YFP tag and integrated under the vanillate promoter. The plasmid was generated starting with the full length RNE containing plasmid (pVRNE-YFPC-4) by site directed mutagenesis using the following DNA primers:
pVYFPC-delta S1-F CTGTCGCTGGCCGGCCGC
pVYFPC delta S1 R (+5 aa) CAGCATCTTCTTCGACATATGCGTTTCCTC
The mutated gene containing plasmid was PCR amplified using the T4 PNK kinased oligos and using pVRNE-YFPC-4 as a template. The resulting PCR reaction was gel purified and self-ligated. The ligation was transformed into E. coli TOP10 cells and selected on LB-gent plates. Resulting gentR colonies were then verified by sanger sequencing (genewiz). The purified plasmid was then transformed into NA1000 cells by electroporation and plated on PYE-gent plates. Resulting colonies were grown in the presence and absence of vanillate and verified by fluorescence microscopy.
JS49: NA1000 vanA::FL-RNE-YFP GentR
This strain contains a Full length RNE lacking the stop codon fused to YFP tag and integrated under the vanillate promoter (Genescript).
JS227: NA1000 vanA::RNE(ΔDBS)-YFP GentR
The strain contains an RNE lacking all the degradosome binding sites in the CTD; (ΔRndBS (A760-V803), ΔAconBS (R675-A725), and ΔPnpBS (P888-R898) and the stop codon fused to YFP tag and integrated under the vanillate promoter (Genescript).
JS233: NA1000 vanA::RNE(ΔDBS)-YFP RNE::pXRNEssrAC GentR KanR
JS227 strain was transduced with RNE depletion phage lysate from JS8. The transduced cells were plated in PYE-gent-kan-xylose plates and the resultant colonies were streaked on PYE-gent-kan plates with and without xylose to verify the RNE depletion phenotype.
JS134: NA1000 acon::acon-Chy SpecR
The strain was generated by subcloning the last 500bp of aconitase (CCNA_03781) lacking the stop codon from pacon-YFPC-1plasmid to the Nde1/Kpn1 cut pCHYC-1 plasmid (Thanbichler et al., 2007). The sequencing verified plasmid was transformed into NA1000 cells and cells were plated on PYE-spec-strp plates. Resulting colonies were verified to be expressing the acon-Chy fusion by fluorescence microscopy.
JS151: NA1000 vanA::RNE-YFP RNE::pXRNEssrAC acon::acon-Chy GentR KanR SpecR
The strain was generated in two steps. First, JS49 strain was transduced with RNE depletion phage lysate from JS8. The transduced cells were plated in PYE-gent-kan-xylose plates and the resultant colonies were streaked on PYE-gent-kan plates with and without xylose to verify the RNE depletion phenotype.
Next, the resultant cells were transduced with phage lysate of JS134 strain and plated on PYE-gent-kan-spec-strp -xylose plates. The resultant cells were streaked on PYE-kan-gent-spec-strp-xylose plates.
Resulting colonies were verified to be expressing the acon-Chy fusion by fluorescence microscopy.
JS153: NA1000 vanA::RNE(ΔAconBS)-YFP RNE::pXRNEssrAC acon::acon-Chy GentR KanR SpecR
The strain was generated starting with JS135 strain in two steps. First, JS135 cells were transduced with RNE depletion phage lysate from JS8 and plated on PYE-kan-gent-xylose plates. The resultant colonies were streaked on PYE-gent-kan plates with and without xylose to verify the RNE depletion phenotype. Next, the xylose dependent colonies were transduced with phage lysate from JS134 and plated on PYE-kan-gent-spec-strp-xylose plates. The resultant cells were streaked on PYE-kan-gent-spec-strp-xylose plates. Resulting colonies were verified to be expressing the acon-Chy fusion by fluorescence microscopy.
JS244: Eco BL21(DE3) pET28-Ccr RNE(CTD-YFP) KanR
The strain was generated by subcloning the RNE (CTD-YFP) from pVRNE(CTD)-YFPC-4 plasmid to pET28a(+) plasmid. The RNE(CTD-YFP) (2127 bp) fragment was cut out from pVRNE(CTD)-YFPC-4 plasmid with Nde1/Nhe1, gel purified and ligated to Nde1/Kpn1 cut pET28a(+) plasmid. The ligation was transformed into E. coli DH5 alpha cells and selected on LB-kan plates. Resulting kanR colonies were then screened by PCR. The purified plasmid was transformed to E. coli BL21(DE3) cells. Resulting colonies were verified by fluorescence microscopy.
JS230: Eco TOP10 pBAD-CcRNE(CTD-YFP) AmpR
The strain was generated by subcloning the RNE(CTD-YFP) from pET28a(+) plasmid containing the (RNE(CTD-YFP) to DsRed2pBAD plasmid (addgene). The RNE(CTD-YFP) fragment (2127 bp) was cut out with Nde1/Nhe1 and ligated to Nde1/Nhe1 cut DsRed2pBAD plasmid. The ligation was transformed into E. coli TOP10 cells and selected on LB-amp plates. Resulting ampR colonies were then screened by PCR for the insert, and verified by sanger sequencing (genewiz). The purified plasmid was then transformed into E. coli TOP10 cells which were plated on LB-amp plates. Resulting colonies were verified by fluorescence microscopy.
JS231: Eco TOP10 pBAD-CcRNE(NTD-YFP) AmpR
The strain was generated by subcloning the RNE (NTD-YFP) from pET28a(+) plasmid containing the RNE(NTD-YFP) to DsRed2pBAD plasmid (addgene). The RNE(NTD-YFP) fragment (2124 bp) was cut out with Nde1/Nhe1 and ligated to Nde1/Nhe1 cut DsRed2pBAD plasmid. The ligation was transformed into E. coli TOP10 cells and selected on LB-amp plates. Resulting ampR colonies were then screened by PCR for the insert, and verified by sanger sequencing (genewiz). The purified plasmid was then transformed into E. coli TOP10 cells which were plated on LB-amp plates. Resulting colonies were verified by fluorescence microscopy.
JS232: Eco TOP10 pBAD-CcRNE-YFPC AmpR
The strain was generated by subcloning the (RNE-YFP) from pET28a (+) plasmid containing the (RNE-YFP) to DsRed2pBAD plasmid (addgene). The (RNE-YFP) fragment (3474 bp) was cut out with Nde1/Nhe1 and ligated to Nde1/Nhe1 cut DsRed2pBAD plasmid. The ligation was transformed into E. coli TOP10 cells and selected on LB-amp plates. Resulting ampR colonies were then screened by PCR for the insert, and then verified by sanger sequencing (genewiz). The purified plasmid was then transformed into E. coli TOP10 cells which were plated on LB-amp plates. Resulting colonies were verified by fluorescence microscopy.
JS251: NA1000 acon::acon-YFP SpecR
Acon-YFP fusion was generated by cloning the last 500bp of the aconitase gene (CCNA_03781) lacking a stop codon into pYFPC-1 plasmid (Thanbichler et al., 2007). First the last 500 bp of the aconitase gene were amplified by PCR from the NA1000 genome using the following DNA primers:
-
CCNA_03781 F
AAACATATGGCAACCGCATCACCCCGG
-
CCNA_03781 R
TATGGTACCGTCGGCCTTGGCCAGGTTCCG
Next, the resulting PCR product was digested with NdeI and KpnI enzymes, gel purified, then ligated to NdeI/KpnI cut pYFPC-1 plasmid. The ligation was transformed into E. coli DH5 alpha cells and selected on LB-spec plates. Resulting specR colonies were then screened by PCR for the insert, and sequence verified. The purified pacon-YFPC-1 plasmid was then transformed into NA1000 cells via electroporation and plated on PYE-spec-strep plates. Resulting colonies were verified to be expressing the YFP fusion by fluorescence microscopy.
JS58: NA1000 vanA::RNE(E/G)-YFP GentR
The strain contains the first 5 amino acids +(L177-R450) fragment of RNE fused to YFP tag and integrated under the vanillate promoter. The plasmid was generated starting with the pVRNE-NTD-YFPC-4 plasmid by site directed mutagenesis using the following DNA primers:
pVYFPC-delta S1-F CTGTCGCTGGCCGGCCGC
pVYFPC delta S1 R (+5 aas) CAGCATCTTCTTCGACATATGCGTTTCCTC
The mutated gene containing plasmid was PCR amplified using the T4 PNK kinased oligos and using pVRNE-YFPC-4 as a template. The resulting PCR reaction was gel purified and self-ligated. The ligation was transformed into E. coli TOP10 cells and selected on LB-gent plates. Resulting gentR colonies were then verified by sanger sequencing (genewiz). The purified plasmid was then transformed into NA1000 cells by electroporation and plated on PYE-gent plates. Resulting colonies were grown in the presence and absence of vanillate and verified by fluorescence microscopy.
JS61: NA1000 vanA::RNE(ΔE/G)-YFP GentR
The strain contains the first 528 bp and the last 1344 bp of RNE lacking the stop codon fused to YFP tag and integrated under the vanillate promoter. The plasmid was generated starting with the full length RNE containing plasmid (pVRNE-YFPC-4) by site directed mutagenesis using the following DNA primers:
pVYFPC-delta E/G F ACCGGCGTGCTGGAAGGCA
pVYFPC-delta E/G R V2 CAGATAGGTGGTCAGGGCCGC
The mutated gene containing plasmid was PCR amplified using the T4 PNK kinased oligos and using pVRNE-YFPC-4 as a template. The resulting PCR reaction was gel purified and self-ligated. The ligation was transformed into E. coli TOP10 cells and selected on LB-gent plates. Resulting gentR colonies were then verified by sanger sequencing (genewiz). The purified plasmid was then transformed into NA1000 cells by electroporation and plated on PYE-gent plates. Resulting colonies were grown in the presence and absence of vanillate and verified by fluorescence microscopy.
JS66: NA1000 vanA::RNE(S1)-YFP GentR
The strain contains the first 531 bp fragment of RNE fused to YFP tag and integrated under the vanillate promoter. The plasmid was generated starting with the pVRNE-YFPC-4 plasmid by site directed mutagenesis using the following DNA primers:
pVYFPC-linker F AATTCGAACGTTACGCGTCACCGG
pVYFPC-delta E/G R V2 CAGATAGGTGGTCAGGGCCGC
The mutated gene containing plasmid was PCR amplified using the T4 PNK kinased oligos and using pVRNE-YFPC-4 as a template. The resulting PCR reaction was gel purified and self-ligated. The ligation was transformed into E. coli TOP10 cells and selected on LB-gent plates. Resulting gentR colonies were then verified by sanger sequencing (genewiz). The purified plasmid was then transformed into NA1000 cells by electroporation and plated on PYE-gent plates. Resulting colonies were grown in the presence and absence of vanillate and verified by fluorescence microscopy.
JS254: NA1000 vanA::RNE (CTD-ΔR-rich) -YFP (GentR)
This strain contains the first 15 and CTD of RNE lacking R-rich regions; (D609-R269), (D654-G674), (R747-N756), (K808-A820), and the stop codon fused to YFP tag and integrated under the vanillate promoter. The plasmid was generated starting with (pVRNE-(CTD)-YFPC-4) plasmid by site directed mutagenesis using the following DNA primers:
pVYFPC-delta E/G F ACCGGCGTGCTGGAAGGCA
pVYFPC delta S1 R (+5 aa) CAGCATCTTCTTCGACATATGCGTTTCCTC
The mutated gene containing plasmid was PCR amplified using the T4 PNK kinased oligos and using pVRNE-YFPC-4 as a template. The resulting PCR reaction was gel purified and self-ligated. The ligation was transformed into E. coli TOP10 cells and selected on LB-gent plates. Resulting gentR colonies were verified by sanger sequencing (genewiz). The purified plasmid was then transformed into NA1000 cells by electroporation and plated on PYE-gent plates. Resulting colonies were grown in the presence and absence of vanillate and verified by fluorescence microscopy.
JS256: NA1000 rhlB::rhlB-CFP SpecR
rhlB-CFPC fusion was generated by cloning the last 500 bp of the RhlB gene (CCNA_01923) lacking a stop codon into pCFPC-1 (Thanbichler et al. 2007 NAR). First the last 500bp of the rhlB gene were amplified by PCR from the NA1000 genome using the following DNA primers:
-
RhlB F NdeI
ATACATATGCGGCCGACGACAAGGGCTTCGACAAG
-
RhlB R EcoRI
ATATAGAATTCCGCTTCGCGCCGCGCGGCGGGCGCGCGAGG
Next, the resulting PCR product was digested with NdeI and EcoRI enzymes, gel purified, then ligated to NdeI/EcoRI cut pCFPC-1 plasmid. The ligation was transformed into E. coli DH5 alpha cells and selected on LB-spec plates. Resulting specR colonies were then screened by PCR for the insert, and sequence verified. The purified plasmid was then transformed into NA1000 cells via electroporation and plated on PYE-spec-strep plates. Resulting colonies were verified to be expressing the YFP fusion by fluorescence microscopy.
JS268: NA1000 vanA::RNE-YFP RNE::pXRNEssrAC rhlB::rhlB-CFP GentR KanR SpecR
The strain was generated in two steps. First, JS49 strain was transduced with RNE depletion phage lysate from JS8. The transduced cells were plated in PYE-gent-kan-xylose plates and the resultant colonies were streaked on PYE-gent-kan plates with and without xylose to verify the RNE depletion phenotype. Next, the resultant cells were transduced with phage lysate of JS256 strain and plated on PYE-gent-kan-spec-strp -xylose plates. The resultant colonies were streaked on PYE-kan-gent-spec-strp-xylose plates. Resulting colonies were verified by fluorescence microscopy.
JS270: NA1000 vanA::RNE(ΔRhlBBS)-YFP RNE::pXRNEssrAC rhlB::rhlB-CFP GentR KanR SpecR
The strain was generated in two steps. First, JS62 strain was transduced with RNE depletion phage lysate from JS8. The transduced cells were plated in PYE-gent-kan-xylose plates and the resultant colonies were streaked on PYE-gent-kan plates with and without xylose to verify the RNE depletion phenotype. Next, the resultant cells were transduced with phage lysate of JS256 strain and plated on PYE-gent-kan-spec-strp -xylose plates. The resultant colonies were streaked on PYE-kan-gent-spec-strp-xylose plates. Resulting colonies were verified by fluorescence microscopy.
JS276: NA1000 vanA::RNE(ΔRndBS)-YFP GentR
The strain contains an RNE lacking the RNaseD binding site (A760-V803) and the stop codon fused to YFP tag and integrated under the vanillate promoter (Genescript).
JS277: NA1000 van::RNE(ΔRndBS)-YFP RNE::pXRNEssrAC GentR KanR
The strain was generated by transducing JS 276 strain with RNE depletion phage lysate from JS8. The transduced cells were plated in PYE-gent-kan-xylose plates and the resultant colonies were streaked on PYE-gent-kan plates with and without xylose to verify the RNE depletion phenotype.
JS140: NA1000 van::RNE(ΔPnpBS)-YFP RNE::pXRNEssrAC GentR KanR
The strain was made by transducing JS136 strain with RNE depletion phage lysate from JS8. The transduced cells were plated in PYE-gent-kan-xylose plates and the resultant colonies were streaked on PYE-gent-kan plates with and without xylose to verify the RNE depletion phenotype.
JS142: NA1000 van::RNE(ΔAconBS)-YFP RNE::pXRNEssrAC GentR KanR
The strain was made by transducing JS135 strain with RNE depletion phage lysate from JS8. The transduced cells were plated in PYE-gent-kan-xylose plates and the resultant colonies were streaked on PYE-gent-kan plates with and without xylose to verify the RNE depletion phenotype.
JS73: NA1000 vanA::RNE(ΔRhlBBS)-YFP RNE::pXRNEssrAC GentR KanR
The strain was made by transducing JS62 strain with RNE depletion phage lysate from JS8. The transduced cells were plated in PYE-gent-kan-xylose plates and the resultant colonies were streaked on PYE-gent-kan plates with and without xylose to verify the RNE depletion phenotype.
JS38: NA1000 vanA::RNE-YFP RNE::pXRNEssrAC GentR KanR
The strain was made by transducing strain JS49 with RNE depletion phage lysate from JS8. The transduced cells were plated in PYE-gent-kan-xylose plates and the resultant colonies were streaked on PYE-gent-kan plates with and without xylose to verify the RNE depletion phenotype.
JS217: NA1000 vanA::RNE(NTD)-YFP GentR
The strain contains the first 528 bp and the first 1731bp of RNE fused to YFP tag and integrated under the vanillate promoter. The plasmid was generated starting with the full length RNE containing plasmid (pVRNE-YFPC-4) by site directed mutagenesis using the following DNA primers:
pVYFPC-linker F AATTCGAACGTTACGCGTCACCGG
Delta C correct GTCGTCTTCTTCTTCCTCGTCGTCG
The mutated gene containing plasmid was PCR amplified using the T4 PNK kinased oligos and using pVRNE-YFPC-4 as a template. The resulting PCR reaction was gel purified and self-ligated. The ligation was transformed into E. coli TOP10 cells and selected on LB-gent plates. Resulting gentR colonies were then verified by sanger sequencing (genewiz). The purified plasmid was then transformed into NA1000 cells by electroporation and plated on PYE-gent plates. Resulting colonies were grown in the presence and absence of vanillate and verified by fluorescence microscopy.
JS70: NA1000 vanA::RNE(CTD)-YFP RNE::pXRNEssrAC GentR KanR
The strain was made by transducing strain JS63 with RNE depletion phage lysate from JS8. The transduced cells were plated in PYE-gent-kan-xylose plates and the resultant colonies were streaked on PYE-gent-kan plates with and without xylose to verify the RNE depletion phenotype.
JS221: NA1000 vanA::RNE(NTD)-YFP RNE::pXRNEssrAC GentR KanR
The strain was generated by transducing JS 217 strain with RNE depletion phage lysate from JS8. The transduced cells were plated in PYE-gent-kan-xylose plates and the resultant colonies were streaked on PYE-gent-kan plates with and without xylose to verify the RNE depletion phenotype
JS272: NA1000 rhlB-CFP RNE::pXRNEssrAC SpecR KanR
The strain was generated by transducing JS 256 strain with RNE depletion phage lysate from JS8. The transduced cells were plated in PYE-Spec-Strp-kan-xylose plates and the resultant colonies were streaked on PYE-Spec-Strp-kan plates with and without xylose to verify the RNE depletion phenotype.
JS264: NA1000 vanA::RNE-Chy rhlB-CFP GentR SpecR
The strain was made by transducing JS256 with phage lysate of strain JS93. The transduced cells were plated in PYE-gent-Spec-Strp plates. Resulting colonies were grown in the presence and absence of vanillate and verified by fluorescence microscopy.
JS42: NA1000 IF3::pXIF3ssrAC KanR
The strain was generated by gibson cloning of IF3 into pXRNEssrAC plasmid. First, IF3 was PCR amplified from the genome using the following DNA primers:
-
j5_00007_(Nde1)_(IF3)_forward
GCTTCAGACGCTCGAGTTTTGGGGAGACGACCATATGCAAACGCCGCCCGTT
-
j5_00008_(IF3)_(Kpn1)_reverse
GCGAACTCTTCAGCGAAGTTATCGTTCGCGGTACCGCGCGGGGCCAGGATCAT
Next, the resulting PCR product was gel purified, digested with Nde1 and Kpn1 and inserted by gibson assembly into NdeI/KpnI cut pXMCS-ssrA-2 plasmid. The ligation was transformed into E. coli DH5 alpha cells and selected on LB-kan plates. Resulting kanR colonies were then screened by PCR for the insert, and verified by sanger sequencing (genewiz). The purified plasmid was then transformed into NA1000 cells by electroporation and plated on PYE-kan plates. Resulting colonies were patched on PYE-kan plates with and without xylose to verify the RNE depletion phenotype.
JS 293: NA1000 vanA::RNE(ASMmut2)YFPC GentR
The strain contains an active site mutant RNE that has two amino acid mutations (D360N D403N). The plasmid containing this active site mutant (RNE(ASMmut2)-YFPC-4 was purchased from (Genscript) and transformed into NA1000 via electroporation and selected on PYE-gent plates. Resulting colonies were grown in the presence and absence of vanillate and verified by fluorescence microscopy.
JS297: NA1000 vanA::RNE(Ccr-NTD-Eco-CTD)-YFPC GentR
The strain was constructed in multiple steps. First, we constructed the Ccr-E.coli-RNE hybrid gene under van promoter by Gibson assembly. This was done by PCR amplifying the last 1542 bp E.coli-CTD fragment (eco-b1084) lacking the stop codon using the following DNA primers:
-
j5_00406_(Eco_CTD)_forward
GAAGAAGAAGACGACGCGCCTGTTGTAGCTCCAGC
-
j5_00407_(Eco_CTD)_reverse
GCGTAACGTTCGAATTCTCAACAGGTTGCGGACGCGC
We also PCR opened the pVRNE(NTD)-YFPC-4 plasmid using the following primers:
-
j5_00404_(CC_NTD_Correct)_forward
CCGCAACCTGTTGAGAATTCGAACGTTACGCGTCACCGGT
-
j5_00405_(CC_NTD_Correct)_reverse
CTACAACAGGCGCGTCGTCTTCTTCTTCCTCGTCGTCGTAGG
The resultant PCR fragments were gel purified and ligated by gibson assembly. The assembly reaction was transformed into E. coli TOP10 cells and selected on LB-gent plates. Resulting gentR colonies were then screened by PCR for the insert, and verified by sanger sequencing (genewiz). The purified plasmid was then transformed into NA1000 cells via electroporation and plated on PYE-gent plates. Resulting colonies were grown in the presence and absence of vanillate and verified by fluorescence microscopy.
JS324: NA1000 vanA::RNE(Ccr-NTD-Eco-CTD)-YFP RNE::pXRNEssrAC GentR KanR
The strain was generated by transducing JS297 cells with RNE depletion phage lysate of JS8 and plated on PYE-kan-gent-xylose plates. The resultant colonies were streaked out on PYE-kan-gent plates with and without xylose to verify the RNE depletion phenotype.
JS326: NA1000 vanA::RNE(Ccr-NTD-Atu-CTD)-YFPC GentR
This strain was constructed in multiple steps. First, we constructed the Ccr-Atu-RNE hybrid gene under van promoter by Gibson assembly. This was done by PCR amplifying the last 861bp Atu-CTD fragment (Atu1339 ) lacking stop codon using the following DNA primers:
j5_00398_(Atu_CTD)_forward GGAAGAAGAAGACGACGACGATATCGTCATCGAGGTGGAAGAGGAC
-
j5_00399_(Atu_CTD)_reverse
CGCGTAACGTTCGAATTGAAGAAGCCTTTGCGCTGCCACC
We also PCR opened the pVRNE(NTD)-YFPC-4 plasmid using the following primers:
j5_00396_(CC_NTD_Correct)_forward GCGCAAAGGCTTCTTCAATTCGAACGTTACGCGTCACCGGT
-
j5_00397_(CC_NTD_Correct)_reverse
CGATGACGATATCGTCGTCGTCTTCTTCTTCCTCGTCGTCGTAGG
The resultant PCR fragments were gel purified and ligated by gibson assembly. The assembly was transformed into E.coli TOP10 cells and selected on LB-gent plates. Resulting gentR colonies were then screened by PCR for the insert, and then verified by sanger sequencing (genewiz). The purified plasmid was then transformed into NA1000 cells via electroporation and plated on PYE-gent plates. Resulting colonies were grown in the presence and absence of vanillate and verified by fluorescence microscopy.
JS327: NA1000 vanA::RNE(Ccr-NTD-Atu-CTD)-YFP RNE::pXRNEssrAC GentR KanR
The strain was generated by transducing JS326 cells with RNE depletion phage lysate of JS8 and plated on PYE-kan-gent-xylose plates. The resultant colonies were streaked out on PYE-kan-gent plates with and without xylose to verify the RNE depletion phenotype.
JS328: NA1000 vanA::RNE(Ccr-NTD-Sme-CTD)-YFPC GentR
This strain was constructed in multiple steps. First, we constructed the Ccr-Sm-RNE hybrid gene under van promoter by Gibson assembly. This was done by PCR amplifying the last 780 bp Sm-CTD fragment (SMc01336 ) lacking stop codon using the following DNA primers:
-
j5_00402_(Sme_CTD)_forward
GGAAGAAGAAGACGACGAGGTCCTCATCGAGGAGGAGTCCG
-
j5_00403_(Sme_CTD)_reverse
CGTAACGTTCGAATTGAAGAAACCGCGGCGCTGCC
We also PCR opened the pVRNE(NTD)-YFPC-4 plasmid using the following primers:
-
j5_00400_(CC_NTD_Correct)_forward
CGCCGCGGTTTCTTCAATTCGAACGTTACGCGTCACCGGT
-
j5_00401_(CC_NTD_Correct)_reverse
CTCGATGAGGACCTCGTCGTCTTCTTCTTCCTCGTCGTCGTAGG
The resultant PCR fragments were gel purified and ligated by gibson assembly. The assembly reaction was transformed into E.coli TOP10 cells and selected on LB-gent plates. Resulting gentR colonies were then screened by PCR for the insert, and then verified by sanger sequencing (genewiz). The purified plasmid was then transformed into NA1000 cells via electroporation and plated on PYE-gent plates. Resulting colonies were grown in the presence and absence of vanillate and verified by fluorescence microscopy.
JS330: NA1000 vanA::RNE(Ccr-NTD-Sme-CTD)-YFP RNE::pXRNEssrAC GentR KanR
The strain was generated by transducing JS324 cells with RNE depletion phage lysate of JS8 and plated on PYE-kan-gent-xylose plates. The resultant colonies were streaked out on PYE-kan-gent plates with and without xylose to verify the RNE depletion phenotype.
JS124: NA1000 vanA::RNE(ASM mut1)-YFPC GentR
This strain was generated in multiple steps. First, we generated the NA1000 vanA::RNE(ASM)-YFP strain. This strain contains RNE version with a two amino acid deletion (361–362) in the active site fused to YFP tag and integrated under the vanillate promoter. The plasmid containing this active site mutant (ASMmut1) was generated starting with the full length RNE containing plasmid (pVRNE-YFPC-4) by site directed mutagenesis and using the following DNA primers:
Δ361–362 F GACTCGGGTAAGGCCACGCGC
Δ361–362 R GATGGCGACCAGGGCCTCGGT
The oligos were kinased with T4 PNK before PCR reaction. The resulting PCR reaction was gel purified and self-ligated. The ligation was transformed into E. coli TOP10 cells and selected on LB-gent plates. Resulting gentR colonies were then verified by sanger sequencing (genewiz). The purified plasmid was then transformed into NA1000 cells by electroporation and plated on PYE-gent plates. Resulting colonies were grown in the presence and absence of vanillate and verified by fluorescence microscopy.
DTT033: Eco BL21 (DE3) pTEV5-RNE(CTD) AmpR
The strain was generated by cloning the RNase E(451–898) from the pET28a vector containing CcRNE. The pTEV5 vector was linearized by NheI digest. An insert containing the RNE(CTD) (1344 bp) was amplified by PCR using the following forward and reverse primers: DT061 CCAACTAGTGAAAACCTGTATTTTCAGGGCGCTATGACCGGCGTGC TGGAAGGC and DT085 GCTCGAGAATTCCATGGCCATATGGCTTTAGCGACGCCACCAACCACG. The resulting linearized vector and insert was ligated by the CPEC(Quan and Tian, 2011) method to generate plasmid pDT074. This plasmid was used to express a recombinant protein that includes MSYYHHHHHHDYDIPTSENLYFQGAM purification tag that is directly fused to the N-terminus of RNaseE(451–898).
Method details
Cell imaging and analysis
For imaging, cells were immobilized on 1.5% agarose pads made with M2G medium on microscope slides (3051, Thermo Scientific) and images were collected using a Nikon Eclipse NI-E with CoolSNAP MYO-CCD camera and 100x Oil CFI Plan Fluor (Nikon) objective, driven by Nikon elements software. The filter sets used for YFP, CFP and mCherry imaging were chroma 96363, 96361, and 96322 models respectively. For time lapse experiments, images were taken at 1′ intervals with autofocus on over a maximum time of 10′.
Cell image analysis was performed using microbeJ (Ducret et al., 2016). For automated foci detection we used the maxima foci function of microbeJ we manually adjusted the tolerance and Z-score settings to identify and outline foci on a test image then removed aberrant foci with area <0.01 µm2 and length >1 µM. The segmentation option was also used to split adjoined foci. For a given set of images we applied the same tolerance/Z-score parameters to quantify the number of foci/cell with a minimum of 50 cells.
RNA extraction
For RNA extraction log-phase cells were rapidly pelleted at 14k rpm in a microcentrifuge and resuspending in 1mL 65°C Trizol as in (Zhou et al., 2015). Cells were incubated at 65°C for 10 minutes, then 200µL of chloroform was added and incubated for 5 minutes at room temperature. The samples were then spun at max speed in a microcentrifuge for 10 minutes at room temperature and the aqueous layer was removed and incubated with 700µL of isopropanol. The samples were then precipitated at – 20°C for 1 hour and spun at 20,000g for 30 minutes at 4°C. The supernatant was removed and the pellet was washed with 1mL 70% ethanol. The samples were then spun again for 15 minutes at 20,000g at 4°C, the supernatant was removed, and the pellet was resuspended in 10mM Tris pH 7.0. RNA were run on 1X TBE/7M Urea denaturing PAGE gels and visualized with Sybr-Gold stain.
Western blotting
For the western blot, Log-phase cells were induced with vanillate (0.5mM) for 6 hours or left uninduced. Upon induction, the cells were pelleted and resuspended in 250μl of 1x laemmli buffer for each 1.0 OD600 unit. The samples were boiled at 95°C for 5 minutes then vortexed. 15μl of samples were loaded in a 10% SDS-PAGE gel and run at 200V for 90 minutes. Semi-dry transfer was done at 40 milliamps for 1 hour after which the membrane was dried for 1 hour at room temperature (in the dark). The membrane was rewet in 100% methanol for 15 seconds and rinsed in Milli-Q water for 2 minutes. Blocking was done for 1 hour using 15ml of blocking buffer (1xPBS, 0.1% tween20, 0.05g/ml non-fat dry milk) at room temperature with gentle shaking. For primary antibody blotting, the membrane was submerged in (1:1000) dilution of the α-RNE antibody (Ben Luisi, U. Cambridge) in the same blocking buffer and shacked gently for 1 hour at room temperature. After washing the membrane 3 times with the same blocking buffer for 10 minutes the membrane was probed with secondary antibody (1:5000) anti-rabbit IgG secondary antibody (thermo-scientific) in blocking buffer. Secondary antibody incubation was done for 1 hour with gentle shaking at room temperature. The membrane was then washed 3 times, 10 minutes each, with 1x PBS buffer with gentle shaking. Following the wash, the membrane was placed in Pierce chemiluminescence substrates for 5 minutes and imaged on film.
BR-body RNase digestion assay
JS138 (ASM) cells were grown in PYE medium supplemented with gentamycin (0.5μg/ml), kanamycin (5μg/ml), and 0.2% xylose for 15 hours. The next day, cells were washed three times with 1 ml of PYE and incubated in three dilutions in PYE supplemented with gentamycin (0.5μg/ml), kanamycin (5μg/ml), and vanillate (5μM and grown overnight (15 hours). The next morning, log-phase cells (OD 0.2–0.3) were harvested and pelleted at 16Kxg at 4°C and then resuspended in 2ml of lysis buffer (35mM NaCl, 20mM Tris-HCl pH 7.04, 1mM EDTA-free protease inhibitor tablet, 1mM BME (freshly added), small pinch of Lysozyme and 0.8 U of RNase free DNase I) and flash frozen by dripping into liquid nitrogen. Cells were lysed in a mixer mill MM400 in 50mL chambers for 6 rounds at 15Hz for 2 minutes under liquid nitrogen. The lysate was thawed at room temperature and transferred into eppendorf tubes. The tubes were spun at 2000xg for 5 minutes at 4°C and the supernatant and pellet fractions were separated. 8 uls of the supernatant were either treated with 2μg of RNase A (2μl of 1mg/ml) or mock treated with 2μl of milliQ water and incubated at room temperature for 60 minutes. The entire 10μl reaction was then spotted on a glass microscope slide and imaged under a coverslip.
Purification of RNase E CTD-YFP
The C-terminal half of RNase E from C. crescentus (451–898) harboring an N-terminal His6 tag and a C-terminal YFP fusion was expressed from plasmid [pET28-RNE(CTD)-YFPC] that was transformed into chemically competent BL21 (DE3) cells before being plated onto selective LB-Miller media (50 µg/mL kanamycin plates) and incubated overnight at 37 °C. From a single colony, an overnight 60 mL LB-Miller culture (50 µg/mL kanamycin) was inoculated and incubated overnight at 37 °C. From this saturated culture, 6 L of LB-Miller media (50 µg/mL kanamycin) was inoculated and grown to mid-log phase (~0.5 OD600). Expression of RNase E (451–898) was induced with 1 mM isopropyl-β-D-thiogalactopyranoside (IPTG) for 4 hours at 37 °C. The cells were then collected at 4 °C, 4000 × g, for 30 minutes. The resulting pellet was washed with 50 mL 50 mM HEPES pH 8.0, 500 mM NaCl before being pelleted again at 4 °C, 4000 × g, for 30 minutes and stored at −80 °C.
Cells were thawed on ice and resuspended in 100 mL of lysis buffer (1 M NaCl, 20 mM Tris-Cl pH 7.4, 20 mM imidazole pH 7.0, 1 mM β-mercaptoethanol [βME], 20 U DNase I, and 0.1% Triton X-100, supplemented with SIGMAFAST™ protease inhibitor tablets [Sigma]). The cells were lysed by continuous passage through an Avestin EmulsiFlex-C3 at 15,000 psi for 30 minutes. Cell debris was pelleted by ultracentrifugation (4 °C, 20000 × g, 30 minutes). The supernatant was then incubated with 6 mL of a 50% slurry of Ni-NTA agarose at 4 °C for 2 hours. The Ni-NTA agarose was separated by a gravity column and washed with 30 mL wash buffer (150 mM NaCl, 20 mM Tris-Cl pH 7.4, 40 mM imidazole pH 7.0, 1 mM βME). RNase E (451–898) was eluted from the Ni-NTA agarose with 10 mL portions of elution buffer (150 mM NaCl, 20 mM Tris-Cl pH 7.4, 200 mM imidazole pH 7.0, 1 mM βME). The eluate was concentrated by a 30 kDa MWCO Amicon Centrifugal Filter Unit to 1 mL before being loaded onto a HiLoad Superdex 16/600 200 pg gel-filtration column (GE Healthcare) and eluted with storage buffer (150 mM NaCl, 20 mM Tris-Cl pH 7.4). Fractions containing RNase E were collected and concentrated using Amicon Centrifugal Filter Units (30 kDa MWCO) to ~30 mg/mL (M.W. = 80.77 kDa, ε280 = 55,600 M−1cm−1) before being aliquoted, flash-frozen in LN2, and stored at −80 °C.
Purification of Unlabeled RNase E:
The C-terminal half of RNase E from C. crescentus RNase E(451–898) harboring an N-terminal His6 tag was expressed from plasmid [pTEV5-RNE(CTD)] that was transformed into chemically competent BL21 (DE3) cells before being plated onto selective LB-Miller media (50 µg/mL ampicillin plates) and incubated overnight at 37 °C. From a single colony, an overnight 60 mL LB-Miller culture (50 µg/mL ampicillin) was inoculated and incubated overnight at 37 °C. From this saturated culture, 6 L of LB-Miller media (50 µg/mL ampicillin) was inoculated and grown to mid-log phase (~0.5 OD600). Expression of RNase E (451–898) was induced with 1 mM isopropyl-β-D-thiogalactopyranoside (IPTG) for 4 hours at 37 °C. The cells were then collected at 4 °C, 4000 × g, for 30 minutes. The resulting pellet was washed with 50 mL 50 mM HEPES pH 8.0, 500 mM NaCl before being pelleted again at 4 °C, 4000 × g, for 30 minutes and stored at −80 °C.
Cells were thawed on ice and resuspended in 100 mL of lysis buffer (1 M NaCl, 20 mM Tris-Cl pH 7.4, 20 mM imidazole pH 7.0, 1 mM β-mercaptoethanol [βME], 20 U DNase I, and 0.1% Triton X-100, supplemented with SIGMAFAST™ protease inhibitor tablets [Sigma]). The cells were lysed by continuous passage through an Avestin EmulsiFlex-C3 at 15,000 psi for 30 minutes. Cell debris was pelleted by centrifugation (4 °C, 20000 × g, 30 minutes). The supernatant was then incubated with 6 mL of a 50% slurry of Ni-NTA agarose at 4 °C for 2 hours. The Ni-NTA agarose was separated by centrifugation at 700 × g for 2 minutes, washed with 3 ×10 mL wash buffer (150 mM NaCl, 20 mM Tris-Cl pH 7.4, 40 mM imidazole pH 7.0, 1 mM βME), and pelleted again at 700 × g for 2 minutes. The Ni-NTA Agarose beads were placed into a gravity column before being eluted with 2 mL portions of elution buffer (150 mM NaCl, 20 mM Tris-Cl pH 7.4, 200 mM imidazole pH 7.0, 1 mM βME). The eluate was concentrated by a 30 kDa MWCO Amicon Centrifugal Filter Unit to ~750 µL with a final concentration of ~6 mg/mL (M.W. = kDa, ε280 = 38,055 M−1cm−1) before being aliquoted, flash-frozen in LN2, and stored at −80 °C.
Labeling of RNase E CTD with BODIPY-FL Maleimide Dye
Purified unlabeled RNase E (451–898) dialyzed at 4 °C into 150 mM NaCl and 20 mM Tris-Cl (pH 7.4). A 10-fold molar excess of DTT was added to the solution before being dialyzed again in 150 mM NaCl and 20 mM Tris-Cl (pH 7.4). BODIPY-FL Maleimide dye (ThermoFisher) was dissolved into DMSO to a final concentration of 10 mM. The dye was added to the protein solution in roughly a 10:1 molar ratio of dye to protein. The dye was allowed to react with the protein at room temperature for 2 hours, protected from light. Excess βME was added to the reaction to quench any excess BODIPY-FL maleimide dye. The protein was dialyzed into 50 mM NaCl and 20 mM Tris (pH 7.4) before being concentrated with a 30 kDa MWCO Amicon Centrifugal Filter Unit to ~250 µL and a final concentration of ~12 mg/mL. The concentrate was aliquoted, flash-frozen in LN2, and stored at −80 °C.
Liquid-liquid phase separated condensate assembly assay
RNase E CTD (451–898) protein aliquots were thawed on ice along with solutions of DTT, poly(A), NaCl, and DNase/RNase-free water. All solutions were passaged through a 0.2 µm cellulose acetate syringe filter (VWR) and were stored in polypropylene 1.7 mL or 2.0 mL tubes (VWR). Prior to imaging, VistaVision microscope slides (VWR) were cleaned by rinsing in DNase/RNase-free water at ~70 °C before being soaked in RNase AWAY™ (ThermoFisher) overnight.
Working solutions of RNase E (451–898)-YFP, RNA, and NaCl were combined, diluted with sterile-filtered DNase/RNase-free water to various concentrations, and allowed to incubate on ice for no more than 1 hour prior to imaging. Microscope slides were blow-dried with air before 10 µL were pipetted onto the slides and covered with coverslips (VWR). All images were taken with an Eclipse Ti-E inverted microscope (Nikon) in both phase-contrast and fluorescent channels using a Plan Apo 100x objective. Phase diagrams were generated by yes/no scoring for condensate assembly based on fluorescent imaging.
In the case of BODIPY-RNase E, Working solutions of RNase E (451–898) and BODIPY-RNase E were added in a 2.25:1 ratio and combined with DNase/RNase-free water and 0.5 mM DTT, followed by addition of RNA or NaCl. . The solutions were allowed to incubate on ice for no more than 1 hour prior to imaging. Microscope slides rinsed with clean water before SureSeal™ Imaging Spacers (Electron Microscopy Sciences) were added, 10 µL of solution were pipetted onto the slides, and covered with coverslips (VWR). All images were taken with an Eclipse Ti-E inverted microscope (Nikon) in both phase-contrast and fluorescent channels using a Plan Apo 100x/1.45 oil objective. Phase diagrams were generated by yes/no scoring for droplet formation based on a droplet:background intensity ratio greater than 1.30.
Immunofluorescence
2 mls of Log-phase JS8 cells grown for 16 hours in the presence or absence of xylose and NA1000 cells grown in M2G or treated with 10% ethanol (10 minutes) were fixed with 1% formaldehyde for 30 minutes at 28°C in a shaker incubator. The cells were pelleted at 5200xg for 2 minutes and washed 3 times with PBST buffer (140mM NaCL, 3mM KCl, 8mM Na2HPO4, and 0.05% Tween-20). The cells were resuspended gently in 0.2 mL GTE (50mM glucose, 10mM EDTA, 20mM Tris-HCL (pH 7.0), and 5 µg/ml lysozyme) and incubated at room temperature for 30 minutes. A drop of these cells were placed onto a glass slide pre-coated with 0.1% w/v poly-lysine and left to air dry (20–30 minutes). The samples were washed 3 times with PBST, submerged in ice cold ethanol for 5 minutes flowed by submerging in ice cold acetone for 30 seconds then air dried. The samples were rehydrated in PBST and blocked at room temperature for 15 minutes using PBST with 2% BSA. The samples were probed with the α-RNase E antibody (1:1000 dilution) for one hour after which they were washed 3 times with PBST and blocked again for 15 minutes. Secondary antibody was then added in the dark, with 2 µg/ml of the Donkey Anti-Rabbit IgG (H+L) Highly Cross-Adsorbed Secondary Antibody, Alexa Fluor 488 and 1 µg/ml 4′6-diamidino-2-phenylindole (DAPI) for one hour. In the dark, the samples were washed 3 times with PBST followed with one wash with milliQ purified water. A drop of mounting media (50mg p-phenylenediamine dissolved in 10ml of BPS and PH adjusted to pH 9.0 and added to 45ml of glycerol and stirred until mixed and stored at −20°C). The samples were covered with a coverslip, sealed with paraffin wax and imaged with GFP and DAPI cubes.
qRT-PCR assay to measure RNA half-life
1 ml of log-phase (OD600 0.3–0.6) Caulobacter crescentus cells untreated (0 minutes) or treated with (200 ng) rifampicin for the indicated time points (1, 3, and 3 minutes) were added immediately to 2 mL of RNAprotect Bacterial Reagent (Qiagen), immediately vortexed, and incubated at room temperature for 5 minutes. The cells were pelleted at (20000xg) for 1 minute and resuspended in 1mL of 65°C hot TRizol Reagent (Ambion) and incubated 65°C for 10 minutes in a heat block. 200uL of chloroform were added to the samples and the tubes were incubated at room temperature for 5 minutes before spinning at (20,000xg) for 10 minutes. RNA samples were chloroform extracted once and precipitated using isopropanol (1x volume isopropanol, 0.1X volume 5M NaAc pH 5.2) overnight at – 80°C. The RNA samples were spun at 20,000 × g at 4°C for 1 hour, pellets were washed with 80% ethanol for 10 minutes, dried for 5 minutes, and resuspended in 25uL of 10 mM Tris-HCl (pH 7.0). The RNA samples were quantified using the qubit fluorimeter and the qRT-PCR reactions were performed using 200 ng of total RNA samples according to the NEB Luna universal one-step-qRT-PCR kit on a stratagene MX3000P qRT-PCR machine (Primers in Table S5).
Live-dead cell staining:
1 mL of JS42 log-phase Caulobacter crescentus cells grown in the presence or absence of xylose overnight (16 hours) were treated with 1 µL of (100µM) BacLight™ Red Bacterial Stain for 15 minutes in the dark and imaged with Texas red cube on an M2G 1.5% agarose pad.
Polysome profiling
Polysome profiling was performed similarly to (Schrader et al., 2014). 1L of NA1000 cells grown in either M2G or PYE media were treated with 100 µg/mL chloramphenicol for 2 minutes, then mixed with equal volume of ice cubes of the same growth media containing 100 µg/mL chloramphenicol. Cells were harvested by centrifugation, washed 1 time in 10mL resuspension buffer (20mM Tris pH 8.0, 10mM MgCl2, 100mM NH4Cl, 1mM Chloramphenicol), resuspended in lysis buffer (20mM Tris pH 8.0, 10mM MgCl2, 100mM NH4Cl, 1mM Chloramphenicol, 0.4% Triton X100, 0.1% NP-40, and 100U/mL RNase free DNase I (roche)) and dripped into liquid nitrogen. Cells were lysed 5 times at 15 Hz for 3 minutes in a Retsch MM400 mixer mill in 50mL jars with a 25mm grinding ball. Lysate was then thawed at room temp, incubated on ice for 20 min, insoluble material was pelleted at 20,000 xg for 10 min at 4°C, then loaded onto a 10–55% sucrose gradient made with (20mM Tris pH 8.0, 10mM MgCl2, 100mM NH4Cl, 1mM Chloramphenicol). Samples were spun in a Ti45 rotor at 35,000 rpm for 2.5 hours in an ultracentrifuge then fractionated on a BIO-COMP gradient station with a speed of 0.2 mm/s and the A260 across the gradient was recorded
Charge pattern detection
Charge patterning of the RNase E CTD was determined by assigning each amino acid a nominal charge of −1 for aspartic acid (D) and glutamic acid (E), +1 for arginine (R), histidine (H), and lysine (K), or 0 for all other amino acids, as previously described (Nott et al., 2015). The “net charge” around a particular amino acid was calculated by summing the nominal charges in a 11-amino acid window centered around the amino acid in question. Charged regions ranged between about 15–40 amino acids in length. The “net charge” was plotted for each α-proteobacterium, aligning the first positively-charged block in the intrinsically disordered CTD as predicted by IUPred (Dosztanyi et al., 2005).
Quantification and statistical analysis
Foci quantification
In vivo RNase E foci were quantified using Microbe J (Ducret et al., 2016). Cell outlines were first identified using the medial axis algorithm in the phase channel with minimal cell length of 1.3 µm and the segmentation option. Cell outlines were then manually curated to remove cells containing erroneous outlines. Next, the maxima function was used with “foci” option with minimal area of 0.01 µm2 and maximal length of 1 µm with the segmentation option on and the association inside option on. Tolerance and Z-score options were set to be equal for a set of images being compared. Welch’s 2- tailed T-test using unequal variances were then performed on all individual samples relative to the control. To quantify the per cell fraction of RNase E in foci we summed the intensity of YFP signal in all foci identified within a cell divided by the total YFP intensity of the cell.
qRT-PCR quantification
mRNA half-lives were determined by fitting the Ln(fraction remaining) to a linear curve fit and converted the slope a half-life using (half-life=-Ln(2)/slope). For each sample, we performed a minimum of three half-life replicates and calculated the average half-life and standard error (σ/√n) with n= the number of half-life determinations. Welch’s 2-tailed T-test using unequal variances were then performed on all mutant samples relative to the wild-type control.
Supplementary Material
Highlights.
Caulobacter RNase E forms BR-bodies containing RNA degradosome proteins
RNase E CTD is necessary and sufficient for biomolecular condensate formation
BR-bodies are assembled in the presence of RNA and dissociate upon cleavage
BR-bodies can be induced upon some cell stresses and provide stress resistance
Acknowledgements
This research was supported by NIGMS of the National Institutes of Health under award number R35GM124733 (JMS), startup funds from Wayne State University (JMS) and University of Pittsburgh (WSC). The authors thank O.C. Uhlenbeck for the T7 RNApol plasmid, G.R. Bowman for the msfGFP plasmid, M. Davidson for DsRed2-pBAD (Addgene plasmid # 54608), and B.F. Luisi for the α-RNase E antibody. The authors thank members of the Alcedo, Ansari, Meller, Beningo, and Higgs labs for sharing equipment and reagents. The authors thank O.C. Uhlenbeck, members of the Higgs lab, and C. Bayas for thoughtful discussion.
Footnotes
Publisher's Disclaimer: This is a PDF file of an unedited manuscript that has been accepted for publication. As a service to our customers we are providing this early version of the manuscript. The manuscript will undergo copyediting, typesetting, and review of the resulting proof before it is published in its final citable form. Please note that during the production process errors may be discovered which could affect the content, and all legal disclaimers that apply to the journal pertain.
Declaration of Interests
The authors declare no competing interests exist.
Data and software availability
References
- Aguirre AA, Vicente AM, Hardwick SW, Alvelos DM, Mazzon RR, Luisi BF, and Marques MV (2017). Association of the Cold Shock DEAD-Box RNA Helicase RhlE to the RNA Degradosome in Caulobacter crescentus. J. Bacteriol 199. [DOI] [PMC free article] [PubMed] [Google Scholar]
- Ait-Bara S, and Carpousis AJ (2015). RNA degradosomes in bacteria and chloroplasts: classification, distribution and evolution of RNase E homologs. Mol. Microbiol 97, 1021–1135. [DOI] [PubMed] [Google Scholar]
- Banani SF, Lee HO, Hyman AA, and Rosen MK (2017). Biomolecular condensates: organizers of cellular biochemistry. Nat. Rev. Mol. Cell Biol 18, 285–298. [DOI] [PMC free article] [PubMed] [Google Scholar]
- Barry RM, Bitbol AF, Lorestani A, Charles EJ, Habrian CH, Hansen JM, Li HJ, Baldwin EP, Wingreen NS, Kollman JM, et al. (2014). Large-scale filament formation inhibits the activity of CTP synthetase. eLife 3, e03638. [DOI] [PMC free article] [PubMed] [Google Scholar]
- Bayas CA, Wang J, Lee MK, Schrader JM, Shapiro L, and Moerner WE (2018). Spatial organization and dynamics of RNase E and ribosomes in Caulobacter crescentus Proceedings of the National Academy of Sciences, In Press. [DOI] [PMC free article] [PubMed] [Google Scholar]
- Boeynaems S, Alberti S, Fawzi NL, Mittag T, Polymenidou M, Rousseau F, Schymkowitz J, Shorter J, Wolozin B, Van Den Bosch L, et al. (2018). Protein Phase Separation: A New Phase in Cell Biology. Trends Cell Biol [DOI] [PMC free article] [PubMed]
- Brangwynne CP (2013). Phase transitions and size scaling of membrane-less organelles. J. Cell Biol 203, 875–881. [DOI] [PMC free article] [PubMed] [Google Scholar]
- Brangwynne CP, Eckmann CR, Courson DS, Rybarska A, Hoege C, Gharakhani J, Julicher F, and Hyman AA (2009). Germline P granules are liquid droplets that localize by controlled dissolution/condensation. Science 324, 1729–1732. [DOI] [PubMed] [Google Scholar]
- Brengues M, Teixeira D, and Parker R (2005). Movement of eukaryotic mRNAs between polysomes and cytoplasmic processing bodies. Science 310, 486–489. [DOI] [PMC free article] [PubMed] [Google Scholar]
- Callaghan AJ, Marcaida MJ, Stead JA, McDowall KJ, Scott WG, and Luisi BF (2005). Structure of Escherichia coli RNase E catalytic domain and implications for RNA turnover. Nature 437, 1187–1191. [DOI] [PubMed] [Google Scholar]
- Christen B, Abeliuk E, Collier JM, Kalogeraki VS, Passarelli B, Coller JA, Fero MJ, McAdams HH, and Shapiro L (2011). The essential genome of a bacterium. Mol. Syst. Biol 7, 528. [DOI] [PMC free article] [PubMed] [Google Scholar]
- Courchaine EM, Lu A, and Neugebauer KM (2016). Droplet organelles? EMBO J 35, 1603–1612. [DOI] [PMC free article] [PubMed] [Google Scholar]
- Domian IJ, Quon KC, and Shapiro L (1997). Cell type-specific phosphorylation and proteolysis of a transcriptional regulator controls the G1-to-S transition in a bacterial cell cycle. Cell 90, 415–424. [DOI] [PubMed] [Google Scholar]
- Dosztanyi Z, Csizmok V, Tompa P, and Simon I (2005). IUPred: web server for the prediction of intrinsically unstructured regions of proteins based on estimated energy content. Bioinformatics 21, 3433–3434. [DOI] [PubMed] [Google Scholar]
- Ducret A, Quardokus EM, and Brun YV (2016). MicrobeJ, a tool for high throughput bacterial cell detection and quantitative analysis. Nat Microbiol 1, 16077. [DOI] [PMC free article] [PubMed] [Google Scholar]
- Elbaum-Garfinkle S, Kim Y, Szczepaniak K, Chen CC-H, Eckmann CR, Myong S, and Brangwynne CP (2015a). The disordered P granule protein LAF-1 drives phase separation into droplets with tunable viscosity and dynamics. Proceedings of the National Academy of Sciences 112, 7189. [DOI] [PMC free article] [PubMed] [Google Scholar]
- Elbaum-Garfinkle S, Kim Y, Szczepaniak K, Chen CC, Eckmann CR, Myong S, and Brangwynne CP (2015b). The disordered P granule protein LAF-1 drives phase separation into droplets with tunable viscosity and dynamics. Proc. Natl. Acad. Sci. U. S. A 112, 7189–7194. [DOI] [PMC free article] [PubMed] [Google Scholar]
- Grousl T, Ivanov P, Frydlova I, Vasicova P, Janda F, Vojtova J, Malinska K, Malcova I, Novakova L, Janoskova D, et al. (2009). Robust heat shock induces eIF2alpha-phosphorylation-independent assembly of stress granules containing eIF3 and 40S ribosomal subunits in budding yeast, Saccharomyces cerevisiae. J. Cell Sci 122, 2078–2088. [DOI] [PubMed] [Google Scholar]
- Hammarlof DL, Bergman JM, Garmendia E, and Hughes D (2015). Turnover of mRNAs is one of the essential functions of RNase E. Mol. Microbiol 98, 34–45. [DOI] [PubMed] [Google Scholar]
- Hardwick SW, Chan VS, Broadhurst RW, and Luisi BF (2011). An RNA degradosome assembly in Caulobacter crescentus. Nucleic Acids Res 39, 1449–1459. [DOI] [PMC free article] [PubMed] [Google Scholar]
- Jain C, and Belasco JG (1995). RNase E autoregulates its synthesis by controlling the degradation rate of its own mRNA in Escherichia coli: unusual sensitivity of the rne transcript to RNase E activity. Genes Dev 9, 84–96. [DOI] [PubMed] [Google Scholar]
- Kahng LS, and Shapiro L (2003). Polar localization of replicon origins in the multipartite genomes of Agrobacterium tumefaciens and Sinorhizobium meliloti. J. Bacteriol 185, 3384–3391. [DOI] [PMC free article] [PubMed] [Google Scholar]
- Kedersha N, Stoecklin G, Ayodele M, Yacono P, Lykke-Andersen J, Fritzler MJ, Scheuner D, Kaufman RJ, Golan DE, and Anderson P (2005). Stress granules and processing bodies are dynamically linked sites of mRNP remodeling. J. Cell Biol 169, 871–884. [DOI] [PMC free article] [PubMed] [Google Scholar]
- Khemici V, Poljak L, Luisi BF, and Carpousis AJ (2008). The RNase E of Escherichia coli is a membrane-binding protein. Mol. Microbiol 70, 799–813. [DOI] [PMC free article] [PubMed] [Google Scholar]
- Laloux G, and Jacobs-Wagner C (2014). How do bacteria localize proteins to the cell pole? J. Cell Sci 127, 11–19. [DOI] [PMC free article] [PubMed] [Google Scholar]
- Landgraf D, Okumus B, Chien P, Baker TA, and Paulsson J (2012). Segregation of molecules at cell division reveals native protein localization. Nat. Methods 9, 480–482. [DOI] [PMC free article] [PubMed] [Google Scholar]
- Le TB, Imakaev MV, Mirny LA, and Laub MT (2013). High-resolution mapping of the spatial organization of a bacterial chromosome. Science 342, 731–734. [DOI] [PMC free article] [PubMed] [Google Scholar]
- Lin Y, Protter DS, Rosen MK, and Parker R (2015). Formation and Maturation of Phase-Separated Liquid Droplets by RNA-Binding Proteins. Mol. Cell 60, 208–219. [DOI] [PMC free article] [PubMed] [Google Scholar]
- Mohanty BK, and Kushner SR (2016). Regulation of mRNA Decay in Bacteria. Annu. Rev. Microbiol 70, 25–44. [DOI] [PubMed] [Google Scholar]
- Montero Llopis P, Jackson AF, Sliusarenko O, Surovtsev I, Heinritz J, Emonet T, and Jacobs-Wagner C (2010). Spatial organization of the flow of genetic information in bacteria. Nature 466, 77–81. [DOI] [PMC free article] [PubMed] [Google Scholar]
- Nott TJ, Petsalaki E, Farber P, Jervis D, Fussner E, Plochowietz A, Craggs TD, Bazett-Jones DP, Pawson T, Forman-Kay JD, et al. (2015). Phase transition of a disordered nuage protein generates environmentally responsive membraneless organelles. Mol. Cell 57, 936–947. [DOI] [PMC free article] [PubMed] [Google Scholar]
- Oh E, Becker AH, Sandikci A, Huber D, Chaba R, Gloge F, Nichols RJ, Typas A, Gross CA, Kramer G, et al. (2011). Selective ribosome profiling reveals the cotranslational chaperone action of trigger factor in vivo. Cell 147, 1295–1308. [DOI] [PMC free article] [PubMed] [Google Scholar]
- Ono M, and Kuwano M (1979). A conditional lethal mutation in an Escherichia coli strain with a longer chemical lifetime of messenger RNA. J. Mol. Biol 129, 343–357. [DOI] [PubMed] [Google Scholar]
- Ow MC, and Kushner SR (2002). Initiation of tRNA maturation by RNase E is essential for cell viability in E. coli. Genes Dev 16, 1102–1115. [DOI] [PMC free article] [PubMed] [Google Scholar]
- Parker R, and Sheth U (2007). P bodies and the control of mRNA translation and degradation. Mol. Cell 25, 635–646. [DOI] [PubMed] [Google Scholar]
- Quan J, and Tian J (2011). Circular polymerase extension cloning for high-throughput cloning of complex and combinatorial DNA libraries. Nat Protoc 6, 242–251. [DOI] [PubMed] [Google Scholar]
- Ramachandran V, Shah KH, and Herman PK (2011). The cAMP-dependent protein kinase signaling pathway is a key regulator of P body foci formation. Mol. Cell 43, 973–981. [DOI] [PMC free article] [PubMed] [Google Scholar]
- Rudner DZ, and Losick R (2010). Protein subcellular localization in bacteria. Cold Spring Harb. Perspect. Biol 2, a000307. [DOI] [PMC free article] [PubMed] [Google Scholar]
- Russell JH, and Keiler KC (2009). Subcellular localization of a bacterial regulatory RNA. Proc. Natl. Acad. Sci. U. S. A 106, 16405–16409. [DOI] [PMC free article] [PubMed] [Google Scholar]
- Schrader JM, and Shapiro L (2015). Synchronization of Caulobacter crescentus for investigation of the bacterial cell cycle. J. Vis. Exp, e52633. [DOI] [PMC free article] [PubMed]
- Schrader JM, Zhou B, Li GW, Lasker K, Childers WS, Williams B, Long T, Crosson S, McAdams HH, Weissman JS, et al. (2014). The coding and noncoding architecture of the Caulobacter crescentus genome. PLoS Genet 10, e1004463. [DOI] [PMC free article] [PubMed] [Google Scholar]
- Shah KH, Zhang B, Ramachandran V, and Herman PK (2013). Processing body and stress granule assembly occur by independent and differentially regulated pathways in Saccharomyces cerevisiae. Genetics 193, 109–123. [DOI] [PMC free article] [PubMed] [Google Scholar]
- Sheth U, and Parker R (2003). Decapping and decay of messenger RNA occur in cytoplasmic processing bodies. Science 300, 805–808. [DOI] [PMC free article] [PubMed] [Google Scholar]
- Strahl H, Turlan C, Khalid S, Bond PJ, Kebalo JM, Peyron P, Poljak L, Bouvier M, Hamoen L, Luisi BF, et al. (2015). Membrane recognition and dynamics of the RNA degradosome. PLoS Genet 11, e1004961. [DOI] [PMC free article] [PubMed] [Google Scholar]
- Taghbalout A, and Rothfield L (2007). RNaseE and the other constituents of the RNA degradosome are components of the bacterial cytoskeleton. Proc. Natl. Acad. Sci. U. S. A 104, 1667–1672. [DOI] [PMC free article] [PubMed] [Google Scholar]
- Teixeira D, Sheth U, Valencia-Sanchez MA, Brengues M, and Parker R (2005). Processing bodies require RNA for assembly and contain nontranslating mRNAs. RNA 11, 371–382. [DOI] [PMC free article] [PubMed] [Google Scholar]
- Thanbichler M, Iniesta AA, and Shapiro L (2007). A comprehensive set of plasmids for vanillate- and xylose-inducible gene expression in Caulobacter crescentus. Nucleic Acids Res 35, e137. [DOI] [PMC free article] [PubMed] [Google Scholar]
- Van Treeck B, Protter DSW, Matheny T, Khong A, Link CD, and Parker R (2018). RNA self-assembly contributes to stress granule formation and defining the stress granule transcriptome. Proceedings of the National Academy of Sciences 115, 2734. [DOI] [PMC free article] [PubMed] [Google Scholar]
- Voss JE, Luisi BF, and Hardwick SW (2014). Molecular recognition of RhlB and RNase D in the Caulobacter crescentus RNA degradosome. Nucleic Acids Res 42, 13294–13305. [DOI] [PMC free article] [PubMed] [Google Scholar]
- Werner JN, Chen EY, Guberman JM, Zippilli AR, Irgon JJ, and Gitai Z (2009). Quantitative genome-scale analysis of protein localization in an asymmetric bacterium. Proc. Natl. Acad. Sci. U. S. A 106, 7858–7863. [DOI] [PMC free article] [PubMed] [Google Scholar]
- Wheeler JR, Matheny T, Jain S, Abrisch R, and Parker R (2016). Distinct stages in stress granule assembly and disassembly. eLife 5. [DOI] [PMC free article] [PubMed] [Google Scholar]
- Winkler J, Seybert A, Konig L, Pruggnaller S, Haselmann U, Sourjik V, Weiss M, Frangakis AS, Mogk A, and Bukau B (2010). Quantitative and spatio-temporal features of protein aggregation in Escherichia coli and consequences on protein quality control and cellular ageing. EMBO J 29, 910–923. [DOI] [PMC free article] [PubMed] [Google Scholar]
- Zhang Y, and Hong G (2009). Post-transcriptional regulation of NifA expression by Hfq and RNase E complex in Rhizobium leguminosarum bv. viciae. Acta Biochim Biophys Sin (Shanghai) 41, 719–730. [DOI] [PubMed] [Google Scholar]
- Zhou B, Schrader JM, Kalogeraki VS, Abeliuk E, Dinh CB, Pham JQ, Cui ZZ, Dill DL, McAdams HH, and Shapiro L (2015). The Global Regulatory Architecture of Transcription during the Caulobacter Cell Cycle. PLoS Genet 11, e1004831. [DOI] [PMC free article] [PubMed] [Google Scholar]
Associated Data
This section collects any data citations, data availability statements, or supplementary materials included in this article.