Abstract
BACKGROUND
A challenge for R2 and R2* methods in measuring liver iron concentration (LIC) is that fibrosis, fat, and other hepatic cellular pathology contribute to R2 and R2* and interfere with LIC estimation.
PURPOSE
To examine the interfering effects of fibrosis, fat and other lesions on R2* LIC estimation and to use quantitative susceptibility mapping (QSM) to reduce these distortions.
STUDY TYPE
Prospective
PHANTOMS AND SUBJECTS
Water phantoms with various concentrations of gadolinium (Gd), collagen (Cl, modeling fibrosis) and fat, 9 healthy controls with no known hepatic disease, 9 patients with known or suspected hepatic iron overload, and 9 patients with focal liver lesions.
FIELD STRENGTH/SEQUENCE
The phantoms and human subjects were imaged using a 3D multi-echo gradient-echo on clinical 1.5T and 3T MRI systems.
ASSESSMENT
QSM and R2* images were postprocessed from the same gradient-echo data. Fat contributions to susceptibility and R2* were corrected in signal models for LIC estimation.
STATISTICAL TESTS
Polynomial regression analyses were performed to examine relations among susceptibility, R2* and true [Gd] and [Cl] in phantoms, and among susceptibility and R2* in patient livers.
RESULTS
In phantoms, R2* had a strong nonlinear dependency on [Cl], [fat] and [Gd], while susceptibility was linearly dependent (R2>0.98). In patients, R2* was highly sensitive to liver pathological changes, including fat, fibrosis and tumors, while QSM was relatively insensitive to these abnormalities (P=0.015). With moderate iron overload, liver susceptibility and R2* were not linearly correlated over a common R2* range [0, 100] sec−1 (P=0.35).
DATA CONCLUSION
R2* estimation of LIC is prone to substantial nonlinear interference from fat, fibrosis and other lesions. QSM processing of the same gradient echo MRI data can effectively minimize the effects of cellular pathology.
Keywords: quantitative susceptibility mapping, QSM, liver iron concentration, magnetic susceptibility, cellularity
INTRODUCTION
Measurement of liver iron concentration (LIC) is critical for assessing the magnitude of the body iron burden in the diagnosis and management of both hereditary and acquired forms of iron overload1. During iron overload, the amount of iron in the functional and transport pools changes only slightly, with almost all the excess iron sequestered in the paramagnetic state. Specifically, the excess iron is stored as ferric iron in ferritin and hemosiderin, and is deposited in the liver within hepatocytes and macrophages2. MRI is highly sensitive to paramagnetic iron and has emerged as the primary non-invasive modality for tissue iron quantification needed in evaluating iron overload and monitoring iron chelating therapy3. The transverse relaxation rate R2 (=1/T2), and the faster and more sensitive R2* (= 1/T2*), have been measured by commercially available MRI pulse sequences to quantify LIC4,5.
A major challenge for the R2 and R2* methods in measuring LIC is that fibrosis, fat, and other histologic changes in hepatic cellularity contribute to R2 and R2* and interfere with LIC estimation6. Given that an eventual consequence of liver iron overload is the induction of fibrosis, hepatic fibrosis is reported in 50-94% of patients with transfusional iron overload4,7,8. Fibrosis effects may contribute to the large error range [−71%, 74%] in the currently FDA-approved R2-based LIC measurement5,8. These errors in liver iron estimation can thus be problematic in clinical practice. For example, a patient with an R2 LIC of 5.0 mg Fe/g liver dry weight (dw), which is within the optimal range of iron-chelating therapy for thalassemia major patients9, may have a biopsy LIC ranging from 1.5 mg Fe/g dw, indicating that chelator administration should be stopped to avoid chelator toxicity9, to 8.7 mg Fe/g dw, indicating that the chelator dose should be increased to avoid iron toxicity9. Using data from livers with cirrhosis and other lesions, some authors suggest that the large error range is the consequence of variability in biopsy samples5. Several studies, including a recent prospective study in patients with transfusional liver iron overload10, have consistently demonstrated that the biopsy sampling error is about 7% with adequate biopsy samples (≥ 1 mg dw) in the absence of cirrhosis10,11.
A correction for fat chemical shift as a confounding contribution to R2* estimation from the MRI signal has recently been established12 and constitutes an important advance in fatty liver LIC estimation3. However, the biophysical connection between LIC and R2* remains unexamined and needs consideration. The biophysical connection between iron and R2* has been investigated in the context of quantifying oxygen consumption or paramagnetic iron in deoxyheme in brain functional MRI or calibrated fMRI13, and demonstrate that the relationship between R2* and iron concentration is complex and nonlinear. In general, R2 and R2* are sensitive to, and depend on, the microenvironment of water interactions, the spatial distribution of iron within a voxel, and sources of interference such as fat and fibrosis. These interfering effects are difficult to model quantitatively and to compensate for in iron quantification13.
While the magnitude data of the multi-echo gradient-echo (GRE) MRI is used to generate R2*, the phase data can be used to generate quantitative susceptibility maps (QSM) to directly measure magnetic susceptibility14,15 without blooming artifacts found in R2*16. QSM has become robust17 and reliably reproducible18–21. QSM has been applied to abdominal organs by accounting for the fat contribution to the measured signal phase22–25. Magnetic susceptibility is an intrinsic tissue property that is linearly related to liver iron23,25. The fat contribution to tissue susceptibility can be linearly compensated according to chemical composition. Other tissue cellularity changes including fibrosis and edema involve only weakly diamagnetic biomolecules and may not substantially affect susceptibility13. Therefore, the linear connection between magnetic susceptibility measured on QSM and LIC allows accurate LIC quantification by QSM. Recently, QSM was compared with R2* for LIC measurements25, and demonstrated that the correlation of QSM with R2* was much stronger for R2* in the high range [0,750] sec−1 (750 sec−1 corresponding to severe iron overload) than for R2* in the moderate range [0,259] sec−1 (259 sec−1 corresponding to moderate iron overload). The contributions of severe iron overload to R2 and R2* dominate over those from fibrosis. With the moderate iron overload commonly seen in current clinical care in resource-rich countries, interference from fibrosis on R2* as compared to the iron contribution to R2* becomes substantial, disrupting the linear relation between R2* and iron concentration26. Therefore, we propose to investigate the interfering effects of fibrosis and fat on R2* estimation of LIC by comparing R2* with QSM.
MATERIALS AND METHODS
Phantom
Collagen is a major component of liver fibrosis27 and was used to model fibrosis in vitro. A paramagnetic gadolinium (Gd) contrast agent, instead of iron oxide nanoparticle agent28, was used to provide a stable solution for imaging experiments. Five collagen-water-gadolinium phantoms, each consisting of 6 balloons (28-mm diameter) containing water doped with collagen and Gd, were constructed to investigate R2* and susceptibility values in the presence of collagen. This yielded 30 balloons of various collagen/water concentrations comprised of 5 collagen concentrations ([Cl]) = 0, 5.0%, 10.0%, 15.0%, and 30.0%, and 6 different Gd concentrations ([Gd]) =0, 1.25, 2.5, 5.0, 7.5, and 10.0 mmol/L. The collagen-water-Gd solutions were made from type I collagen (Shanghai Macklin Biochemical Co., Ltd, China) and Gd agent (Shanghai XudongHaipu Pharmaceutical Co., Ltd, China). The 6 balloons in each phantom were embedded in water in a plastic cuboid container.
Four fat-water-gadolinium (Gd) phantoms, each consisting of 6 balloons (28-mm diameter) containing water doped with fat and Gd, were constructed to investigate R2* and susceptibility values in the presence of fat. This yielded 24 balloons of various fat/water concentrations comprised of 4 fat concentrations ([Fat]) = 0, 14.3, 28.9, and 43.7%, and 6 different Gd concentrations ([Gd]) =0, 1.25, 2.5, 5.0, 7.5, and 10.0 mmol/L. The fat-water-Gd solutions were made from mayonnaise (Olinesa Ltd., Bulgaria) and Gd agent (Shanghai XudongHaipu Pharmaceutical Co., Ltd, China). The 6 balloons in each phantom were embedded in water in a plastic cuboid container.
Human Subjects
Nine healthy controls with no known hepatic disease, 9 patients with known or suspected hepatic iron overload, and 9 patients with focal liver lesions participated in this IRB approved HIPAA compliant study. All participants provided written informed consent. Subjects with iron overload had either thalassemia (n=2), myelodysplastic syndrome (n=5), or cirrhosis(n=2).
MR Imaging
The collagen-water-Gd and fat-water-Gd phantoms were studied using a clinical 3.0T MR imaging system (MAGNETOM Trio Tim; Siemens Healthcare, Erlangen, Germany). QSM and R2* maps of the phantoms were obtained from the same three dimensional (3D) unipolar readout multi-echo GRE sequence with the following parameters: TR = 30ms, TE1 = 1.24ms, ΔTE = 2.08ms, number of echoes = 8, flip angle (FA) = 10°, matrix size = 256×232×48, spatial resolution = 1.5mm×1.5mm×2.0 mm. To reduce the noise floor effect and accurately measure R2*, 3 more interleaved shots were acquired and a total of 32 echoes with echo space of 0.52ms were used for magnitude fitting.
The subjects with no known hepatic disease, and those with known or suspected hepatic iron overload were studied using a clinical 1.5T MR imaging system (MAGNETOM Aera; Siemens Healthcare, Erlangen, Germany) with a combination of spine and torso coils. Liver QSM and R2* maps were obtained from the same 3D bipolar readout multi-echo GRE sequence with the following parameters: TR = 10.0ms, TE1 = 1.44ms, ΔTE = 1.36ms, number of echoes = 6, FA = 6°, matrix size= 224×168×44, spatial resolution = 1.7mm×1.7 mm×5.0 mm. Additionally, a generalized auto-calibrating partially parallel acquisition with acceleration factor of 2 in the anterior-posterior direction and elliptical sampling were used to reduce acquisition time19. The scans lasted 14 seconds and were readily completed during a single breath hold.
The subjects with focal lesions were imaged using a clinical 3.0T MR imaging system (MAGNETOM Verio; Siemens Healthcare, Erlangen, Germany). QSM and R2* maps of the liver were obtained from the same 3D unipolar readout GRE sequence with the following parameters: TR = 14.0ms, TE1 = 1.49ms, ΔTE = 2.06ms, number of echoes = 6, FA = 10°, matrix size = 256×176×26, spatial resolution = 1.5mm×1.5mm×5.0 mm. The scans lasted 20 seconds and were completed during a single breath hold. Conventional MR images, including T1-weighted, T2-weighted, diffusion-weighted and post-contrast T1-weighted images, were also acquired for complete lesion assessment.
QSM and R2* reconstruction
Phase images were extracted from the complex MRI data. Phase discrepancies between odd and even echoes in the bipolar readout gradients caused by non-ideal gradient behaviors were first measured, modeled as polynomials in space, and corrected in field mapping. Simultaneous Phase Unwrapping and Removal of chemical Shift (SPURS)24 using graph cuts with conditional jump moves was then performed on the phase images, followed by field map fine-tuning with T2*-IDEAL with a single R2* model for combined water-fat12. The SPURS-T2*-IDEAL output was then processed with background field removal using the projection-onto-dipole-field method, and the remaining magnetic field was processed to generate a susceptibility map using the morphology enabled dipole inversion algorithm29. A schematic view of QSM reconstruction is shown in Fig. 1.
Figure 1.
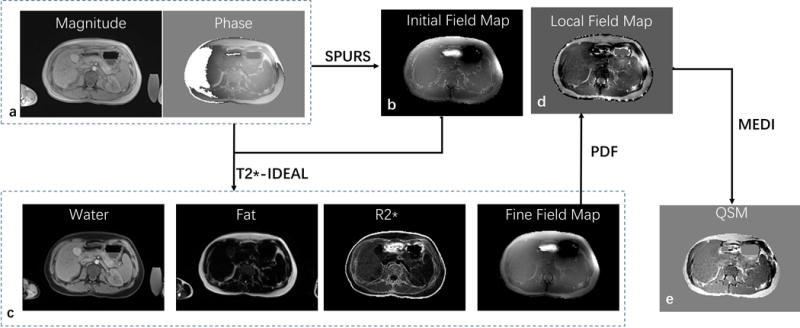
Schematic view of the liver QSM process. First, Simultaneous Phase Unwrapping and Removal of chemical Shift (SPURS) initializes the inhomogeneity magnetic field (b) with R2* initialized with zero. Second, T2*-IDEAL is solved, outputting fat, water, R2* and field (c); The SPURS-T2*-IDEAL output is then processed with background field removal using the projection-onto-dipole-field (PDF) method, and the remaining magnetic field (d) is processed to generate a susceptibility map (e) using the morphology enabled dipole inversion algorithm (MEDI).
For R2* mapping of the fat-water-Gd phantoms and liver, Levenberg-Marquardt non-linear fitting was used to fit the magnitude components of the multi-echo data with the multipeak fat model after complex-based water-fat separation12, with dual-echo flexible-TE method for data from the 1.5T MRI system, and IDEAL method for data from 3T MRI system. A single R2* model for combined water-fat was used for both the fat-water-Gd phantoms and liver.
Data analysis
Liver magnetic susceptibility was measured on QSM using region of interest (ROI) analysis. The latissimus dorsi muscle, regarded as not being affected by transfusional iron overload30, was used as the zero reference for susceptibility. ROIs of approximately 12cm2 were placed on the liver region away from major vessels. ROIs of approximately 4cm2 were placed on the nearby latissimus dorsi muscle. ROIs for focal lesions were placed in the lesions, with an area corresponding to just below lesion size. Contrast to noise ratio (CNR) of lesion to neighboring normal appearing liver was measured in R2* and in susceptibility maps for each patient with focal liver lesions. Noise was defined as the standard deviation of signal intensity of neighboring normal appearing liver.
The fat contribution to liver susceptibility was calculated according to an estimated relative fat density, and was removed from the measured liver susceptibility to generate fat corrected QSM. Our implementation of relative fat density estimation included the following steps: intensity inhomogeneity due to receiver coils was first estimated using a level set method31 and was then used to scale the fat image into a relative fat density estimate. The fat contribution to liver susceptibility χF was calculated using the following equation:
| (1) |
where ρF is the signal intensity of liver in the fat image. Human adipose tissue is composed largely of oleic acid and pure oleic acid has a volume susceptibility XOA = 0.75ppm32. ρOA is the mean signal intensity of regions with subcutaneous fat in the fat image. Eq. 1 assumes that subcutaneous fat is pure oleic acid and overcomes the relative fat density division difficulties in poor signal regions.
Statistical analyses were carried out using SPSS for Windows version 17.0. Linear regression analysis was performed to compare liver magnetic susceptibility with liver R2*. Correlation equations where R2* or susceptibility depends on the chemical composition were calculated using a non-linear fitting procedure (cftool) in Matlab 2014b (The Mathworks, Natwick, MA). The fat contribution to the measured susceptibility was estimated using data without Gd and then corrected for all fat-water-Gd phantoms.
RESULTS
Figure 2 shows the measured R2* and susceptibility maps from collagen-water-Gd phantoms. At [Gd] = 1.25mmol/L, a 10% increase in collagen concentration [Cl] from 0 to 10% caused a 98.35% increase in R2* from 8.49 to 16.84 sec−1 and a 14.64% decrease in susceptibility from 0.396 to 0.338 ppm (Fig. 2m). R2* was nonlinearly dependent on [Cl] and [Gd], whereas susceptibility was linearly dependent on [Cl] and [Gd] (Table 1).
Figure 2.
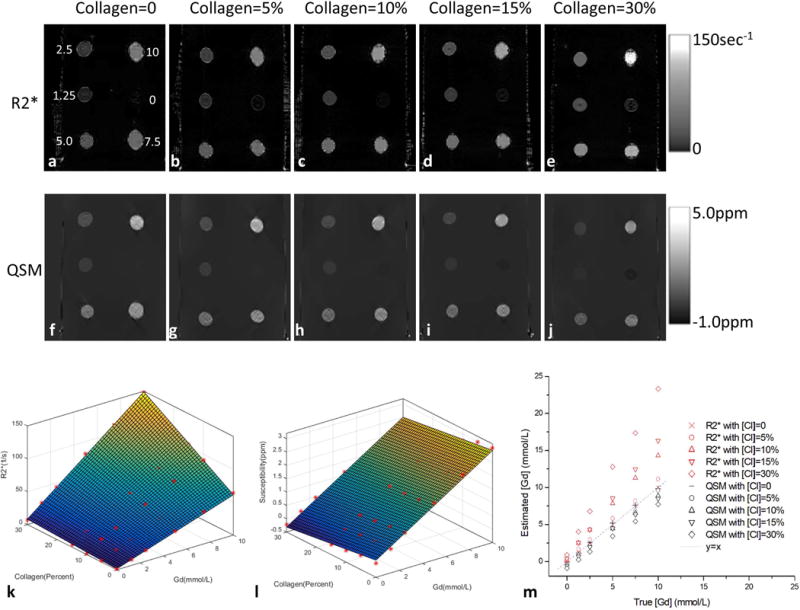
(a–e) R2* and (f–j) susceptibility images of the five collagen-water-Gd phantoms with balloons of varying Gd concentration ([Gd]) and collagen concentration ([Cl]). (k&l) plots of R2* and magnetic susceptibility values versus [Gd] and [Cl]: R2* had a quadratic term [Cl][Gd] while susceptibility had only linear terms. (m) plots of true [Gd] versus estimated [Gd] which were calculated using the relationship without collagen as a reference.
Table 1.
Correlation equations that R2* or susceptibility value depends on the chemical composition.
| Phantom | Fat Correction | Correlation Equation | R2 |
|---|---|---|---|
| collagen-water-Gd | – | R2* ([Cl],[Gd])= 1.38+23.01[Cl]+5.99[Gd]+26.95[Gd][Cl] | 0.997 |
| – | χ([Cl],[Gd]) = 0.1379−1.5020[Cl] + 0.2818[Gd] | 0.996 | |
| fat-water-Gd | – | R2* ([Fat],[Gd]) = 3.68+4.63([Fat]+0.093)([Gd]+2.133)2 | 0.992 |
| No | χ([Fat],[Gd]) = 0.0811+0.6532[Fat] + 0.2993[Gd], | 0.981 | |
| Yes | χ([Fat],[Gd]) = 0.0736−0.0869[Fat] + 0.2993[Gd] | 0.982 |
χ, susceptibility value; [Cl], collagen concentration; [Gd], Gd concentration; [Fat], Fat concentration.
Figure 3 shows the measured R2* and susceptibility maps from fat-water-Gd phantoms. At [Gd] = 1.25mmol/L, a 14.3% increase in fat concentration [Fat] from 0 to 14.3% caused a 78.68% increase in R2* from 8.96 to 16.01 sec−1 and a 14.90% increase in susceptibility from 0.443 to 0.509 ppm. R2* was nonlinearly dependent on [Fat] and [Gd], whereas susceptibility without fat correction was linearly dependent on [Fat] and [Gd] (Table 1). Susceptibility with fat correction had little dependence on [Fat] and displayed a linear dependence on [Gd] (Table 1).
Figure 3.
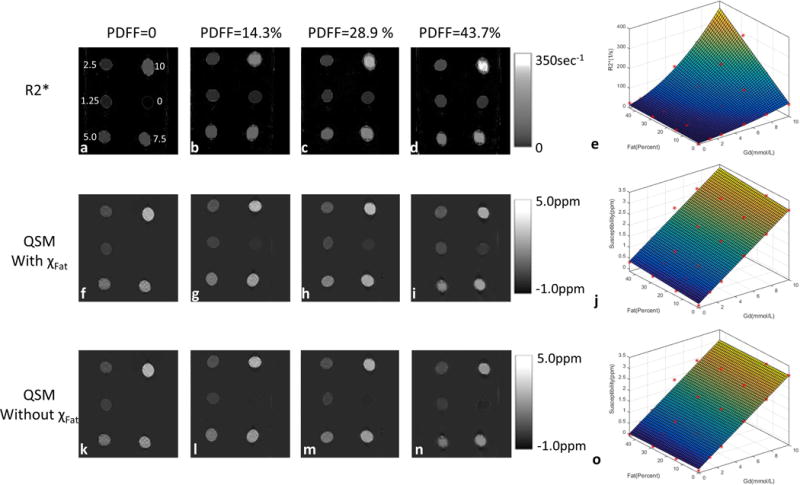
(a–d) R2*, (f–i) susceptibility with χFat and (ka–o)susceptibility without χFat images of the 4 fat-water-Gd phantoms with balloons of varying Gd concentration ([Gd]) and proton-density fat-fraction (PDFF). (e,j&o) plots of R2*, magnetic susceptibility with χFat and magnetic susceptibility without χFat versus [Gd] and PDFF: R2* had a cubic term PDFF[Gd]2 and a quadratic term [Gd]2, but susceptibility had only linear terms. Susceptibility with fat correction had little dependence on [Fat].
Water/fat separation was successful in all 9 controls and in 17 of 18 patients. Separation failed in one patient with very high hepatic iron overload. The GRE images from this patient had a detectable liver signal only in the first echo and this patient was therefore excluded from further analyses. Figure 4 shows the water map, fat map, susceptibility map with fat contribution, and susceptibility map without fat contribution from a normal subject. The fat contribution to liver susceptibility can be corrected.
Figure 4.
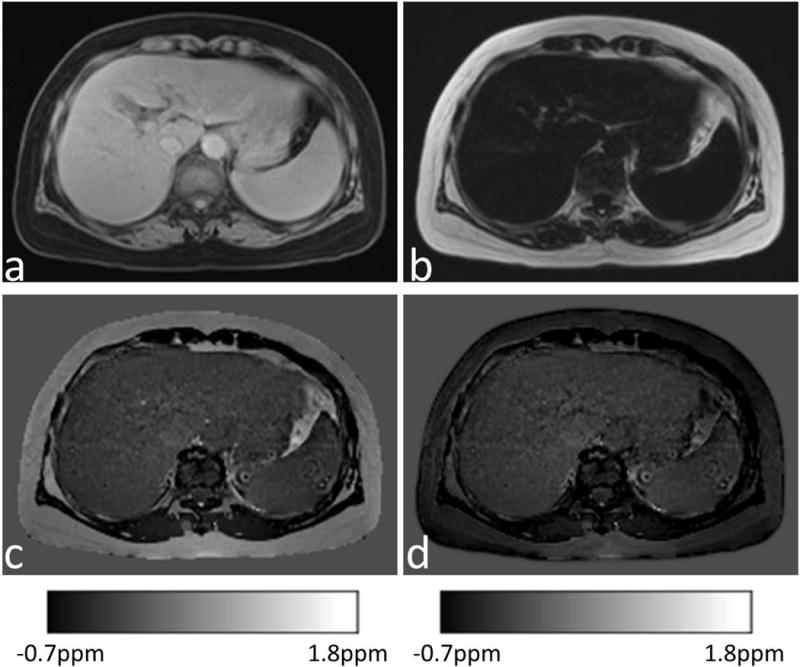
(a) Water image, (b) fat image, and (c&d) corresponding susceptibility map with χFat and without χFat from a normal subject.
Focal lesions in patients included hemangiomas (n=3), hepatocellular carcinoma (HCC, n=1), suspected cholangiocarcinomas or metastases (n=3), multiple malignant tumors (n=1), and multiple liver metastases after interventional therapy (n=1). The focal lesions had substantial effects on R2* but minimal effects on fat-corrected QSM. The mean CNRs of lesion to neighboring normal appearing liver were 4.72±2.67 in R2* maps and 1.44±1.31 in QSM maps. The CNRs decreased significantly in QSM maps as compared to R2* maps (P=0.015). Examples are shown in Figures 5–6.
Figure 5.
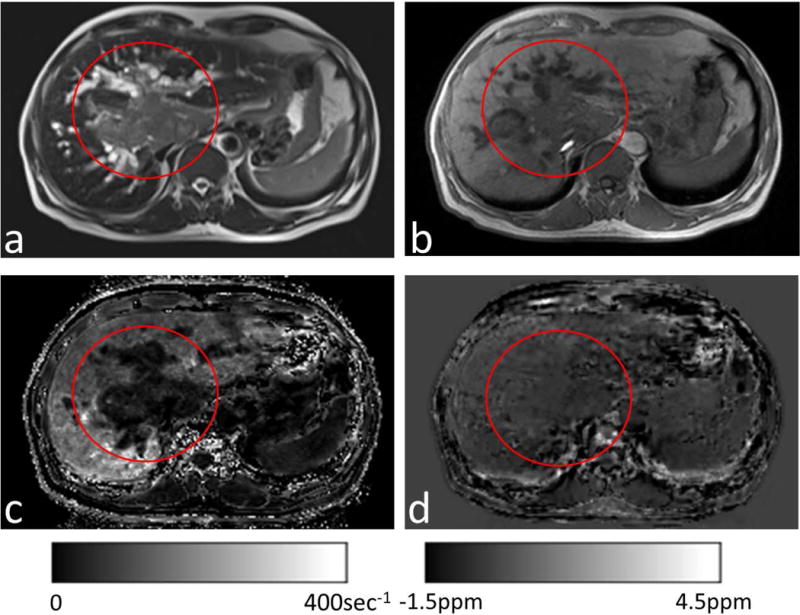
(a) T2-weighted and (b)T1-weighted images from a patient with suspected HCC (red circles). (c) Corresponding R2* maps and (d) susceptibility maps without χFat. The tumor showed a slight increase in water and consequently very small R2*(c). The normal-appearing liver (outside the red circle) had substantial fat, which substantially increased R2* (c) but only slightly affected QSM (d).
Figure 6.
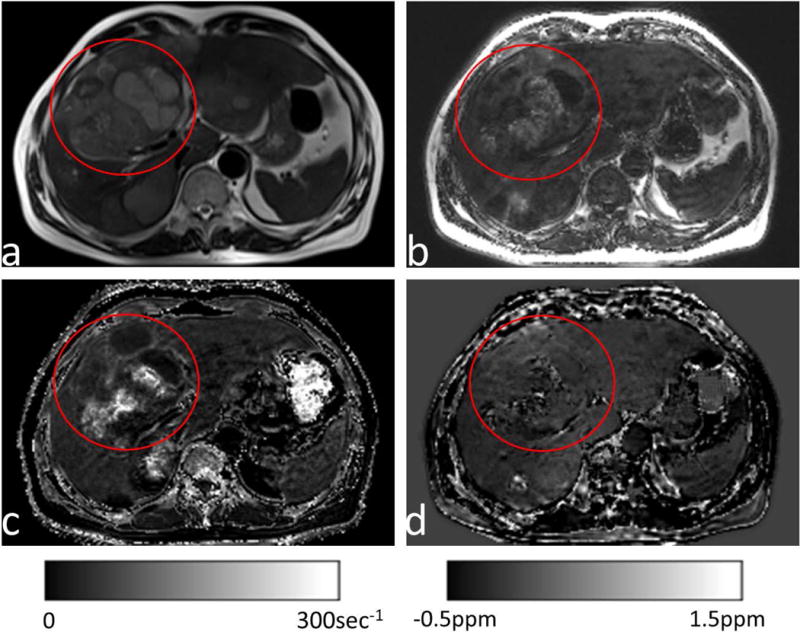
(a) T2-weighted and (b) fat images from a patient with multiple liver metastases (red circles) after interventional therapy with transarterial chemoembolization using Lipiodol. (c&d) Corresponding R2* maps and susceptibility maps without χFat.The residual Lipiodol appeared as an increase in fat (b), which strongly increased R2* (c), but had little effect on QSM (d).
Figure 5 shows the results from a patient with suspected HCC. There was a sharp contrast between the lesion (mean R2* of 32 sec−1) and the adjacent normal-appearing liver tissue (mean R2* of 121 sec−1). This contrast did not coincide with the smooth spatial distribution of iron overload, but was spatially concordant with the sharp contrasts in the T1-weighted and T2-weighted images. The mean susceptibility without fat contribution was 0.081 ppm in the lesion, which gradually increased to 0.455 ppm in the neighboring normal appearing liver tissue.
Figure 6 shows the results from a patient with multiple liver metastases after interventional therapy with transarterial chemoembolization using Lipiodol. The metastases displayed a complex inhomogeneous signal on R2* (Fig. 6c), but there were only marginal changes on QSM (Figs. 6d). Residual bright spots were present on QSM (Fig. 6d) at the treated site, consistent with hemorrhage.
Figure 7 shows the R2* and susceptibility maps from a normal subject and a patient with moderate iron overload. As iron levels increased, both susceptibility and R2* increased. For the patient with moderate iron overload, there was also suspected fibrosis in the left lobe that did not affect QSM but increased R2* (red arrows in the 2nd row).
Figure 7.
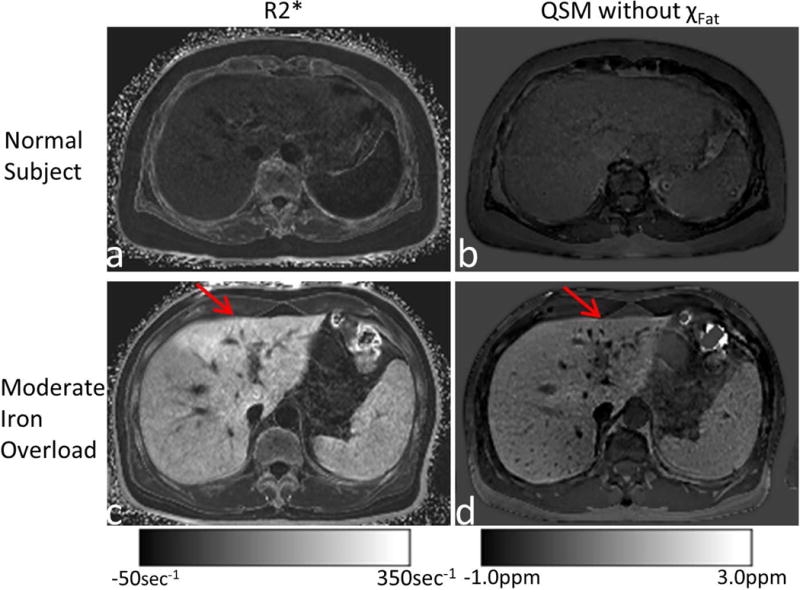
R2* (left column) and susceptibility (right column) maps from a normal subject (top row) and a patient with moderate iron overload (bottom row). For the patient with moderate iron overload, there was suspected fibrosis in the left lobe (red arrows), which increased R2* but did not affect QSM.
For all subjects with no known hepatic disease and those with known or suspected hepatic iron overload, there was no linear correlation between liver magnetic susceptibility and R2* in ROIs without lesions when R2*< 100 sec−1 (P=0.35, Fig. 8b). However, a moderate linear correlation was seen over a large R2* range up to near 500 sec−1 (R2=0.797, P<0.0001, Fig. 8a).
Figure 8.
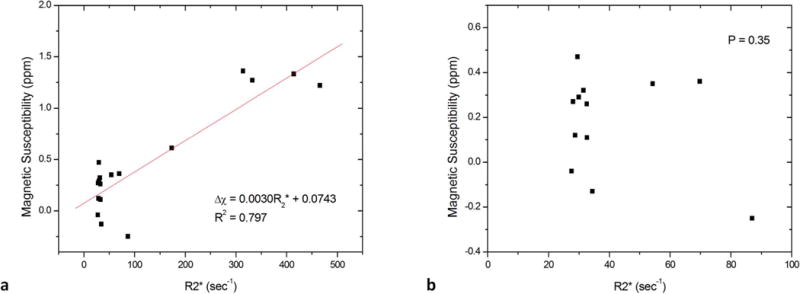
There was (a) a moderate linear correlation between liver magnetic susceptibility and R2* in ROIs over all the data points with R2*< 500 sec−1; (b) but no linear correlation over data points with R2*< 100 sec−1.
DISCUSSION
Our phantom data clearly demonstrate the strong nonlinear interfering effects of fibrosis and fat in the R2* estimation of [Gd]; this finding is consistent with the known complex nonlinear relationship between deoxyheme iron and R2* in calibrated fMRI13. The cellularity effects on R2 form the foundation for diagnosing lesions on T2-weighted imaging in clinical MRI, but they interfere with R2 and R2*(=R2+R2′) iron estimation. The interfering effects of cellular pathology may help explain the very large error range in the current FDA-approved R2-based LIC measurement5,8. This large error cannot be explained by biopsy sampling variability, which is about ±7% for biopsies with a dry weight of 1 mg or more in cirrhosis-free livers10.
Our in vivo data on liver iron mapping in 27 subjects demonstrate that liver pathology, including cysts, fibrosis, hemangioma, hepatocellular carcinoma, cholangiocarcinoma and fatty infiltration, generates R2* image contrasts, interferes with R2* estimation, but has little or no effect on QSM. Lesions without fat or hemorrhage may have strong contrasts on R2*, typically hypointensity or decreased values, but no contrast on QSM, consistent with the smooth spatial distribution of iron overload2,10. The fat contribution to susceptibility was corrected on QSM according to a linear tissue composition model. Our results suggest that QSM without lesion contrasts can be virtually immune to R2* cellularity interferences, making QSM accurate for quantifying LIC. These examples are intended to illustrate the effects of a variety of liver lesions on R2* and their virtual elimination with QSM. The regional contrast difference between R2* and QSM is also noticeable in a recent publication25. The lack of linear correlation between R2* and QSM for moderate liver iron overload (Fig. 8b), a finding similar to recent work on QSM versus R2* for LIC estimation25, suggests the presence of substantial interference by fibrosis on R2*.
Clinically, a challenge in the current MRI measurement of LIC is to correct for R2 and R2* cellular interference3,6, including fibrosis, fat, inflammation and other cellular changes that are often associated with tissue damage from iron overload33. Fibrosis interference on R2 and R2* is strong and depends on the detailed microenvironment of the water–fibrosis interaction13, in a complex manner that is influenced not only by the fibrotic stage, but also by the distribution of fibrosis within a voxel5. The contribution of captured free water by fibrosis may significantly increase the correlation time of water protons, and hence, the R2 relaxation rate. In contrast, weakly diamagnetic fibrosis contributes linearly to susceptibility, and no appreciable contrast may be present on QSM for moderate fibrosis. Fundamentally, R2 and R2* are derived from the MRI signal magnitude, which depends on cellularity in complex ways that are difficult to quantify13. Monte Carlo modeling can be used to investigate clinical iron calibration curves in vivo34, but requires detailed prior knowledge including concentration, susceptibility, particle size, distribution, and volume fraction for each tissue component in the liver.
Similarly, the fat fraction can be well quantified in the presence of iron primarily using the unique chemical shifts of fat6,12,35; its linear contribution to QSM can be corrected for iron quantification. In contrast, the fat interfering effects on R2 and R2* depend on the detailed microenvironment of the water–fat interaction and the fat spatial distribution within a voxel, both of which are difficult to model and counteract. It should be noted that in theory, fat suppression does not affect the fat contribution to the relaxation of the cellular microenvironment (R2), the electronic susceptibility, or R2* of water13, assuming no exchange between fat and water protons. In practice, spectral imperfections in fat suppression pulses interfere with R2 and R2* estimation36.
Fortunately, MRI signal phase allows rigorous biophysical modeling for the determination of tissue magnetic susceptibility in QSM13,29. As a molecular electron cloud property, standard linear chemical decomposition, can be applied to tissue susceptibility, thus enabling iron quantification with a direct biophysical definition. Similarly, QSM may correct for susceptibility contributions from other cellular sources to accurately measure iron. This correction task has been made simple by the fact that fibrosis and most other types of cellular interference have very small susceptibilities relative to water. The prevalent moderate hepatic fibrosis in patients with transfusional iron overload may cause negligible susceptibility but substantial R2*effects4,7,8.
Consistent with the literature6,35, we observed decreased R2* in the presence of liver metastases, hemangioma, and malignant tumors, whereas the susceptibility values in these lesions were similar to adjacent normal liver. This can be explained by increases in water content in lesions that reduce R2* but have negligible effects on susceptibility. Liver fat increased R2*. The residual Lipiodol in metastases was seen as increased fat and strongly increased R2*, but had little effect on QSM. The residual bright spots on QSM at treated sites may be explained by hemorrhage that occurred during interventional treatment. The case of suspected HCC may present particularly interesting findings. The liver tissue neighboring the lesion has a mean R2* of 121 sec−1 and susceptibility of 0.455 ppm, high values indicative of iron overload. The QSM reveals a gradual decrease from the lesion periphery to the lesion center, which may be related to hypervascularity and inflammation at the tumor margins with necrosis in the tumor center.
In this work, liver tissue susceptibility was modeled from paramagnetic iron (with gadolinium substituted in the phantom studies) and fat. Through signal phase analysis, the chemical shift of fat allows fat quantification (SPURS + T2*-IDEAL24) and subsequent QSM22–24. The intravoxel mixture of fat and water with different susceptibilities causes additional field inhomogeneity within a voxel and increases the apparent R2* that depends on imaging parameters including voxel size, field strength, and echo time12. Marked iron overload may dominate contributions to R2* and lead to a linear correlation between QSM and R2*23,25. The linear correlation between liver magnetic susceptibility measured on QSM and R2* is lost in patients with mild iron overload and hepatic fibrosis, which are prevalent complications among patients with transfusional iron overload4,7,8. This lack of correlation between R2* and QSM is likely due to the interfering effects of fibrosis that affect R2* but not susceptibility.
Breath-hold scans were performed for liver QSM data acquisition to reduce respiratory motion artifacts. The long TR and TEs in a standard 5-minute brain QSM protocol are not acquired for liver QSM, so that the scan time is drastically shortened to fit within a breath-hold. As known from T2w, the optimal sampling TE to maximize T2* contrast in T2*w is T2*. For field unwrapping and minimal distortion, QSM data should be acquired using high bandwidth with multiple echoes. Therefore, TEs larger than T2* are not acquired, as they are not T2* contrast-to-noise-ratio (CNR) efficient. However, TEs smaller than T2* are acquired to fully utilize all available time for data sampling. Hence, we set the maximal sampling TE to be around a targeted T2* of ~ 15 msec.
Patients with no known hepatic disease and those with known or suspected hepatic iron overload were scanned on 1.5T and 3T systems. QSM reproducibility has been reported between 1.5T and 3T scanners for both brain18,19 and liver23. Magnetic susceptibility measured on QSM as an intrinsic tissue magnetic property determined by electron clouds is independent of field strength. Therefore, it is meaningful and practical to compare QSM across all subjects at various field strengths. However, our comparison of QSM with R2* (1/T2*) is limited to one field strength (1.5T), because T2* is an MRI signal voxel decay model parameter that is not an intrinsic tissue property and is highly dependent on field strength and other imaging parameters.
There are some limitations to this study. The number of patients was relatively small. Patients with focal lesions were useful in validating QSM’s effectiveness for overcoming R2* cellular interference in mapping LIC. Patients with liver fibrosis caused by diffuse iron overload are of great clinical concern and will be a focus of recruitment in future studies. Water/fat separation failed in a patient with severe hepatic iron overload and the subsequent extremely rapid signal decay. To generate QSM and R2*, UTE sequences may be used to acquire sufficient signal on patients with very rapid T2* signal decay37. We did not correlate our findings with biopsy iron quantification and immunohistochemistry essays. Biopsies were not performed on these patients, but would provide iron validation on LIC estimates by QSM and R2*. Biopsy immunohistochemistry would also help us interpret QSM and R2* in a molecular/cellular mechanistic manner similar to studies on white matter lesions in multiple sclerosis38. The fat contribution to liver susceptibility was compensated using the signal intensities of liver and subcutaneous fat in the fat image after correcting for intensity inhomogeneity due to receiver coils. The proton density fat fraction (PDFF) map can be generated from the multi-gradient-echo images; this has been shown to be an accurate, repeatable, and reproducible measure of liver fat concentration3,6. In future work, Eq. 1 can be modified using PDFF. Both 1.5T and 3T scanners were used in this study due to their availabilities for phantom and patient studies. This may be justifiable for studying moderate liver iron overload in the majority of thalassemia major patients cared for in the USA according to the established reproducibility of R2*36,39,40 and QSM18,19 at these two field strengths. As R2 data were not available in patient studies, this study was limited to comparison of QSM with R2*. Ferritin iron stores were not available for constructing phantoms. The relaxation effects in liver iron overload with fibrosis are highly dependent on the microenvironment of the fibrosis-iron-water interactions and may involve interconnected components of fibrosis increasing correlation time, inner sphere effects of proton exchange with iron complexes, and outer sphere effects of water protons diffusing in the vicinity of paramagnetic iron13. Our collagen-gadolinium-water phantoms may have similar levels of fibrosis, increased correlation time, and demonstrate the outer sphere effects of water proton diffusion in the vicinity of paramagnetic gadolinium. However, they may have differing inner sphere effects of proton exchange with gadolinium molecules. In studying liver fibrosis, its dominant effect of increasing correlation time would largely be replicated in the collagen-gadolinium-water phantom.
In conclusion, fibrosis, fat, edema and other cellular pathology may interfere with R2* estimation of liver iron concentration (LIC). QSM virtually eliminates such cellular interference for mapping LIC.
Acknowledgments
Grant Support:
This study was supported in part by The National Natural Science Foundation of China (81271533) and National Institute of Health of USA (R01NS095562).
References
- 1.Brittenham GM, Badman DG. Noninvasive measurement of iron: report of an National Institute of Diabetes, Digestive, Kidney Diseases (NIDDK) workshop. Blood. 2003;101:15–19. doi: 10.1182/blood-2002-06-1723. [DOI] [PubMed] [Google Scholar]
- 2.Aisen P, Enns C, Wessling-Resnick M. Chemistry and biology of eukaryotic iron metabolism. Int J Biochem Cell Biol. 2001;33:940–959. doi: 10.1016/s1357-2725(01)00063-2. [DOI] [PubMed] [Google Scholar]
- 3.Hernando D, Levin YS, Sirlin CB, Reeder SB. Quantification of liver iron with MRI: state of the art and remaining challenges. J Magn Reson Imaging. 2014;40:1003–1021. doi: 10.1002/jmri.24584. [DOI] [PMC free article] [PubMed] [Google Scholar]
- 4.Wood JC, Enriquez C, Ghugre N, et al. MRI R2 and R2* mapping accurately estimates hepatic iron concentration in transfusion-dependent thalassemia and sickle cell disease patients. Blood. 2005;106:1460–1465. doi: 10.1182/blood-2004-10-3982. [DOI] [PMC free article] [PubMed] [Google Scholar]
- 5.St Pierre TG, Clark PR, Chua-anusorn W, et al. Noninvasive measurement and imaging of liver iron concentrations using proton magnetic resonance. Blood. 2005;105:855–861. doi: 10.1182/blood-2004-01-0177. [DOI] [PubMed] [Google Scholar]
- 6.Sharma P, Altbach M, Galons JP, Kalb B, Martin DR. Measurement of liver fat fraction and iron with MRI and MR spectroscopy techniques. Diagn Interv Radiol. 2014;20:17–26. doi: 10.5152/dir.2013.13124. [DOI] [PMC free article] [PubMed] [Google Scholar]
- 7.Hankins JS, McCarville MB, Loeffler RB, et al. R2* magnetic resonance imaging of the liver in patients with iron overload. Blood. 2009;113:4853–4855. doi: 10.1182/blood-2008-12-191643. [DOI] [PMC free article] [PubMed] [Google Scholar]
- 8.St Pierre TG, El-Beshlawy A, Elalfy M, et al. Multicenter validation of spin-density projection-assisted R2-MRI for the noninvasive measurement of liver iron concentration. Magn Reson Med. 2014;71:2215–2223. doi: 10.1002/mrm.24854. [DOI] [PMC free article] [PubMed] [Google Scholar]
- 9.Olivieri NF, Brittenham GM. Iron-chelating therapy and the treatment of thalassemia. Blood. 1997;89:739–761. [PubMed] [Google Scholar]
- 10.Urru SA, Tandurella I, Capasso M, et al. Reproducibility of liver iron concentration measured on a biopsy sample: a validation study in vivo. Am J Hematol. 2015;90:87–90. doi: 10.1002/ajh.23878. [DOI] [PubMed] [Google Scholar]
- 11.Butensky E, Fischer R, Hudes M, et al. Variability in hepatic iron concentration in percutaneous needle biopsy specimens from patients with transfusional hemosiderosis. Am J Clin Pathol. 2005;123:146–152. doi: 10.1309/puuxegxdlh26nxa2. [DOI] [PubMed] [Google Scholar]
- 12.Hernando D, Kramer JH, Reeder SB. Multipeak fat-corrected complex R2* relaxometry: theory, optimization, and clinical validation. Magn Reson Med. 2013;70:1319–1331. doi: 10.1002/mrm.24593. [DOI] [PMC free article] [PubMed] [Google Scholar]
- 13.Wang Y. Principles of Magnetic Resonance Imaging: Physics Concepts, Pulse Sequences, and Biomedical Applications. CreateSpace Independent Publishing Platform; 2012. [Google Scholar]
- 14.de Rochefort L, Liu T, Kressler B, et al. Quantitative susceptibility map reconstruction from MR phase data using bayesian regularization: validation and application to brain imaging. Magn Reson Med. 2010;63:194–206. doi: 10.1002/mrm.22187. [DOI] [PubMed] [Google Scholar]
- 15.Kressler B, de Rochefort L, Liu T, Spincemaille P, Jiang Q, Wang Y. Nonlinear regularization for per voxel estimation of magnetic susceptibility distributions from MRI field maps. IEEE Trans Med Imaging. 2010;29:273–281. doi: 10.1109/TMI.2009.2023787. [DOI] [PMC free article] [PubMed] [Google Scholar]
- 16.Li J, Chang S, Liu T, et al. Reducing the object orientation dependence of susceptibility effects in gradient echo MRI through quantitative susceptibility mapping. Magn Reson Med. 2012;68:1563–1569. doi: 10.1002/mrm.24135. [DOI] [PMC free article] [PubMed] [Google Scholar]
- 17.Wang Y, Spincemaille P, Liu Z, et al. Clinical quantitative susceptibility mapping (QSM): Biometal imaging and its emerging roles in patient care. J Magn Reson Imaging. 2017;46:951–971. doi: 10.1002/jmri.25693. [DOI] [PMC free article] [PubMed] [Google Scholar]
- 18.Deh K, Nguyen TD, Eskreis-Winkler S, et al. Reproducibility of quantitative susceptibility mapping in the brain at two field strengths from two vendors. J Magn Reson Imaging. 2015;42:1592–1600. doi: 10.1002/jmri.24943. [DOI] [PMC free article] [PubMed] [Google Scholar]
- 19.Hinoda T, Fushimi Y, Okada T, et al. Quantitative Susceptibility Mapping at 3 T and 1.5 T: Evaluation of Consistency and Reproducibility. Invest Radiol. 2015;50:522–530. doi: 10.1097/RLI.0000000000000159. [DOI] [PubMed] [Google Scholar]
- 20.Lin PY, Chao TC, Wu ML. Quantitative susceptibility mapping of human brain at 3T: a multisite reproducibility study. AJNR Am J Neuroradiol. 2015;36:467–474. doi: 10.3174/ajnr.A4137. [DOI] [PMC free article] [PubMed] [Google Scholar]
- 21.Santin MD, Didier M, Valabregue R, et al. Reproducibility of R2 * and quantitative susceptibility mapping (QSM) reconstruction methods in the basal ganglia of healthy subjects. NMR Biomed. 2016 doi: 10.1002/nbm.3491. 10.1002/nbm.3491. [DOI] [PubMed] [Google Scholar]
- 22.Dimov AV, Liu T, Spincemaille P, et al. Joint estimation of chemical shift and quantitative susceptibility mapping (chemical QSM) Magn Reson Med. 2015;73:2100–2110. doi: 10.1002/mrm.25328. [DOI] [PMC free article] [PubMed] [Google Scholar]
- 23.Sharma SD, Hernando D, Horng DE, Reeder SB. Quantitative susceptibility mapping in the abdomen as an imaging biomarker of hepatic iron overload. Magn Reson Med. 2015;74:673–683. doi: 10.1002/mrm.25448. [DOI] [PMC free article] [PubMed] [Google Scholar]
- 24.Dong J, Liu T, Chen F, et al. Simultaneous phase unwrapping and removal of chemical shift (SPURS) using graph cuts: application in quantitative susceptibility mapping. IEEE Trans Med Imaging. 2015;34:531–540. doi: 10.1109/TMI.2014.2361764. [DOI] [PubMed] [Google Scholar]
- 25.Sharma SD, Fischer R, Schoennagel BP, et al. MRI-based quantitative susceptibility mapping (QSM) and R2* mapping of liver iron overload: Comparison with SQUID-based biomagnetic liver susceptometry. Magn Reson Med. 2017;78:264–270. doi: 10.1002/mrm.26358. [DOI] [PMC free article] [PubMed] [Google Scholar]
- 26.Aydinok Y, Porter JB, Piga A, et al. Prevalence and distribution of iron overload in patients with transfusion-dependent anemias differs across geographic regions: results from the CORDELIA study. Eur J Haematol. 2015;95:244–253. doi: 10.1111/ejh.12487. [DOI] [PubMed] [Google Scholar]
- 27.Petitclerc L, Sebastiani G, Gilbert G, Cloutier G, Tang A. Liver fibrosis: Review of current imaging and MRI quantification techniques. J Magn Reson Imaging. 2017;45:1276–1295. doi: 10.1002/jmri.25550. [DOI] [PubMed] [Google Scholar]
- 28.Hines CD, Yu H, Shimakawa A, McKenzie CA, Brittain JH, Reeder SB. T1 independent, T2* corrected MRI with accurate spectral modeling for quantification of fat: validation in a fat-water-SPIO phantom. J Magn Reson Imaging. 2009;30:1215–1222. doi: 10.1002/jmri.21957. [DOI] [PMC free article] [PubMed] [Google Scholar]
- 29.Wang Y, Liu T. Quantitative susceptibility mapping (QSM): Decoding MRI data for a tissue magnetic biomarker. Magn Reson Med. 2015;73:82–101. doi: 10.1002/mrm.25358. [DOI] [PMC free article] [PubMed] [Google Scholar]
- 30.Jensen PD. Evaluation of iron overload. Br J Haematol. 2004;124:697–711. doi: 10.1111/j.1365-2141.2004.04838.x. [DOI] [PubMed] [Google Scholar]
- 31.Li C, Huang R, Ding Z, Gatenby JC, Metaxas DN, Gore JC. A level set method for image segmentation in the presence of intensity inhomogeneities with application to MRI. IEEE Trans Image Process. 2011;20:2007–2016. doi: 10.1109/TIP.2011.2146190. [DOI] [PMC free article] [PubMed] [Google Scholar]
- 32.de Rochefort L, Brown R, Prince MR, Wang Y. Quantitative MR susceptibility mapping using piece-wise constant regularized inversion of the magnetic field. Magn Reson Med. 2008;60:1003–1009. doi: 10.1002/mrm.21710. [DOI] [PubMed] [Google Scholar]
- 33.Nahon P, Ganne-Carrie N, Trinchet JC, Beaugrand M. Hepatic iron overload and risk of hepatocellular carcinoma in cirrhosis. Gastroenterol Clin Biol. 2010;34:1–7. doi: 10.1016/j.gcb.2009.07.032. [DOI] [PubMed] [Google Scholar]
- 34.Ghugre NR, Wood JC. Relaxivity-iron calibration in hepatic iron overload: probing underlying biophysical mechanisms using a Monte Carlo model. Magn Reson Med. 2011;65:837–847. doi: 10.1002/mrm.22657. [DOI] [PMC free article] [PubMed] [Google Scholar]
- 35.Kuhn JP, Hernando D, Munoz del Rio A, et al. Effect of multipeak spectral modeling of fat for liver iron and fat quantification: correlation of biopsy with MR imaging results. Radiology. 2012;265:133–142. doi: 10.1148/radiol.12112520. [DOI] [PMC free article] [PubMed] [Google Scholar]
- 36.Krafft AJ, Loeffler RB, Song R, et al. Does fat suppression via chemically selective saturation affect R2*-MRI for transfusional iron overload assessment? A clinical evaluation at 1.5T and 3T. Magn Reson Med. 2016;76:591–601. doi: 10.1002/mrm.25868. [DOI] [PMC free article] [PubMed] [Google Scholar]
- 37.Dimov AV, Liu Z, Spincemaille P, Prince MR, Du J, Wang Y. Bone quantitative susceptibility mapping using a chemical species-specific R2* signal model with ultrashort and conventional echo data. Magn Reson Med. 2017 doi: 10.1002/mrm.26648. 10.1002/mrm.26648. [DOI] [PubMed] [Google Scholar]
- 38.Wisnieff C, Ramanan S, Olesik J, Gauthier S, Wang Y, Pitt D. Quantitative susceptibility mapping (QSM) of white matter multiple sclerosis lesions: Interpreting positive susceptibility and the presence of iron. Magn Reson Med. 2015;74:564–570. doi: 10.1002/mrm.25420. [DOI] [PMC free article] [PubMed] [Google Scholar]
- 39.Storey P, Thompson AA, Carqueville CL, Wood JC, de Freitas RA, Rigsby CK. R2* imaging of transfusional iron burden at 3T and comparison with 1.5T. J Magn Reson Imaging. 2007;25:540–547. doi: 10.1002/jmri.20816. [DOI] [PMC free article] [PubMed] [Google Scholar]
- 40.Alam MH, Auger D, McGill LA, et al. Comparison of 3 T and 1.5 T for T2* magnetic resonance of tissue iron. J Cardiovasc Magn Reson. 2016;18:40. doi: 10.1186/s12968-016-0259-9. [DOI] [PMC free article] [PubMed] [Google Scholar]


