Abstract
Diabetes mellitus is a serious health problem affecting the entire population all over the world for many decades. It is a group of metabolic disorder characterized by chronic disease which occurs due to high blood sugar, unhealthy foods, lack of physical activity and also hereditary. The sorts of diabetes mellitus are type1, type2 and gestational diabetes. The type1 appears during childhood and type2 diabetes develop at any age, mostly affects older than 40. The gestational diabetes occurs for pregnant women. According to the statistical report of WHO 79% of deaths occurred in people under the age of 60, due to diabetes. With a specific end goal to deal with the vast volume, speed, assortment, veracity and estimation of information a scalable environment is needed. Cloud computing is an interesting computing model suitable for accommodating huge volume of dynamic data. To overcome the data handling problems this work focused on Hadoop framework along with clustering technique. This work also predicts the occurrence of diabetes under various circumstances which is more useful for the human. This paper also compares the efficiency of two different clustering techniques suitable for the environment. The predicted result is used to diagnose which age group and gender are mostly affected by diabetes. Further some of the attributes such as hyper tension and work nature are also taken into consideration for analysis.
Keywords: Diabetes mellitus, Clustering techniques, Hadoop, Cloud computing, Dynamic data
Introduction
Cloud computing depends on the web. Where in the past individuals have downloaded applications or projects of programming on a physical PC or server in their building, distributed computing enables individuals to get to similar kinds of utilizations over the Internet. Utilizing a system of remote servers facilitated on the Internet to store, oversee and process information as opposed to a neighborhood server or a PC. Nowadays it’s a challenging task to process the large dataset which requires some effective techniques like data mining.
Data mining is about processing data and finds useful patterns to decide upon future trends from huge amount of data. We can mine information from different calculations and systems like characterization, grouping, Neural system, Regression, Association Rules, Artificial Intelligence, Decision Trees, Nearest Neighbour method, Genetic Algorithm, etc. [1]. Recently data mining techniques are employed practically in every field like marketing, Financial data analysis, E-business, Telecommunication Industry, Intrusion Detection, Retails, Medical Data Analysis, etc. [2].
Medical Data Analysis is new emerging research area where we can apply certain procedures to remove the data from the immense informational collection with the goal that a successful medicinal information examination should be possible. This paper focused on analysing diabetes data, because it is serious health problem that affects human being in worldwide. Certain review portrays that, there are 246 million diabetic individuals around the world, and this number is relied upon to ascend to 380 million by 2025 [3].
Diabetes is a metabolic issue described by unending ailment that happens either when the pancreas does not create enough insulin or when the body can’t adequately utilize the insulin it produces. Insulin is a peptide hormone that controls glucose. Hyperglycaemia, or high glucose, prompts genuine harm to a considerable lot of the body’s frameworks, particularly the nerves and veins. Learning and mindfulness about diabetes in India, especially in country zones, is poor. This underscores the requirement for leading vast scale diabetes mindfulness and training programs.
The expectation of diabetes from huge informational collection is one of the developing zones where information mining strategies are demonstrating victories in the on-going years. This paper focuses on issues in processing large dataset and also compares the hierarchical and K-means clustering technique to analyse diabetes data samples in “Clustering algorithm”. To process the large diabetic dataset the proposed system suggests cloud architecture with K-means MapReduce is discussed in “Architecture overview”. “Experimental results” depicts the results of the study. Where in “Conclusion” concludes the research.
Clustering algorithm
Hierarchical clustering algorithm
Hierarchical cluster analysis [4, 5] or HCA is to construct hierarchy of clusters using given data object. The hierarchical methods are categorized based on the development of classified decay.
There are two methodologies here:
Agglomerative method
Divisive method
Agglomerative method
This is a “bottom-up” approach [6, 7], it begins with one object and merges two or more clusters recursively. Every entity firstly signifies a cluster of that one individual. At that point the clusters are progressively converged until the point that the cluster structure is gotten [8]. The agglomerative clustering is too slow for large data set.
Divisive method
This is a “best down” approach [9], starts with all items in a similar cluster, and split up into littler cluster recursively. The objects in single cluster are divided into sub clusters and those clusters are additionally separated into their own sub clusters. This procedure proceeds until the point that the cluster arrangement is acquired.
The linkage metrics describes minimum, maximum and average distances between the clusters are also known as single-link, complete-link, and average line metrics, respectively. In hierarchy algorithms, based on linkage metrics we have quadratic time complexity (i.e.,) it requires where n is the number of data points and it is not handling non-spherical clusters well. Another drawback with linkage metrics is merging or splitting of clusters is irreversible which results in sub-optimal solutions.
There are two ways to deal with enhance the nature of classified clustering
Perform investigation of object linkages painstakingly at each various classified partitioning
Integrate both various classified agglomerative (group object into micro-cluster) and divisive (macro-cluster to micro-cluster) algorithm.
BIRCH algorithm
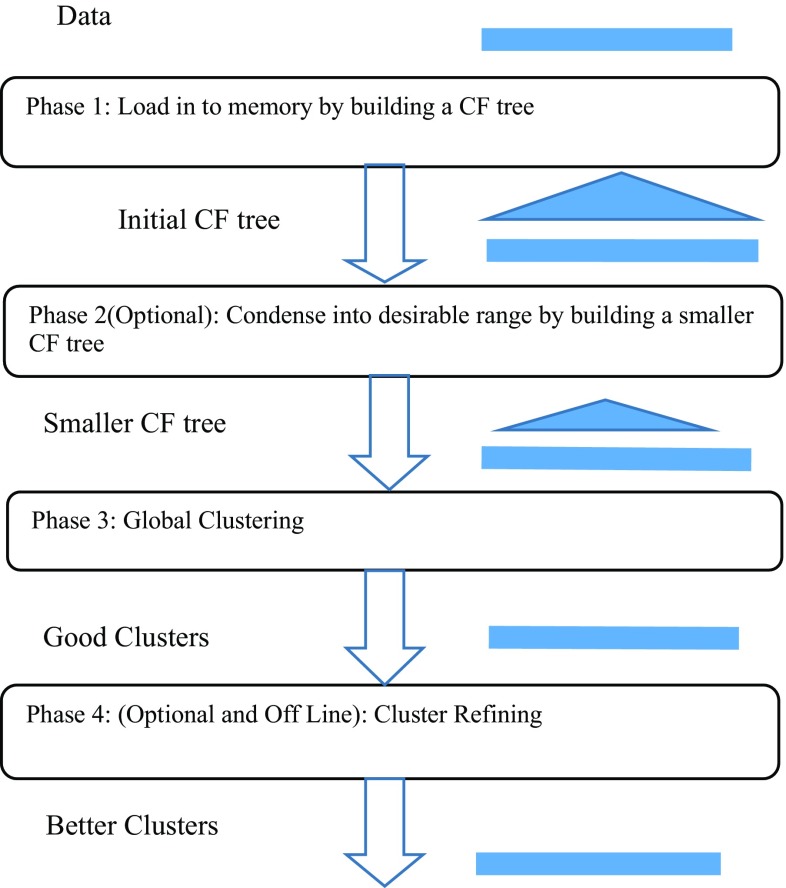
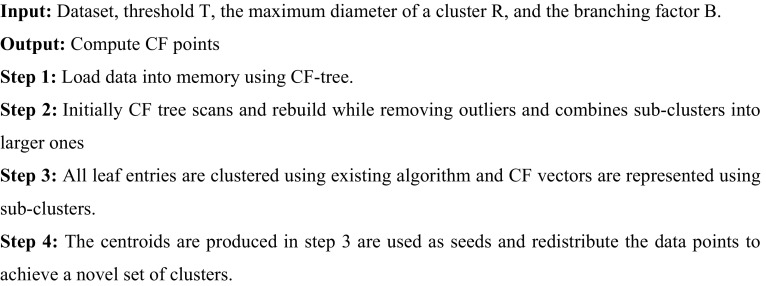
BIRCH (Balanced Iterative Reducing and Clustering using Hierarchies) is scalable for very large data set. There are four stages comprises of (1) Loading, (2) Optional Condensing, (3) Global Clustering, and (4) Optional Refining. In stage 1 the database is checked and manufactures an in-memory CF-tree (Clustering highlight tree) in view of memory and circle accessible. In stage 2, quick in light of the fact that no I/O activities are required and the first information is decreased. In stage 3, it is precise in light of the fact that anomalies are dispensed with and remaining information utilizes the accessible memory. In stage 4, fewer requests touchy in light of the fact that it contains the better information area contrasted and the subjective unique information is given in Fig. 1.
Fig. 1.
Phases of BIRCH algorithm
Pseudo code
BIRCH algorithm gives better accuracy results for finding outlier detection for large data sets [10].
Partition based clustering algorithm
Parceling grouping calculation [11] uses relocation system iteratively by moving them beginning with one bunch then onto the following, start from an underlying apportioning. Such strategies require that number of groups will be predestined by the customer. They are useful in numerous applications where each cluster speak to cluster center (model), and different occurrences in the cluster are like this model.
Assume a dataset of ‘n’ objects and ‘k’ partition of data or number of cluster. Every partition will characterise a cluster k ≤ n. It implies that it characterize the information into k gatherings, which fulfill the accompanying requirements: (i) Every set comprises minimum one entity. (ii) Every entity must fit into precisely one set [7].
Overall strategy of partitioning algorithm
To handle huge datasets, the below basic strategy is applied on small sample of the dataset and the result is used for clustering the entire dataset.
Partitioning cluster (Data D, int k)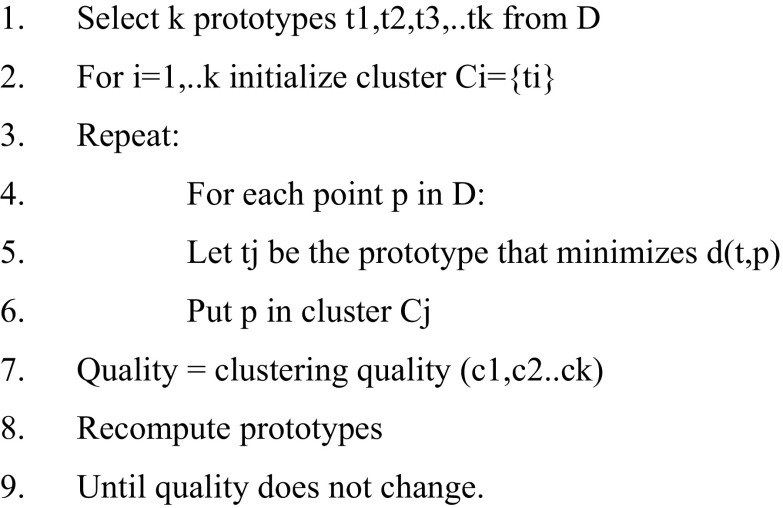
A partitioning algorithm starts by selecting k prototypes or representative data points for each cluster (lines 1, 2). The selection of prototypes is changed at each iteration that improves the overall clustering quality (line 8). Once the prototypes are selected, each data point is put in the cluster whose prototype it resembles the most (lines 4–6). In line 5, the function d represents the distance function used. These iterations continue until the clustering quality does not improve any further (lines 7, 9).
K-means algorithm
K-means is an unsupervised learning algorithm [12] which resolves well recognised clustering algorithm. This calculation objective is to limit a goal work, utilizing squared error work. The target work is
| 1 |
As shown in Eq. 1. where, is the distance measure among data point and cluster center .
Pseudo code
The algorithm is composed of the following steps: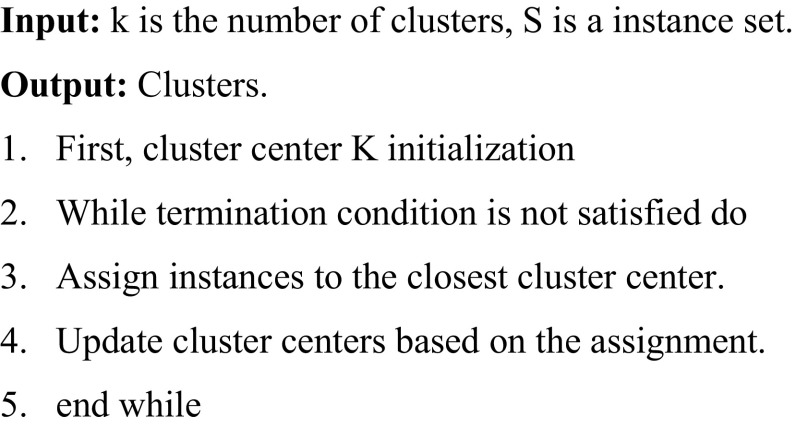
The most critical issues for k-implies grouping are that the bunching result relies upon instatement of the bunch focuses and their number. K-implies calculations are legitimate just for numerical information. Further, k-implies don’t focalize to worldwide least however join to a neighborhood least [13].
The comparative analysis of k-means and hierarchical clustering as shown in Table 1 illustrates that the number of records or data increases, the performance of hierarchical clustering goes slow. But the quality of hierarchical algorithm is good and its runtime becomes slow for small datasets. Hierarchical clustering will be slow because it has to make several merge/split decisions. As a general conclusion, k-means clustering is good for large data when comparing to hierarchical clustering and it is more efficient.
Table 1.
Comparative study of clustering algorithms
| S. no | Properties | K-means | Hierarchical cluster |
|---|---|---|---|
| 1 | Complexity | ||
| 2 | Handling high dimensionality | No | No |
| 3 | Handling Noisy data | No | No |
| 4 | Type of dataset | Numerical data | Numerical data |
| 5 | Large dataset handling | Yes | No |
| 6 | Performance | High | Less compared to k-means |
| 7 | Repeatability | May not repeatable and lack of consistency | Repeatable |
| 8 | Quality | Less compared to hierarchical cluster | High |
| 9 | Efficiency | More efficient | Less efficient |
| 10 | Number of cluster | Predefined | Not predefined |
Architecture overview
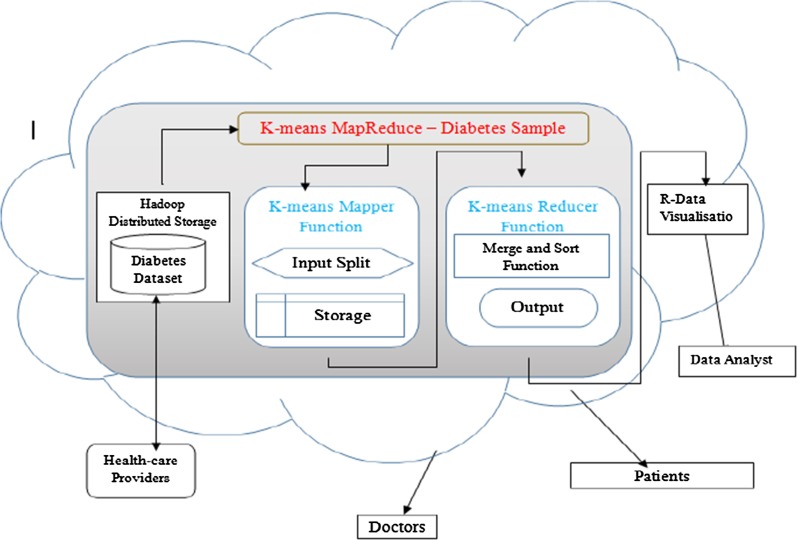
The proposed Cloud framework constitutes of three major phase for handling diabetes data as shown in Fig. 2. They are Distributed data storage using Hadoop (HDFS), MapReduce function and R-Data Visualisation. The HDFS is storage medium and it is FIFO Scheduling, which distributes very large data to k-means MapReduce function. In “Experimental results” both Hierarchical and K-means clustering technique are compared and it is found that k-means clustering algorithm is efficient to handle the large diabetic dataset. Hadoop-Map Reduce programming model was proposed in October, 2003 by the Google, is used in processing and generation of large data sets [14].
Fig. 2.
Cloud architecture
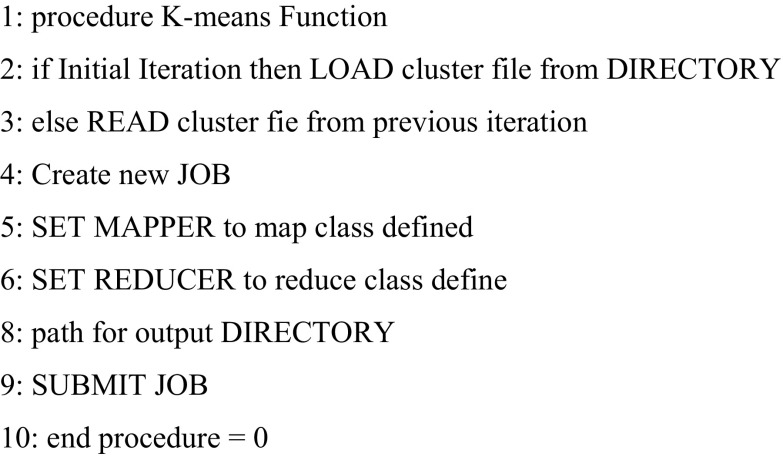
The k-means MapReduce function process the large diabetes dataset which include K-means Mapper function and Reducer function. In the proposed cloud framework the datasets are stored in HDFS. The hadoop is used dynamically in virtual infrastructure provided by the public or private cloud providers. The k-implies mapper work parts the vast information into pieces that are sustained to the hubs with the goal that the number and size of every datum square of information is subject to the quantity of hubs in the connection. The target of k-implies Mapper work is to utilize a (key, esteem) match for calculation. The acquired aftereffect of k-implies mapper work prompts the arrangement of various arrangement of information as (key, esteem) alluded as transitional dataset. At that point we make a k-implies Reducer work that joins the esteem components of the (key, esteem) combined middle of the road record with a similar halfway key. The following algorithm outlines K-means function.
Algorithm: implementation of K-means function
The R-Data visualisation takes the output from MapReduce function and gives a statistical report based on the analysis of diabetes large dataset by considering the age, gender and family history of a person. The percentage of diabetic risk is calculated for each age group with gender and make it visible to doctors, patients and data analyst.
Experimental results
In view of the writing, it is uncovered that a large portion of the diabetes influenced individuals are under the age gathering of 45–64 [15, 16]. As indicated by the report of World Health Organization (WHO) and International Diabetes Federation (IDF) gauges that the aggregate number of diabetic subjects to associate with 21 million individuals by 2012 and 69.9 million individuals by 2025 [17, 18]. In the proposed strategy the information tests were gathered for 2300 people and each subject incorporates age in years (min 20 and max 80), gender (male/female), family history (FH) of diabetes (affected/not influenced), body mass index (BMI) (min 14 and max 47), waist boundary in centimeter (waist) (min 45 and max 120), hip circumference (HC) (min 66 and max 125 cm), systolic blood pressure (SBP) (min 90 and max 220), diastolic blood pressure (DBP) (min 50 and max 120), fasting blood sugar (FBS) (min 55 and max 320 mg/dL), 2 h post glucose stack (2HPGL) (min 38 and max 570 mg/dL). A few samples are shown in Table 2.
Table 2.
Set 1-data set
| Age | Gender | FH | BMI | Waist | HC | SBP | DBP | FBS | 2HPGL |
|---|---|---|---|---|---|---|---|---|---|
| 30 | Male | Not affect | 27 | 50 | 80 | 150 | 70 | 250 | 320 |
| 30 | Female | Not affect | 35 | 60 | 102 | 166 | 90 | 70 | 150 |
| 20 | Male | Not affect | 28 | 93 | 96 | 96 | 154 | 150 | 220 |
| 50 | Male | Affect | 42 | 56 | 85 | 120 | 60 | 80 | 410 |
| 60 | Male | Affect | 37 | 94 | 107 | 190 | 69 | 220 | 360 |
| 40 | Female | Not affect | 32 | 115 | 94 | 143 | 62 | 140 | 50 |
| 40 | Male | Affect | 45 | 106 | 114 | 202 | 169 | 60 | 80 |
| 20 | Female | Not affect | 32 | 50 | 67 | 120 | 59 | 59 | 49 |
| 70 | Male | Affect | 43 | 49 | 69 | 150 | 109 | 230 | 530 |
| 50 | Female | Not affect | 16 | 65 | 100 | 201 | 73 | 67 | 106 |
| 80 | Male | Affect | 34 | 75 | 97 | 190 | 59 | 76 | 240 |
| 160 | Female | Not affect | 39 | 67 | 62 | 209 | 136 | 207 | 63 |
| 70 | Female | Not affect | 26 | 53 | 95 | 175 | 92 | 103 | 95 |
| 80 | Female | Not affect | 43 | 62 | 101 | 215 | 111 | 99 | 49 |
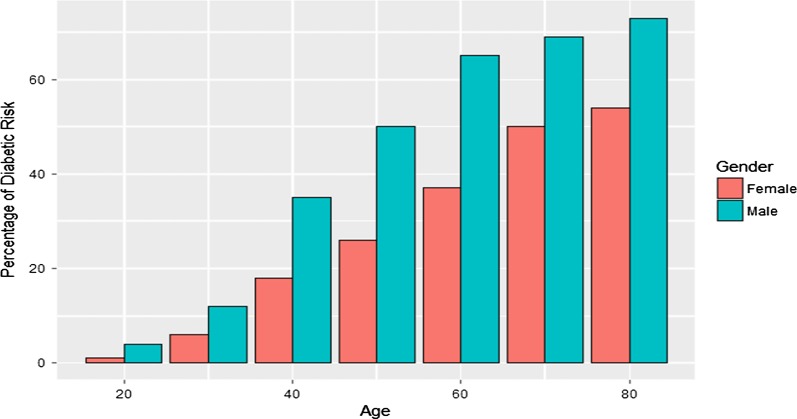
For the obtained data set, we have calculated that which age group are mostly affected by diabetes based on their family history and gender. The result shows that, age group under 45–64 are more diagnosed with diabetes. Then, we focused on identifying the gender which is frequently affected by diabetes. It is identified that women live longer than men, because of their lower rates of diabetes from family history and also we predicted the risk of diabetes for both male and female [16]. Figure 3 shows that who is habitually affected by diabetes due to poor lifestyle habits
Fig. 3.
Set 1 risk factor result
Risk factor of diabetic percentage was 65% in the year of 2010 at age of 60. Through this work we predicted that 49% of people will be affected by 2050 in under the age of 20 because of poor lifestyle habits.
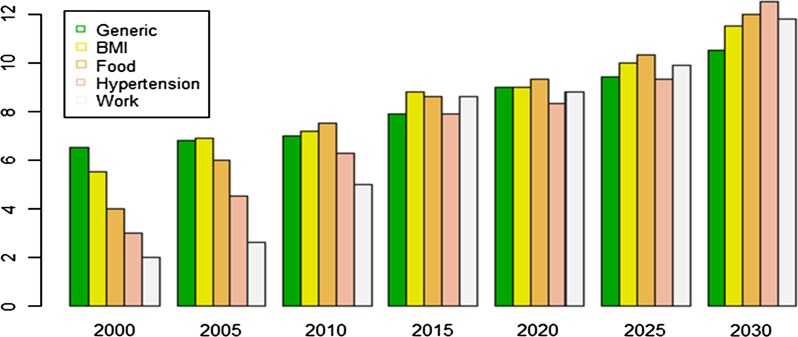
From the recent research it is also identified that the ratio of diabetic affected person increases because of hypertension and work nature. This work focused on those attributes also for analysis of diabetic as depicted in Table 3.
Table 3.
Set 2-data set
| Year | Generic | BMI | Food | Hypertension | Work |
|---|---|---|---|---|---|
| 2000 | 6.5 | 5.5 | 4 | 3 | 2 |
| 2005 | 6.8 | 6.9 | 6 | 4.5 | 2.6 |
| 2010 | 7 | 7.2 | 7.5 | 6.3 | 5 |
| 2015 | 7.9 | 8.8 | 8.6 | 7.9 | 8.6 |
| 2020 | 9 | 9 | 9.3 | 8.3 | 8.8 |
| 2025 | 9.4 | 10 | 10.3 | 9.3 | 9.9 |
| 2030 | 10.5 | 11.5 | 12 | 12.5 | 11.8 |
From Fig.4 it is clearly depicted that the ratio of diabetic increases from 2010 onwards. It is not only based on generic or habitualization but also hypertension and nature of work plays a vital role in affecting the health of human.
Fig. 4.
Set 2 risk factor result
Conclusion
In this work, we have compared both k-means and hierarchical clustering algorithm based on performance, run-time and quality. From this analysis, k-means clustering algorithm is good for handling large data set in cloud computing platform and it is more efficient when comparing to hierarchical clustering algorithm. We mainly analysed the diabetes dataset using hadoop framework by considering the attributes such as age, gender and family history. The result found that, the age group under 45–64 are more diagnosed with diabetes. Furthermore, we also predicted that hypertension and work nature plays a vital role in affecting the entire population.
Footnotes
Publisher's Note
Springer Nature remains neutral with regard to jurisdictional claims in published maps and institutional affiliations.
References
- 1.Barakat NH, Bradley AP, Barakat NBH. Intelligible support vector machines for diagnosis of diabetes mellitus. IEEE Trans Inf Technol BioMed. 2010;14(4):1114–1120. doi: 10.1109/TITB.2009.2039485. [DOI] [PubMed] [Google Scholar]
- 2.Shivakumar BL, Alby S. A survey on data-mining technologies for prediction and diagnosis of diabetes. In: International conference on intelligent computing applications, 978-1-4799-3966-4/14. 2014.
- 3.Ayed AB, Halima MB, Alimi AM. Survey on clustering methods: towards fuzzy clustering for big data. In: International conference of soft computing and pattern recognition, 978-1-4799-5934-1/14. 2014.
- 4.Han J, Kamber M, Pei J. Data mining: concepts and techniques. Waltham: Elsevier; 2011. [Google Scholar]
- 5.Sivanandini LD, Raj MM. A survey on data clustering algorithms based on fuzzy techniques. Int J Sci Res. 2013;2(4):246–251. [Google Scholar]
- 6.Fahad A, Alshatri N, Tari Z, Alamri A, Khalil I, Zomaya AY, Foufou S, Bouras A. Survey of clustering algorithms for big data: taxonomy and empirical analysis. IEEE Trans Emerg Top Comput. 2014;2(3):267–279. doi: 10.1109/TETC.2014.2330519. [DOI] [Google Scholar]
- 7.Dharmarajan A, Velmurugan T. Applications of partition based clustering algorithms: a survey. In: International conference on computational intelligence and computing research. 2013.
- 8.Kazi A, Kurian DT. A survey of data clustering techniques. Int J Eng Res Technol. 2014;3(4).
- 9.Zhang T, Ramakrishnan R, Livny M. BIRCH: an efficient data clustering method for very large databases. In: Proceedings of the 1996 ACM SIGMOD international conference on management of data, pp. 73–84, June 01–04, 1998, Seattle, WA.
- 10.Vidhya K, Shanmugalakshmi R. Cloud based framework to handle and analyze diabetes data C. Int J Innov Sci Res. 2016;22(2):401–407. [Google Scholar]
- 11.Patil YS, Vaidya MB. K-means clustering with MapReduce technique. Int J Adv Res Comput Commun Eng. 2015;4(11).
- 12.Al-Ayyoub M, AlZu’bi S, Jararweh Y, Shehab MA, Gupta BB. Accelerating 3D medical volume segmentation using GPUs. Multimed Tools Appl. 2018;77(4):4939–4958. doi: 10.1007/s11042-016-4218-0. [DOI] [Google Scholar]
- 13.Mohan V, Sandeep S, Deepa R, Shah B, Varghese C. Epidemiology of type 2 diabetes: Indian scenario. Indian J Med Res. 2007;125:217–230. [PubMed] [Google Scholar]
- 14.Rashno A, Koozekanani DD, Drayna PM, Nazari B, Sadri S, Rabbani H, Parhi KK. Fully automated segmentation of fluid/cyst regions in optical coherence tomography images with diabetic macular edema using neutrosophic sets and graph algorithms. IEEE Trans Biomed Eng. 2018;65(5):989–1001. doi: 10.1109/TBME.2017.2734058. [DOI] [PubMed] [Google Scholar]
- 15.Barik Rabindra Kumar, Priyadarshini R., Dubey Harishchandra, Kumar Vinay, Yadav S. Advances in Data and Information Sciences. Singapore: Springer Singapore; 2018. Leveraging Machine Learning in Mist Computing Telemonitoring System for Diabetes Prediction; pp. 95–104. [Google Scholar]
- 16.Abawajy JH, Hassan MM. Federated internet of things and cloud computing pervasive patient health monitoring system. IEEE Commun Mag. 2017;55(1):48–53. doi: 10.1109/MCOM.2017.1600374CM. [DOI] [Google Scholar]
- 17.Chen Z, Xu G, Mahalingam V, Ge L, Nguyen J, Yu W, Lu C. A cloud computing based network monitoring and threat detection system for critical infrastructures. Big Data Res. 2016;3:10–23. doi: 10.1016/j.bdr.2015.11.002. [DOI] [Google Scholar]
- 18.La HJ. A conceptual framework for trajectory-based medical analytics with IoT contexts. J Comput Syst Sci. 2016;82(4):610–626. doi: 10.1016/j.jcss.2015.10.007. [DOI] [Google Scholar]


