Abstract
Ozone is a strong oxidant, highly unstable atmospheric gas. Its medical use at low concentrations has been progressively increasing as an alternative/adjuvant treatment for several diseases. In this study, we investigated the effects of mild ozonisation on human adipose-derived adult stem (hADAS) cells i.e., mesenchymal stem cells occurring in the stromal-vascular fraction of the fat tissue and involved in the tissue regeneration processes. hADAS cells were induced to differentiate into the adipoblastic lineage, and the effect of low ozone concentrations on the adipogenic process was studied by combining histochemical, morphometric and ultrastructural analyses. Our results demonstrate that ozone treatment promotes lipid accumulation in hADAS cells without inducing deleterious effects, thus paving the way to future studies aimed at elucidating the effect of mild ozonisation on adipose tissue for tissue regeneration and engineering.
Key words: Ozone, stem cells, adipogenesis, microscopy
Introduction
Ozone (O3) is a naturally occurring atmospheric gas composed of three oxygen atoms; it is highly unstable (rapidly decomposing to normal oxygen, O2) and is a strong oxidant.
The therapeutic potential of O3 is known since the end of the 18th century but its medical application has been limited for a long time due to the doubts about its possible toxicity. However, in the last two decades the medical use of O3 has been progressively increasing all over the world as an alternative/adjuvant treatment for several diseases.1-3 Some mechanistic evidence has recently been provided for the dose-dependent effects of O3 treatment.4-6 In particular, it has been demonstrated that low O3 concentrations, by inducing the so-called eustress,7 do activate cell anti-oxidative response pathways8 which are likely responsible for the therapeutic effects observed in the clinical practice.
However, the potential of mild ozonisation in tissue regeneration and differentiation has been scarcely explored so far. In this view, we investigated the effects of low O3 concentrations on human adiposederived adult stem (hADAS) cells i.e., the mesenchymal stem cells which are present in the stromal-vascular fraction of the fat tissue. hADAS cells are able to differentiate in vitro into meso-, ecto- and endodermal cell lineages and can also be reprogrammed as pluripotent stem cells more efficiently than other cell types.9 hADAS cells are therefore considered as a powerful tool in regenerative medicine and tissue engineering. 9-13 In this study, we induced hADAS cells to differentiate into the adipoblastic lineage, and investigated the effect of mild ozonisation on the adipogenic process; histochemical and morphometric analyses at light microscopy were combined with ultrastructural morphology at transmission electron microscopy (TEM).
Materials and Methods
Technical details of cell culture, gas treatment, cell processing for light microscopy and TEM, and morphometric analysis are reported in the Supplementary Material.
Briefly, hADAS cells were isolated from subcutaneous adipose tissue harvested by liposuction and grown in either adipogenic or non adipogenic medium. These cells were exposed to 5, 10 or 20 μg O3/mL O2 at early (6 days), intermediate (16 days) and late (20 days) differentiation steps, and the effects were evaluated 2 h and 24 h after gas exposure.
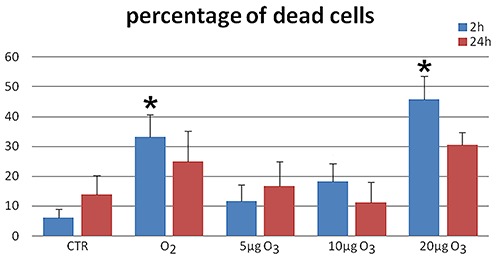
After 6 days in differentiation medium, cell viability was estimated by the Trypanblue exclusion test 2 h and 24 h after gas treatment. Since 20 μg O3/mL was found to significantly increase cell death (Figure 1), this concentration was excluded from further analyses.
Figure 1.

Mean values ± SE of dead cell percentage in the different samples 2 h (blue columns) and 24 h (red columns) after treatment. Asterisks indicate values significantly different from control at the same time point.
Oil Red O staining was used to visualize lipid droplets (LDs) at light microscopy. Two h and 24 h after gas treatment, randomly selected cells grown in either adipogenic or non-adipogenic medium were measured to evaluate the percentage of cytoplasmic area covered by LDs, mean LD areas, and LD size distribution. Twenty-four h after treatment, hADAS cells were processed for conventional TEM.
Results and Discussions
Low O3 concentrations do not affect hADAS cells viability
Two h after gas exposure, cell death rate significantly raised in samples treated with O2 or 20 μg O3/mL in comparison to the untreated control (Figure 1): this suggests that excessive concentrations of O3 as well as pure O2 induce the formation of high levels of reactive oxygen species (ROS), which cause cell damage by oxidation and nitration of DNA, RNA, protein and lipids.14 Conversely, exposure to 5 or 10 μg O3/mL proved to be safe for hADAS cells at both short and long term post treatment. Regulated ROS levels are known to promote essential signalling pathways involved in cell proliferation, survival and differentiation in mesenchymal stem cells;14 it is therefore likely that 5 and 10 μg O3/mL are safe concentrations for hADAS cells, able to activate positive anti-stress cell response involving e.g. Nrf2, HSP70, mtHSP70,15,16 similarly to other cell types submitted to mild ozonisation.5-8
Low O3 concentrations induce adipogenesis in hADAS cells in adipogenic medium
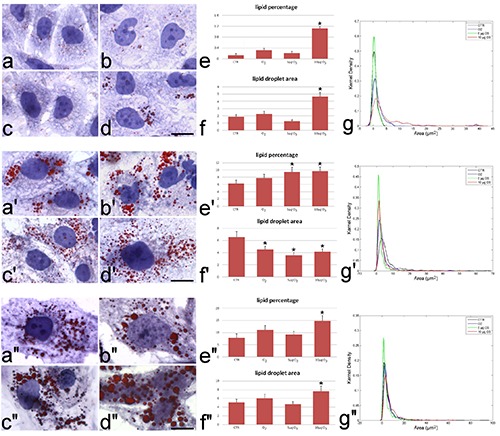
The effects of 5 and 10 μg O3/mL treatment in hADAS cells grown in adipogenic medium are shown in Figure 2. These results refer to 24 h post treatment, since no change was observed after 2 h (not shown).
Figure 2.

Brightfield micrographs of hADAS cells grown in adipogenic medium. Control (a, a’, a’’), O2-treated (b, b’, b’’), 5 μg O3-treated (c, c’, c’’) and 10 μg O3-treated (d, d’, d’’) hADAS cells at day 6 (a-d), 16 (a’-d’) and 20 (a’’-d’’). LDs were stained with Oil Red O and the cell was counterstained with haematoxylin. Note the progressive accumulation of LDs during the differentiation process. Scale bars: 20 μm. Mean values ± SE of percentage of cytoplasmic area covered by LDs (e-e’’) and of LD area (f-f ’’) at 24 h post-treatment. Asterisks indicate values significantly different from control. Kernel distribution of LD area (g-g’’).
At early stage of differentiation (6 days), hADAS cells contained few small LDs (Figure 2a-d), although cells exposed to 10 μg O3/mL showed more numerous LDs than the other samples (Figure 2d). Morphometric evaluation confirmed that 10 μg O3/mL-treated cells showed both mean LD area and lipid percentage values higher than the controls (Figure 2f, g), together with numerous large LDs (Figure 2e). At the intermediate stage of differentiation (16 days), hADAS cells contained numerous LDs (Figure 2a’-d’). Morphometric evaluation demonstrated a decreased mean LD area in cells treated with O2, 5 μg O3/mL or 10 μg O3/mL (Figure 2f’); in addition, cells treated with 5 or 10 μg O3/mL showed an increase in lipid percentage (Figure 2g’). Accordingly, numerous LDs of small size are present in these samples (Figure 2e’). At late differentiation (20 days) stage, hADAS cells contained a large number of LDs in all samples (Figure 2 a’’-d’’); however, treatment with 10 μg O3/mL significantly increased both LD area (Figure 2f’’) and lipid percentage (Figure 2g’’), consistently with the presence of the highest number of large LDs (Figure 2e’’).
LDs are depot of neutral lipids which represent an energy source as well as a substrate for the synthesis of several molecules. Generally, LD formation occurs by steps: first scattered small droplets form in the cytoplasm, then LDs increase in size and finally aggregate into clusters.17 In white adipocytes, increase in LD size may occur by either addition of neutral lipids to preexisting droplets18,19 or LDs fusion.20,21
An adipogenic effect of mild ozonisation (especially for 10 μg O3/mL) on differentiating pre-adipocytes is demonstrated by our data. This effect varies in relation to the differentiation phase: at early and late stages O3 seems to stimulate lipid addition to LDs and/or LD fusion (as suggested by the increased mean area of LDs) whereas at the intermediate differentiation step O3 would also stimulate the formation of new LDs (as suggested by the significantly decreased mean area). At this stage, LD size was also affected by O2; however, the total lipid content did not increase, thus excluding an O2-induced adipogenic effect. It has been reported that appropriate ROS levels are essential for adipogenic differentiation of mesenchymal stem cells.14,22 Moreover, Nrf2 has been demonstrated to play a key role in human mesenchymal stem cell differentiation23,24 together with Heme Oxygenase-1;25 consistently, mild ozonisation activates an antioxidant cell response through Nrf2 pathway8 and Heme Oxygenase-1 modulation.6 It is noteworthy that no LD fission or decrease of the cell lipid content26,27 was observed even short time post-treatment (not shown): since lipolysis may be caused in adipocytes by different stress conditions,28-30 its absence further supports the safety of the low O3 concentrations.
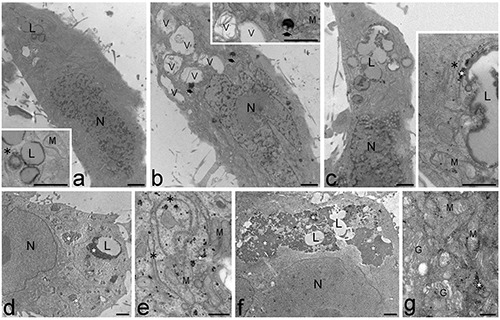
This was also confirmed by the ultrastructural analysis. At 6 days (Figure 3a-c), hADAS cells of all samples were characterized by elongated shapes and one nucleus containing scattered heterochromatin clumps; in the cytoplasm mitochondria were numerous, rough and smooth endoplasmic reticulum and Golgi complex were well developed, while LDs and glycogen were quite scarce. At this differentiation step, in cells treated with 10 μg O3/mL LDs were frequently found to fuse (Figure 3c), according to the significant increase of the mean LD size. At both 16 and 20 days (Figure 3 d-g), hADAS cells showed roundish shapes and one mostly euchromatic nucleus; in the cytoplasm mitochondria were numerous, rough and smooth endoplasmic reticulum were well developed, Golgi complexes were numerous with many cisternae and vesicles, LDs and glycogen were abundant, especially in cells treated with 10 μg/mL (Figure 3f). Low O3 concentrations would therefore promote not only lipid but also glycogen accumulation. Taken together, TEM observations revealed that O3 treatment did not hamper the differentiation process of hADAS cell from elongated, fibroblast-like cells with heterochromatic nuclei (i.e., containing only partially transcribing DNA), to roundish adipocyte-like cells with euchromatic (i.e., actively transcribing) nuclei and large amounts of lipid and glycogen in the cytoplasm. Moreover, no alteration of the cell organelles occurred in samples treated with low O3 concentrations at any differentiation step, according to previous ultrastructural observations on other cell types.5-8
Figure 3.

Transmission electron micrographs of hADAS cells. a-c) Control (a), O2 treated (b) and O3 10 μg/mL treated (c) cells at early differentiation stage (6 days). The cells are elongated in shape and show nuclei (N) with numerous heterochromatin clumps; in the cytoplasm mitochondria (M) and endoplasmic reticulum (asterisks) are well developed, even after gas exposure while glycogen (star) is scarce. Note the cytoplasmic vacuolization (V) and the residual bodies (arrows) in b, and the merging LDs (L) in c. d-g) Control (d,e), and O3 10 μg/mL treated (f,g) cells at late differentiation stage (20 days). The roundish cells contain one mostly euchromatic nucleus (N) and numerous mitochondria (M) and Golgi complexes (G); LDs (L) and glycogen (stars) are abundantly distributed in the cytoplasm. Note the large amount of glycogen in f. Scale bars: a-d, f ) 2 μm; e,g) 500 nm.
Notably, cells treated with O2 showed an evident vacuolization of the cytoplasm and an accumulation of residual bodies at each differentiation step, although no structural damage of cell organelles was observed, suggesting that treatment with pure O2 induces cell stress, consistently with the observed increase in cell death rate (Figure 1).
Low O3 concentrations do not affect adipogenesis in the absence of adipogenic factors
When hADAS cells were grown in medium devoid of adipogenic factors, most of the cells maintained fibroblast-like morphology (not shown), and only a few clones accumulated LDs. Morphometric evaluation of lipid content was therefore performed exclusively in these cells.
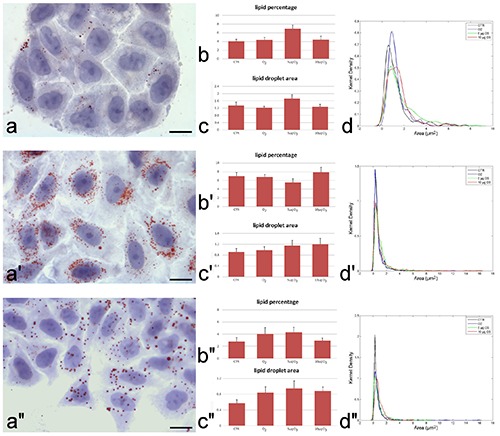
Under this culture condition, no effect was observed for any gas treatment both at short (not shown) and long (Figure 4) time. In detail, at 6 days, the cells showed only few small LDs (Figure 4a), with no significant difference in the mean LD area or lipid percentage (Figure 4 b,c), while the Kernel density distribution showed a trend towards larger LD size in O3 treated cells. At 16 and 20 days, some LDs accumulated in the cytoplasm (Figure 4a’), but no significant difference in LD area, lipid percentage or Kernel density among samples was found (Figure 4 b’-d’, b’’-d’’). Interestingly, the amount of lipid content at 20 days was generally lower than at 16 days, demonstrating a hampered pre-adipocyte differentiation in the absence of adipogenic factors. ROS are known to promote adipogenesis via insulin-mediated signal transduction31 and it is likely that the absence of insulin in the medium may prevent the adipogenic effect of low O3 concentrations.
Figure 4.

Representative brightfield micrographs of hADAS cells grown in DMEM at day 6 (a), 16 (a’) and 20 (a’’). LDs were stained with Oil Red O and the cell was counterstained with haematoxylin. Note the increase of LDs at day 16 (a’) and the decrease at day 20. Scale bars: 20 μm. Mean values±SE of percentage of cytoplasmic area occupied by LDs (b-b’’) and of LD area (c-c’’) at 24 h post-treatment. No significant difference was found. Kernel distribution of LD area (d-d’’).
In conclusion, our results demonstrate that low O3 concentrations are able to stimulate lipid accumulation during adipogenic differentiation of hADAS cells without altering cell differentiation process, ultrastructural cytoarchitecture or lipid storage. In particular, lipids play a key role as signaling factors in the regulation of metabolism as well as in cell response (protection and reparation) to damaging stimuli, thus representing a powerful marker of cell function.32-34 hADAS cells are a suitable in vitro model to explore the effect of mild ozonisation on the regeneration processes since these stem cells are involved in reconstructing the connective matrix and promoting angiogenesis, while supporting epithelial, muscle and even nerve regeneration in vivo.9 Based on the present preliminary findings, future studies in vitro and in vivo will elucidate the effect of mild ozonisation on human adipose tissue, in the attempt to design targeted protocols of ozone treatment for adipose stem cell-based tissue regeneration and engineering.
Acknowledgments
This work was supported by the University of Verona (Joint Projects 2017). F.C. is a PhD student in receipt of a fellowship from the Doctoral Program “Nanoscience and Advanced Technologies” of the University of Verona.
References
- 1.Re L, Mawsouf MN, Menéndez S, León OS, Sánchez GM, Hernández F. Ozone therapy: clinical and basic evidence of its therapeutic potential. Arch Med Res 2008;39:17-26. [DOI] [PubMed] [Google Scholar]
- 2.Elvis AM, Ekta JS. Ozone therapy: A clinical review. J Nat Sc Biol Med 2011;2:66-70. [DOI] [PMC free article] [PubMed] [Google Scholar]
- 3.Bocci V. How a calculated oxidative stress can yield multiple therapeutic effects. Free Radic Res 2012;46:1068-75. [DOI] [PubMed] [Google Scholar]
- 4.Sagai M, Bocci V. Mechanisms of action involved in ozone therapy: is healing induced via a mild oxidative stress? Med Gas Res 2011;1:29. [DOI] [PMC free article] [PubMed] [Google Scholar]
- 5.Costanzo M, Cisterna B, Vella A, Cestari T, Covi V, Tabaracci G, et al. Low ozone concentrations stimulate cytoskeletal organization, mitochondrial activity and nuclear transcription. Eur J Histochem 2015;59:2515. [DOI] [PMC free article] [PubMed] [Google Scholar]
- 6.Scassellati C, Costanzo M, Cisterna B, Nodari A, Galiè M, Cattaneo A, et al. Effects of mild ozonisation on gene expression and nuclear domains organization in vitro. Toxicol in Vitro 2017;44:100-10. [DOI] [PubMed] [Google Scholar]
- 7.Niki E. Oxidative stress and antioxidants: Distress or eustress? Arch Biochem Biophys 2016; 595:19-24. [DOI] [PubMed] [Google Scholar]
- 8.Galiè M, Costanzo M, Nodari A, Boschi F, Calderan L, Mannucci S, et al. Mild ozonisation activates antioxidant cell response by the Keap1/Nrf2 dependent pathway. Free Radic Biol Med 2018; 124:114-21. [DOI] [PubMed] [Google Scholar]
- 9.Ong WK, Sugii S. Adipose-derived stem cells: fatty potentials for therapy. Int J Biochem Cell Biol 2013;45:1083-6. [DOI] [PubMed] [Google Scholar]
- 10.Rigotti G, Marchi A, Galiè M, Baroni G, Benati D, Krampera M, et al. Clinical treatment of radiotherapy tissue damage by lipoaspirate transplant: a healing process mediated by adiposederived adult stem cells. Plast Reconstr Surg 2007;119:1409-22. [DOI] [PubMed] [Google Scholar]
- 11.Rigotti G, Marchi A, Sbarbati A. Adipose-derived mesenchymal stem cells: past, present, and future. Aesthetic Plast Surg 2009;33:271-3. [DOI] [PubMed] [Google Scholar]
- 12.Salibian AA, Widgerow AD, Abrouk M, Evans GR. Stem cells in plastic surgery: a review of current clinical and translational applications. Arch Plast Surg 2013;40:666-75. [DOI] [PMC free article] [PubMed] [Google Scholar]
- 13.Tsuji W, Rubin JP, Marra KG. Adiposederived stem cells: Implications in tissue regeneration. World J Stem Cells 2014;6:312-21. [DOI] [PMC free article] [PubMed] [Google Scholar]
- 14.Atashi F, Modarressi A, Pepper MS. The role of reactive oxygen species in mesenchymal stem cell adipogenic and osteogenic differentiation: a review. Stem Cells Dev 2015;24:1150-63. [DOI] [PMC free article] [PubMed] [Google Scholar]
- 15.Wadhwa R, Taira K, Kaul SC. An Hsp70 family chaperone, mortalin/ mthsp70/PBP74/Grp75: what, when, and where? Cell Stress Chaperones 2002;7:309-16. [DOI] [PMC free article] [PubMed] [Google Scholar]
- 16.Flachbartová Z, Kovacech B. Mortalin - a multipotent chaperone regulating cellular processes ranging from viral infection to neurodegeneration. Acta Virol 2013;57:3-15. [DOI] [PubMed] [Google Scholar]
- 17.Guo Y, Walther TC, Rao M, Stuurman N, Goshima G, Terayama K, et al. Functional genomic screen reveals genes involved in lipid droplet formation and utilization. Nature 2008;453:657-61. [DOI] [PMC free article] [PubMed] [Google Scholar]
- 18.Kellner-Weibel G, McHendry-Rinde B, Haynes MP, Adelman S. Evidence that newly synthesized esterified cholesterol is deposited in existing cytoplasmic lipid inclusions. J Lipid Res 2001;42: 768-77. [PubMed] [Google Scholar]
- 19.Kuerschner L, Moessinger C, Thiele C. Imaging of lipid biosynthesis: how a neutral lipid enters lipid droplets. Traffic 2008;9:338-52. [DOI] [PubMed] [Google Scholar]
- 20.Boström P, Rutberg M, Ericsson J, Holmdahl P, Andersson L, Frohman MA, et al. Cytosolic lipid droplets increase in size by microtubule-dependent complex formation. Arterioscler Thromb Vasc Biol 2005;25:1945-51. [DOI] [PubMed] [Google Scholar]
- 21.Murphy S, Martin S, Parton RG. Lipid droplet-organelle interactions; sharing the fats. Biochim Biophys Acta 2009;1791:441-7. [DOI] [PubMed] [Google Scholar]
- 22.Higuchi M, Dusting GJ, Peshavariya H, Jiang F, Hsiao ST, Chan EC, et al. Differentiation of human adiposederived stem cells into fat involves reactive oxygen species and Forkhead box O1 mediated upregulation of antioxidant enzymes. Stem Cells Dev 2013;22:878-88. [DOI] [PMC free article] [PubMed] [Google Scholar]
- 23.Pi J, Leung L, Xue P, Wang W, Hou Y, Liu D, et al. Deficiency in the nuclear factor E2-related factor-2 transcription factor results in impaired adipogenesis and protects against diet-induced obesity. J Biol Chem 2010;285(12):9292-300. [DOI] [PMC free article] [PubMed] [Google Scholar]
- 24.Hou Y, Xue P, Bai Y, Liu D, Woods CG, Yarborough K, et al. Nuclear factor erythroid- derived factor 2-related factor 2 regulates transcription of CCAAT /enhancer-binding protein β during adipogenesis. Free Radic Biol Med 2012;52:462-72. [DOI] [PMC free article] [PubMed] [Google Scholar]
- 25.Vanella L, Sanford C, Kim DH, Abraham NG, Ebraheim N. Oxidative stress and heme oxygenase-1 regulated human mesenchymal stem cells differentiation. Int J Hypertens 2012;2012: 890671. [DOI] [PMC free article] [PubMed] [Google Scholar]
- 26.Rizzatti V, Boschi F, Pedrotti M, Zoico E, Sbarbati A, Zamboni M. Lipid droplets characterization in adipocyte differentiated 3T3-L1 cells: size and optical density distribution. Eur J Histochem 2013;57:e24. [DOI] [PMC free article] [PubMed] [Google Scholar]
- 27.Boschi F, Rizzatti V, Zamboni M, Sbarbati A. Models of lipid droplets growth and fission in adipocyte cells. Exp Cell Res 2015;336:253-62. [DOI] [PubMed] [Google Scholar]
- 28.Deng J, Liu S, Zou L, Xu C, Geng B, Xu G. Lipolysis response to endoplasmic reticulum stress in adipose cells. J Biol Chem 2012;287:6240-9. [DOI] [PMC free article] [PubMed] [Google Scholar]
- 29.Conti G, Benati D, Bernardi P, Jurga M, Rigotti G, Sbarbati A. The postadipocytic phase of the adipose cell cycle. Tissue Cell 2014;46:520-6. [DOI] [PubMed] [Google Scholar]
- 30.Marinozzi MR, Pandolfi L, Malatesta M, Colombo M, Collico V, Lievens PM, et al. Innovative approach to safely induce controlled lipolysis by superparamagnetic iron oxide nanoparticlesmediated hyperthermic treatment. Int J Biochem Cell Biol 2017;93:62-73. [DOI] [PubMed] [Google Scholar]
- 31.Zhang Z, Zhou S, Jiang X, Wang YH, Li F, Wang YG, et al. The role of the Nrf2/Keap1 pathway in obesity and metabolic syndrome. Rev Endocr Metab Disord 2015;16:35-45. [DOI] [PubMed] [Google Scholar]
- 32.Wymann MP, Schneiter R. Lipid signalling in disease. Nat Rev Mol Cell Biol 2008;9:162-76. [DOI] [PubMed] [Google Scholar]
- 33.Carroll B, Donaldson JC, Obeid L. Sphingolipids in the DNA damage response. Adv Biol Regul 2015;58:38-52. [DOI] [PMC free article] [PubMed] [Google Scholar]
- 34.Croce AC, Bottiroli G. Lipids: Evergreen autofluorescent biomarkers for the liver functional profiling. Eur J Histochem 2017;61:2808. [DOI] [PMC free article] [PubMed] [Google Scholar]


