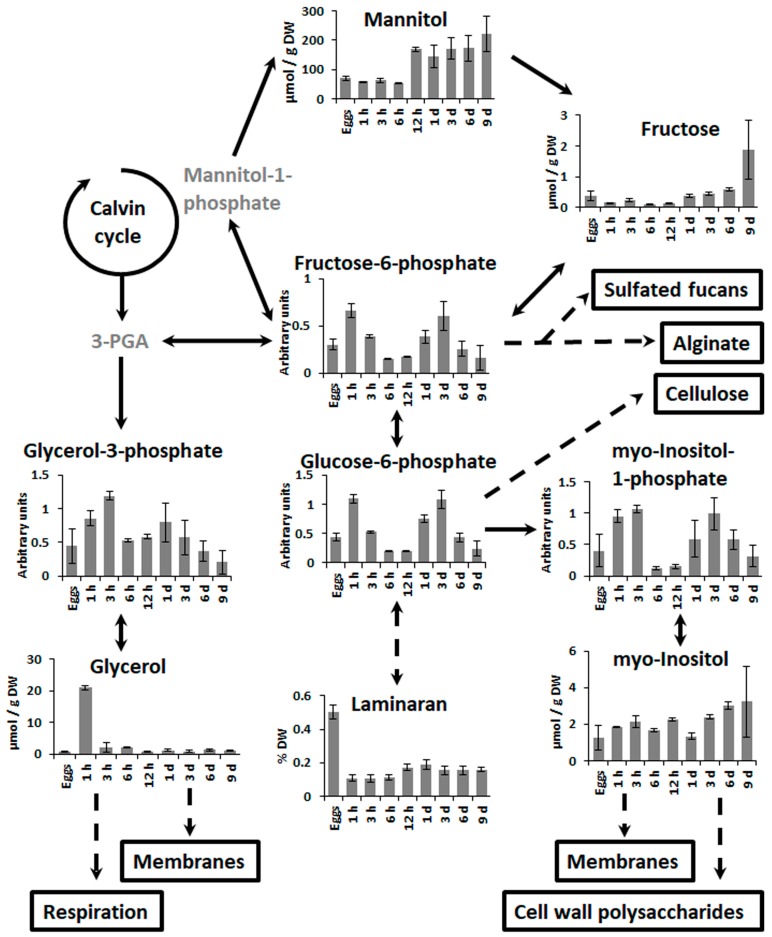
Figure 4.
Scheme of the central carbon metabolism in brown algae. Direct reactions are presented as straight lines and reactions involving several steps are presented as dashed lines. Metabolites which were not determined are labeled in grey. Bars represent the means ± SD (standard deviation). Arbitrary units are normalized peak areas.

