 Lipophilicity prediction is routinely applied to small molecules. For compounds outside the domain of classical medicinal chemistry these predictions lack accuracy, advocating the development of bespoke in silico approaches.
Abstract
Lipophilicity prediction is routinely applied to small molecules and presents a working alternative to experimental log P or log D determination. For compounds outside the domain of classical medicinal chemistry these predictions lack accuracy, advocating the development of bespoke in silico approaches. Peptides and their derivatives and mimetics fill the structural gap between small synthetic drugs and genetically engineered macromolecules. Here, we present a data-driven machine learning method for peptide log D7.4 prediction. A model for estimating the lipophilicity of short linear peptides consisting of natural amino acids was developed. In a prospective test, we obtained accurate predictions for a set of newly synthesized linear tri- to hexapeptides. Further model development focused on more complex peptide mimetics from the AstraZeneca compound collection. The results obtained demonstrate the applicability of the new prediction model to peptides and peptide derivatives in a log D7.4 range of approximately –3 to 5, with superior accuracy to established lipophilicity models for small molecules.
Introduction
In silico predictions of physicochemical compound properties support all stages of drug discovery and development. The lipophilicity concept is particularly useful for compound library profiling, and to monitor and understand changes in a compound's pharmacokinetic profile, selectivity, permeability and bioavailability.1,2 Consequently, a plethora of experimental lipophilicity data and computational approaches exist, usually designed for small molecules.3
Peptides and peptide mimetics have a long tradition as pharmaceutically active agents. In 2015, over 60 approved peptide therapeutics were on the market, and more than 600 peptidic compounds were subjected to preclinical or clinical trials, mostly in the area of metabolic diseases and oncology.4–7 Peptides are considered both tool compounds and potential drugs, in particular for modulating protein–protein interactions.8,9 However, only few peptide-specific computational methods for property prediction have been developed, which is reflected in the respective data scarcity in the public compound databases. The present study addresses the need for a bespoke lipophilicity model for short, linear peptides and peptide mimetics with drug-like functional groups.
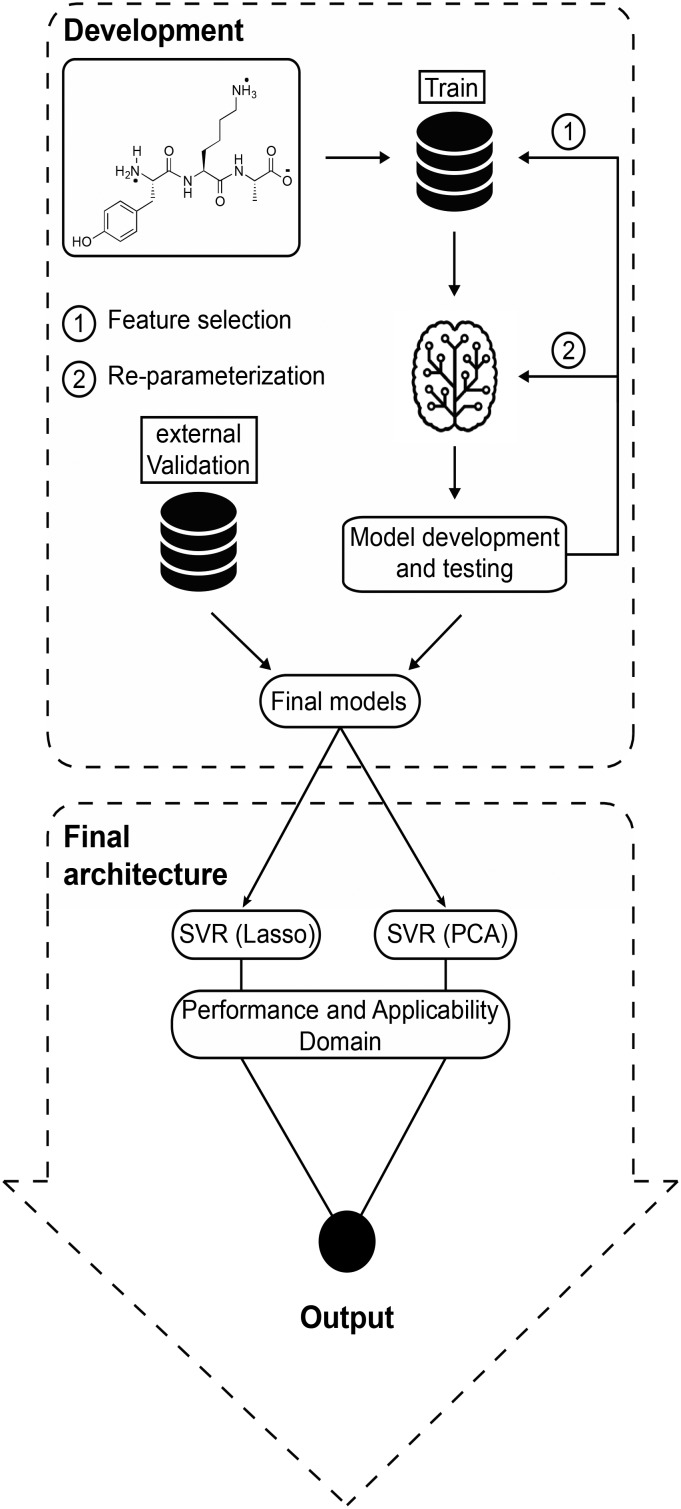
The first lipophilicity calculations date back to the seminal work of Hansch and Fujita, who also developed the shake-flask method, which is still considered the gold standard for the experimental determination of partition and distribution coefficients.10 These first models considered log P as the sum of additive lipophilic and hydrophilic contributions from individual molecular fragments. Tao et al. adapted this concept for linear, natural peptides, where each amino acid contributes additively to log P or log D, respectively.11 Modern machine learning techniques extend this principle by considering more complex molecular representations and have enabled the development of linear, nonlinear and local quantitative structure–property relationships (QSPR) models. For example, Visconti et al. proposed such a peptide-specific QSPR model, advocating the relevance of pH-dependent log D estimation.12 Here, we present a novel QSPR model based on machine learning techniques for predicting the log D of short, natural peptides and peptide mimetics at physiological pH (log D7.4) (Fig. 1).
Fig. 1. Development: log D7.4 prediction was based on training data splits, and the quality of the resulting models was assessed in five-fold cross-validation. Different feature combinations and parameter options were compared. The best models were then trained on the entire training set and tested on external validation data. Final architecture: log D7.4 is predicted by two models (SVR(Lasso) and SVR(PCA)). The applicability domain was estimated by a distance-based approach. The final output includes log D7.4 predictions from each model, an applicability domain assessment with regard to the known descriptor space of each model, and a performance-weighted consensus log D7.4 value.
Results and discussion
Structures and chemical space of peptide datasets
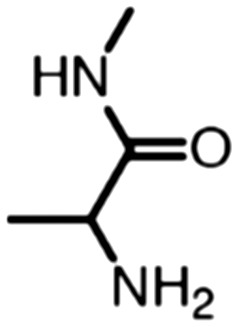
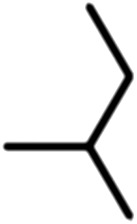
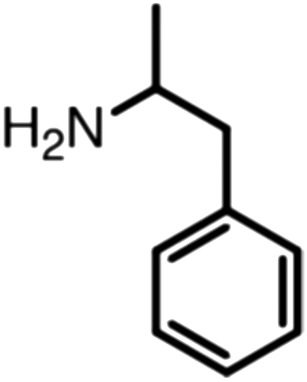
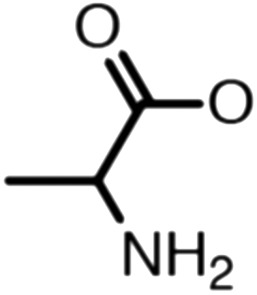
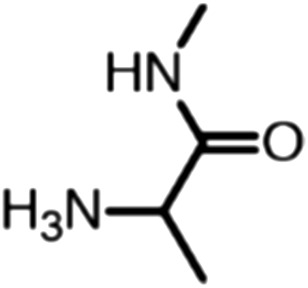
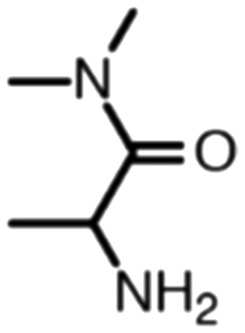
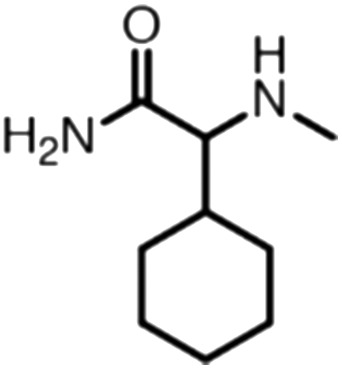
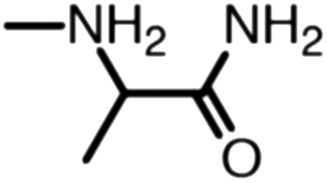
Publicly available data was collected from the literature (“LIPOPEP” set, 243 peptides). AstraZeneca (Mölndal, Sweden) provided lipophilicity values of 800 peptides and peptide mimetics from former drug discovery projects (“AZ” set). In analogy to a recent study,13 a substructure analysis of both datasets was performed, using atom-centered radial fragments derived from extended-connectivity fingerprints.14 The secondary amide bond (1) turned out as the most prevalent substructural feature of both datasets (Table 1). Other prominent substructures in LIPOPEP are the alkyl-motif of Val, Leu and Ile (2), the benzene-motif of Tyr and Phe (3), and the unsubstituted C- and N-termini (4–5). In the AZ set, the free –COOH terminus is rare because the C-termini are either blocked, cyclized, or linked to non-peptidic functional groups. The AZ compounds contain many functional groups that had been introduced to overcome metabolic instability, poor membrane permeability and peptide aggregation.15,16 There are many tertiary amides (6) replacing the secondary amide peptide backbone. Cyclohexane-derivatives are present in modified amino acid side-chains (7), as well as locally altered peptide backbones (8). A variety of condensed ring systems occurs in the AZ set, with 1-amino-tetrahydro-naphthalene being the most frequent representative.
Table 1. ECFP fingerprints were calculated and the average occurrences of substructures per compound were counted. The five most prevalent substructures of LIPOPEP and the six most prevalent from AZ are depicted.
| ID | 1 | 2 | 3 | 4 | 5 | 6 | 7 | 8 |
| Substructure |
|
|
|
|
|
|
|
|
| Occurrence per compound (LIPOPEP) | 1.45 | 0.88 | 0.59 | 0.48 | 0.48 | 0.06 | 0 | 0 |
| Occurrence per compound (AZ) | 1.82 | 0.39 | 0.20 | 0.03 | 0.39 | 0.70 | 0.40 | 0.35 |
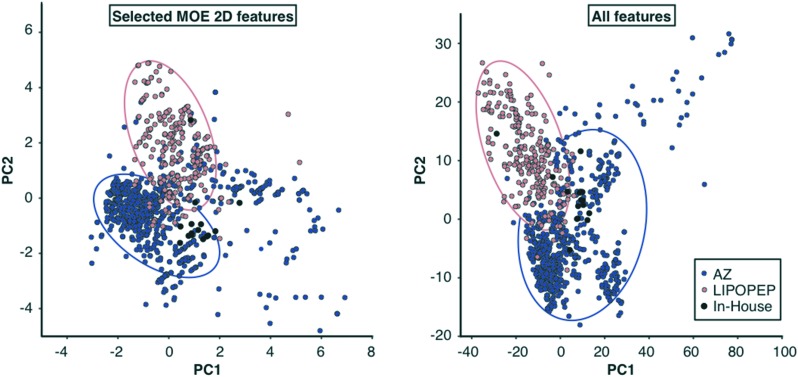
A principal component analysis (PCA) of the features used for model building revealed that the PCA spaces of AZ and LIPOPEP overlap only partially, highlighting the structural differences between these data sets (Fig. 2). The AZ compounds have a significantly greater average molecular weight (average MW = 672 ± 289 g mol–1) than the LIPOPEP compounds (average MW = 397 ± 106 g mol–1) (p < 0.01, non-parametric Mann–Whitney U test). While the average log D7.4 of the LIPOPEP data is –0.94 ± 1.09. The distribution of the AZ compounds reveals a clear shift towards higher log D7.4 (1.65 ± 1.31). These differences advocate for the need of computational tools to predict the chemical universe of both peptides and peptide mimetics.
Fig. 2. Score plots on the first two principal components of LASSO selected features and the extended set. PC1 and PC2 explain 31.6% and 21.6% of the variance in the selected feature set. For the extended set, PC1 and PC2 explain 22.9 and 8.7% of the variance. Each point represents one molecule, colored according to the respective dataset. PCA of the pooled MOE and Dragon descriptors led to a novel reduced feature set for modelling. While objects from the respective datasets tend to cluster (red circles include most LIPOPEP objects, blue circles most AZ objects), only partly overlap can be observed for different sets. AZ data populate the widest space.
Model development
LIPOPEP model
Machine learning techniques were used for feature selection, dimensionality reduction and regression modelling to predict log D7.4, leading to three different models based on the LIPOPEP data:
1. LASSO
Least absolute shrinkage and selection operator, a regularized multivariate regression model. The model complexity in terms of dimensionality of considered features is controlled by the tuning the α parameter of the LASOO method.
2. SVR(Lasso)
Support vector regression model based on selected features from LASSO.
3. SVR(PCA)
Support vector regression model based on PCA scores.
Model development started with 1D–2D molecular descriptors as input, which were calculated using MOE (v.2016.08, Molecular Operating Environment, The Chemical Computing Group, Montreal, Canada). For descriptor selection, the LASSO method was used with the tuning parameter α chosen such that the average root-mean-square error (RMSE) of cross-validation was minimal. The linear LASSO approach17,18 selected 11 out of 120 descriptors, most of which are related to charge- and surface-polarity (Table S1†). This descriptor combination was fed into a support vector regression model (SVR)19,20 with a Gaussian kernel, which was parameterized with respect to the hyperparameters C and γ. The resulting non-linear SVR was superior to LASSO (Table 2), thus we picked this “SVR(Lasso)” as the first model for log D7.4 prediction.
Table 2. Model statistics for all dataset- and model-combinations investigated in this study. The cross-validation error represents the performance of the best model in the development cycle. Final models learned the entire training sets and performance on the left-out data was assessed a single time. For each model RMSE and the percentage of peptides predicted within ±0.5 log units of the experimental value (% accurate) are reported. Consensus log D7.4 was calculated for the entire training sets, the external validation sets and the in-house set.
| Training set | Model | Cross validation
a
|
External validation LIPOPEP (N = 64) |
External validation AZ (N = 203) |
In-house (N = 15) |
||||
| RMSE | % accurate | RMSE | % accurate | RMSE | % accurate | RMSE | % accurate | ||
| LIPOPEP (N = 179) | LASSO | 0.60 ± 0.09 | 75.5 ± 7.4 | 0.54 | 73.4 | 2.04 | 18.2 | 0.79 | 46.7 |
| SVR(Lasso) | 0.47 ± 0.13 | 86.0 ± 3.1 | 0.39 | 90.6 | 1.34 | 28.1 | 0.47 | 66.7 | |
| SVR(PCA) | 0.59 ± 0.11 | 73.8 ± 4.1 | 0.41 | 75.0 | 2.02 | 10.8 | 1.06 | 40.0 | |
| Consensus | 0.26 b | 94.4 b | 0.29 | 89.1 | 1.65 | 16.1 | 0.75 | 46.7 | |
| Pooled (N = 776) | SVR(Lasso) | 0.77 ± 0.05 | 65.2 ± 3.1 | 0.36 | 90.6 | 0.91 | 52.2 | 1.02 | 0.0 |
| SVR(PCA) | 0.78 ± 0.04 | 58.9 ± 3.3 | 0.46 | 78.1 | 0.81 | 57.6 | 0.97 | 53.3 | |
| Consensus | 0.57 b | 72.3 b | 0.38 | 85.9 | 0.80 | 56.7 | 0.90 | 53.3 | |
aAverage values and standard deviation are given.
bConsensus output was calculated for the entire training set.
In order to account for additional structural information than physicochemical properties, 1188 pre-processed Dragon 1D to 2D descriptors were added to the 120-dimensional MOE descriptor set. These descriptors also take topological information and atomic properties into consideration. Again, PCA21 was conducted to obtain the scores as input features. The scree plot of this PCA suggests the use of the first 20 components, which account for 66% of the variance (Fig. S1†). SVR was conducted on these 20 PCA scores and optimized the model again with respect to C and γ. Regression performance on cross-validated training data justified the choice of PCA scores (Table 2). We selected this “SVR(PCA)” as the second model for log D7.4 prediction.
The features spaces of the two SVR models differ (Fig. 2), capturing complementary structural and physicochemical aspects of the LIPOPEP data.
Model training on peptides and peptide mimetics from drug discovery projects
After developing log D7.4 models on the limited LIPOPEP set, we tested the ability of the two resulting SVR models to predict the AZ data. Due to the differences between both data sets in terms of chemical structures and log D7.4 distributions, we observed poor generalization ability of the SVR models on the external validation partition of the AZ set (Table 2). Specifically, there was a trend of increasing prediction error for more lipophilic compounds. Apparently, the models' applicability domain did not account for log D7.4 values outside the range of the LIPOPEP set.
Both datasets (LIPOPEP + AZ) were pooled to account for the need of an expanded dataset from which the models can learn relevant features of AZ peptides. The resulting log D7.4 distribution is bimodal with peaks at log D7.4 = –1 (mostly short peptides), and log D7.4 = 2.5 (AZ compounds) (Fig. S2†). To account for this characteristic in the training and external validation partitions, we split the AZ set in analogy to LIPOPEP (cf. Experimental section). The SVR(Lasso) and SVR(PCA) models were then retrained on the augmented training data.
Domain of applicability estimation and consensus modelling
The models' applicability domain was estimated by delimiting the descriptor space covered by the training data.22 This approach seeks for anomalies in descriptor space and helps to understand which kind of compounds may therefore not be properly considered by the model. We implemented a distance-based approach for novelty detection (cf. Experimental section, Fig. S4†). If a query compound lies outside of the applicability domain, the respective predicted log D7.4 value will be flagged.
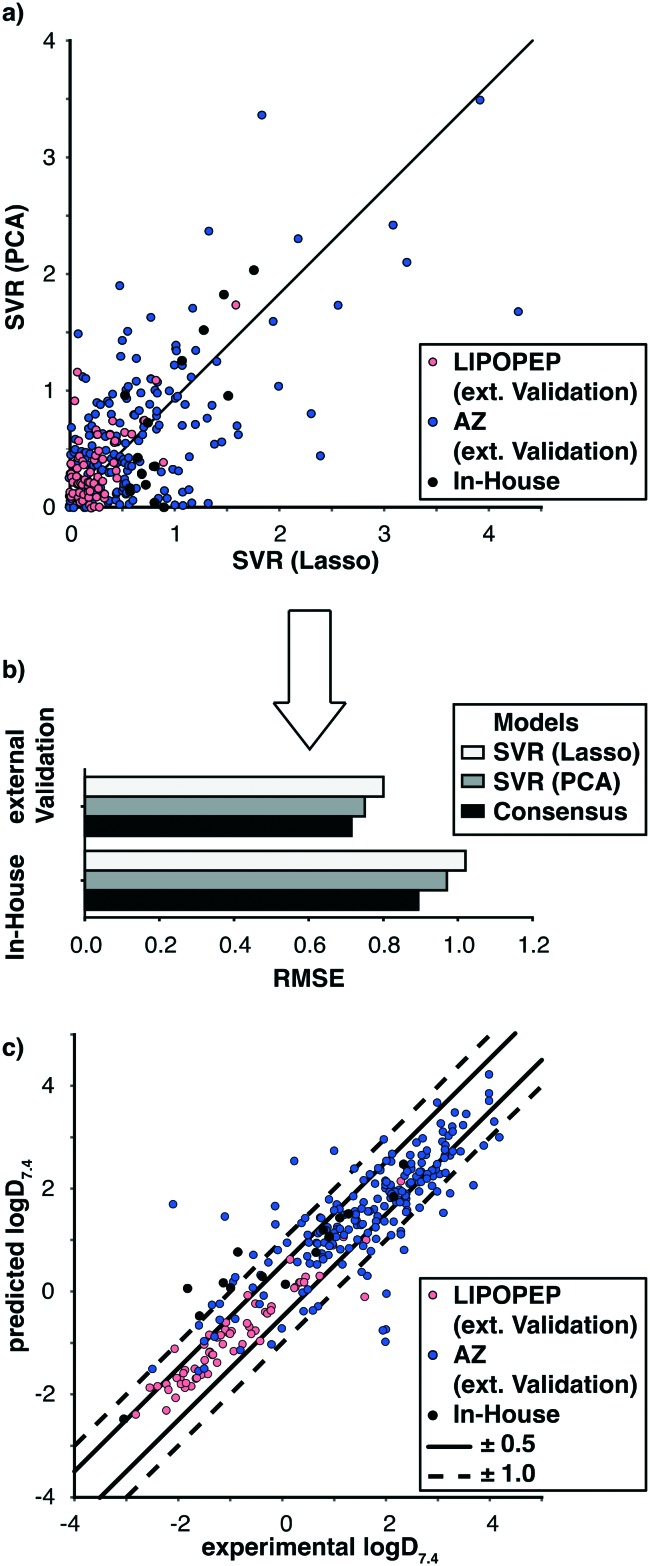
The two selected models capture different aspects of the structural features related to the peptide lipophilicity (Fig. 3a). Thus, different approaches of consensus scoring were implemented. It turned out, that an average log D7.4 value, weighted according to the cross validation RMSE of the respective models, presented a straightforward solution with the highest impact on model performance (Fig. 3b).
Fig. 3. Prediction-error and -performance on the left-out data of the pooled dataset. a) Error comparison of both SVR-based models. Objects in the upper left triangle were predicted better by the SVR(Lasso) model, objects in the lower left triangle by SVR(PCA). b) RMSE comparison of both SVR(Lasso) and SVR(PCA) and consensus approach. c) Scatterplot of experimental to predicted consensus log D7.4. Predictions within the straight margins are considered to be accurate, predictions within the dashed margin to be acceptable.
The introduction of various kinds of second layer decision models (e.g., jury network approach) did not lead to a superior outcome in this study (data not shown).
Model performance
LASSO training on the LIPOPEP data resulted in a robust linear relationship of the selected features to log D7.4 with an accuracy of 73% (Table 2). By introducing non-linear support vector regression, the model achieved an accuracy level of 90% on the external validation set and 67% on the in-house peptides, that had not been used for model development. For SVR(PCA), we investigated fitting and cross-validation performance for increasing numbers of principal components, which advocated the choice of 20 components as an acceptable trade-off between prediction bias and variance. This nonlinear model showed comparable performance to SVR(Lasso). On the LIPOPEP set, both models yielded comparable accuracy of fit, namely RMSE = 0.39 (SVR(Lasso)) and RMSE = 0.41 (SVR(PCA)).
When using the pooled dataset for training, we observed a lower model performance. On the external validation set, the RMSE increased to 0.80 (SVR(Lasso)) and to 0.75 (SVR(PCA)), respectively. This increase likely is a consequence of the augmented feature space and extended log D7.4 range. Both models were able to predict approximately 60% of the data with an error of ±0.5 log units. When applying the models trained on pooled data to in-house peptides, RMSE values of 1.02 (SVR(Lasso)) and 0.97 (SVR(PCA)) were observed. The most accurate predictions for this dataset were obtained with SVR(Lasso) when trained on LIPOPEP data (RMSE = 0.47). For comparison, the experimental standard deviation of the six log D7.4 determinations for each peptide by the shake-flask method (cf. Experimental section) ranges from 0.01 to 0.29 log units. Apparently, the SVR(Lasso) model is able to generalize to hexapeptides with an error comparable to the experimental error. Importantly, these peptides fall into the lipophilicity range of LIPOPEP and into the model's domain of applicability.
In order to assess the risk of model overfitting, y-scrambling of all model- and dataset-combinations was performed. Meaningful model development is expected to fail for scrambled data. In fact, the correlations of predicted to experimental values are almost arbitrary for scrambled data (Table S2†). The RMSE for all models trained on LIPOPEP increased to approximately 1.1 and to approximately 1.8 on the pooled data, respectively.
Besides similar overall performance of SVR(Lasso) and SVR(PCA) in terms of RMSE, the individual prediction can differ (Fig. 3a).
Combining the output of both models (consensus) led to an RMSE reduction for the pooled external validation partition and the in-house set (Fig. 3b). The experimental vs. predicted consensus log D7.4 for the left-out data is shown in Fig. 3c. The majority of these predictions was accurate, with <10% of the predictions outside the accuracy criterion of ±1.0 log units. Importantly, the consensus model performed accurately over the full lipophilicity range.
Model benchmarking
The consensus log D7.4 model based on SVR(Lasso) and SVR(PCA) trained on pooled data was compared with three commercial models: (i) ADMET Predictor™ (ADMET Predictor v8.5. Simulations Plus, Inc., Lancaster, CA, USA), (ii) ACD/Labs (ACD Percepta 2015 Build 2726, Advanced Chemistry Development, Inc., Toronto, Canada, ; www.acdlabs.com) and (iii) ChemAxon (Instant JChem, v18.5.0, 2018, ; www.chemaxon.com). Table 3 reveals that the new model performs with a mean absolute error of <0.5 log units and the lowest standard deviation of the absolute error, yielding 70% accurate predictions. Judging from these results, it is superior to the commercial models with regard to predicting peptide log D7.4. ADMET Predictor™ performs second best with 19% less accuracy than our consensus model.
Table 3. Benchmarking results on all data (training and external validation partitions of LIPOPEP and AZ sets and in-house peptides; Ntotal = 1058).
| Model | RMSE | Accuracy [%] | Absolute error [mean ± stddev] |
| In-house | 0.6 | 70 | 0.4 ± 0.5 |
| ADMET-predictor | 1.0 | 51 | 0.7 ± 0.8 |
| ACD/labs | 1.9 | 45 | 1.1 ± 1.5 |
| ChemAxon | 2.5 | 31 | 1.3 ± 2.1 |
| Arithmetic average model | 1.7 | 20 | 1.4 ± 0.9 |
| Experimental stddev [mean ± stddev] | 0.08 ± 0.11 a | ||
aSix individual log D7.4 determinations for each peptide of the in-house set (N = 15).
Certainly, the new model has the advantage that it has seen 75% of the data already in training but the similar performance between cross-validation and external validation justifies to consider all peptides for benchmarking.
Mannhold et al. state that models with RMSE > RMSE of an arithmetic average model (AAM) could be considered as non-predictive.3 The AAM considers the mean experimental value of a given dataset as the prediction for all respective entries. ACD/Labs and ChemAxon models both produce a lower RMSE than AAM. ChemAxons model did not achieve a significantly lower mean absolute error than the AAM on the complete data (p > 0.05, Mann–Whitney U test).
ADMET Predictor™ flags compounds that lie outside its applicability domain by a range-based approach. 19% of the AZ compounds but only 3% of the LIPOPEP compounds are flagged by this tool, indicating that ADMET Predictor™ might provide unreliable predictions for peptide mimetics. For the non-flagged compounds alone, the performance of ADMET Predictor™ increased (RMSE = 0.9, accuracy = 54%, absolute error = 0.6 ± 0.6) but the mean absolute error was not significantly lower than for the complete dataset (p > 0.05, Mann–Whitney U test).
Conclusions and outlook
Established machine learning algorithms have demonstrated sustained usefulness to obtain practically applicable lipophilicity models for peptides and peptide mimetics in the log D7.4 range of –3.05 to 5.08. The methods for feature selection and dimensionality reduction facilitated robust modelling with limited amounts of data. Reliable log D7.4 prediction for short peptides is of particular practical relevance because 80% of the approved peptide drugs from 2012–2016 contain only two to ten amino acid residues.23 The model achieved accurate predictions for the AZ data with various non-natural chemical structures, thereby accounting for pharmaceutically relevant compounds. Certainly, this consensus model is only a first step towards log D7.4 prediction for peptides and peptide derivatives. Future developments should take the solvent-dependent potential to change conformations into account,23,24 for example by short molecular dynamics simulations.25 Currently, our approach does not consider three-dimensional molecule conformers, similar to the commercial models investigated in this study.26–31 When applied to peptides and their synthetic derivatives, these tools revealed weaknesses, corroborating the necessary development of dedicated log D7.4 predictors for this compound class.
Experimental section
Datasets
Three datasets annotated with log D7.4, as determined by the shake-flask method, were used in this study:
1. LIPOPEP:
A collection of 243 short, linear di- to pentapeptides from literature. 223 peptides come from the collection of Thompson et al.,32 the others stem from additional sources.33–35 We manually filtered for peptides measured at pH 7.0 to 7.4 and reliable experimental information (solvents, shake-flask procedure and quantification). In case of ionizable compounds for which log D7.0 was measured, we assumed only a marginal change in the distribution profile to pH 7.4, except for seven histidine-containing peptides (pKa ≈ 6). Neutral peptides are part of LIPOPEP because blocked some sequences have blocked C- and N-termini and annotated log D7.4 values. Further chemical modifications or non-natural amino acids do not occur.
2. AZ:
This dataset consists of log D7.4 data for 800 peptides and peptide-mimetics from former AstraZeneca drug discovery projects. These structures comprise complex chemical functionalities and structural features such as non-natural amino acids, cyclisation and functionalization with hydrophobic linkers.
3. In-house:
A set of 15 peptides for which log D7.4 was determined by adapting the shake-flask method explained in the section “Measurement of log D”. While three model peptides (Gly-Pro-Gly-NH2, Acetyl-Gln-Trp-Leu-NH2, Tyr-Pro-Trp-Phe-NH2) were purchased to set up experimental conditions of the shake-flask method (Bachem AG, Bubendorf, Switzerland), 12 of the hexapeptides were synthesized in our group. The hexapeptides are basic (amidated C-Terminus) and consist of the ten most frequent amino acids in LIPOPEP in randomized sequences.
Structure pre-processing and descriptor calculation
All structures were represented in Simplified Molecular Line Entry Systems (SMILES) format and standardized for pH = 7 with MOE, prior to descriptor calculation. Two types of molecular descriptors were computed:
1. MOE 1D–2D descriptors (v2016.08, Molecular Operating Environment, Chemical Computing Group Inc., Montreal, QC, Canada).
2. Dragon 1D–2D descriptors (v7, Kode Chemoinformatics, Pisa, Italy).
Descriptors that were non-informative (relative standard deviation <2.5%), missing valued or redundant (R2 > 0.95) were removed. For the latter case, the feature with the higher mean R2 to all others was removed. This resulted in 120 MOE descriptors and 1188 Dragon descriptors. The descriptors were mean–centered and scaled to unit variance prior to any machine learning experiment, in order to avoid biased evaluations due to different descriptor scales.
Machine learning methods
Methodology
100% of the data were split into a five-fold cross-validation set (75%) and an external validation set (25%). To ensure similar log D7.4-distributions in both splits, the objects were clustered in 10 groups according to their lipophilicity by k-mean clustering, and from each group 25% of the data were randomly left-out. A grid based five-fold cross-validation approach was chosen for re-parameterizing the models and exploring various feature combinations. Final models were re-trained on the entire training set. The robustness of the final models was assessed by 100-times training on y-randomized data.
We assessed model performance by (i) the root-mean-square error (RMSE), representing the average model error expressed in the same units as the experimental response, (ii) percentage of accurate predictions (% accurate), within the range ±0.5 log units of the experimental value, and (iii) correlation metrics. While the correlation of predicted and true values for the training set is sufficiently explained by R2, it is common practice to calculate Q2 metrics for the left-out data in the cross-validation partition and external validation sets. The purpose is to transform the information from RMSE of the fitting into an index in the range of –∞ to 1. If done properly, a greater Q2 value suggests a lower model error.36 All formulas are presented in the ESI† (Fig. S5).
Unsupervised learning
k-Means clustering
k-Means objective is to partition the data in k groups, such that the squared error between the empirical mean of a cluster and the points in the cluster is minimized over all k clusters.37 In eqn (1), μk denotes the mean of the cluster ck and xi is the set of i n-dimensional objects to be clustered.
 |
1 |
The algorithm randomly seeds k cluster points to the data and assigns each object (here: molecules) to its nearest cluster point. After characterizing each cluster by its centroid value, the molecules are re-assigned to the cluster point with the closest centroid according to a pre-defined distance measure. New centroid calculation and re-assignment is conducted iteratively until convergence.
Principal component analysis
We used principal component analysis (PCA) for feature analysis, visualization and dimensionality reduction.21 PCA creates n linear combinations of the original variables (principal components, PC), such that the first component explains largest data variance. Any k-th component can be expressed as a linear combination of the original descriptors, where PCk is the k-th component, Xi is any i-th molecular descriptor vector and bik is the corresponding coefficient (“loading”) of the linear combination (eqn (2)).
| PCk = b1kX1 + b2kX2 + … + bikXi | 2 |
The loadings define the direction in feature space in which the data variance is maximal. Since they sum up to 1, these coefficients indicate which variables influence a model and how features are correlated.
Supervised learning
LASSO
The least absolute shrinkage and selection operator 17,18 extends multivariate regression analysis by regularizing the regression coefficients of the canonical ordinary least squares model. The coefficient shrinkage allows feature selection to avoid overfitting the data and potentially rendering the model more interpretable. For descriptors xij and output yi (i = 1,2,…,n and j = 1,2,…,p) LASSO solves the regression problem of finding β = {βj} to minimize eqn (3) subject to ∑|βi| ≤ s, where s is a predefined threshold, determining the degree of regularization.
 |
3 |
By forcing the sum of the absolute value of the regression coefficients below the fixed threshold, some coefficients will approach zero, leading to a simpler model without the respective features. α is a tuning parameter that regulates the complexity of the model and displays a model's trade-off between bias and variance.
Support vector machine regression
This supervised machine learning algorithm was introduced to solve binary classification problems.38 Briefly, input vectors are mapped to a high-dimensional feature space (latent space), enabling the construction of a linear decision hyperplane, which is defined by the normal vector w and location vector b (eqn (4)).
| wx – b = 0 | 4 |
Slack variables ξi enable the generalization of the concept to the non-separable case. The parameter C controls the degree of freedom of ξi, i.e. how much the model tolerates violation of the hyperplane margin. For operating in high-dimensional feature space, the original features are implicitly transformed by a kernel function (eqn (5)) that quantifies the similarity of two observations by generalizing the inner product of two vectors in form of
| K(xixi,) | 5 |
Computing the similarities as novel features is done by placing proximity landmarks in feature space, and similarity is calculated by kernel functions. Here, we employed the Gaussian kernel (eqn (6)) to solve a regression problem.19,20
 |
6 |
Applicability domain estimation
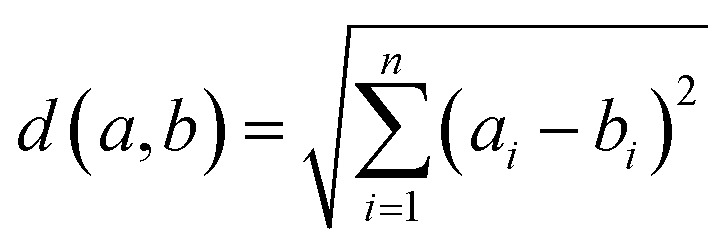
We compute descriptor similarity of query compounds to the known descriptor spaces of the models by Euclidean distance, where d(a,b) is the distance between two molecules a and b; ai is the value of descriptor i for molecule a and bi is the value of descriptor i for molecule b (eqn (7)).
 |
7 |
For the training set, we calculated the average distance of all compounds to the centroid of the data set. Peptides were considered outside the applicability domain if their distance from the model centroid was larger than twice the average distance of the training peptides from the centroid (threshold h).39 The analysis (Williams plot) of the respective applicability domains of SVR(Lasso) and SVR(PCA) are provided in Fig. S4.†
Technical implementation
Data analysis and modelling were performed in Python (v2.7, www.python.org) using Jupyter notebooks (; www.jupyter.org). k-Means, PCA, LASSO and SVR were implemented using scikit-learn (v0.19.0, ; www.scikit-learn.org).
Laboratory methods
Peptide synthesis and analytics
9-Fluorenylmethoxycarbonyl (Fmoc) solid phase peptide synthesis was performed on a Symphony peptide synthesizer (Gyros Protein Technologies, Tucson, USA) with dimethylformamid (DMF) (Honeywell Speciality Chemicals, Seetze, Germany) as solvent. 50 μM Rink amide 4-methyl benzhydrylamine (MBHA) resin (0.52 mmol g–1) (AAPPTec, USA) was used for solid support. The amino acids were purchased from AAPPTec (Louisville, USA) and Gyros Protein Technologies, Inc. (Tucson, USA). Coupling was conducted using 400 mM O-(6-chlorobenzotriazol-1-yl)-N,N,N′,N′-tetramethyluronium hexafluorophosphate (HCTU) (Gyros Protein Technologies, Tucson, USA) and 800 mM N-methyl-morpholine (NMM) (Fisher Chemical, Pittsburgh, USA) in DMF with a mol ratio of 0.1 resin : 1 amino acid : 1 HCTU : 2 NMM. Before and after deprotection of base-labile Fmoc protection groups from the resin and the amino acids with a solution of 20% pyrrolidine (Acros organics, USA) in DMF, the reaction vial was washed with DMF. After coupling the last amino acid the reaction vial was washed with DMF and second with dichloromethane (DCM) (Sigma-Aldrich, St. Louis, USA). Finally, the side chain protection groups and the resin were cleaved with 95% trifluoroacetic acid (TFA) (ABCR, Karlsruhe, Germany), 2.5% triisopropylsilane (TIS) (Sigma-Aldrich, St. Louis, USA), 2.5% nanopure water (v/v/v). The products precipitated for at least two hours in diisopropyl-ether (Merck Millipore, Darmstadt, Germany) at –20 °C, following four washing steps with centrifugation (10 min, 3000 rpm, –10 °C), removal of the supernatant and re- suspension in cold diisopropyl-ether. The crude peptides were left for drying overnight. We used reversed phase preparative HPLC (Shimadzu, Kyoto, Japan) with a Nucleodur C18 HTec column (150 × 21 mm, 5 μm, 110 Å) for peptide purification. Gradient runs were performed from 5–70% acetonitrile (ACN) (Fisher Scientific, Loughborough, UK) in nanopure water +0.1% formic acid (Sigma-Aldrich, St. Louis, USA) over 25 min with a flowrate of 24.5 ml min–1. Compounds were detected either by UV (210 nm) (Shimadzu SPD-M20A DAD) or electrospray mass detection (Shimadzu LCMS-2020) over a mass range of 300–1500 or 300–2000. The purified products were analyzed by both UV (210, 228, 254, 270, 290, 310 nm) and mass detection using a Nucleodur C18 HTec analytical column (150 × 3 mm, 5 μm, 110 Å) under the same conditions, except for adjusting the flow rate to 0.5 ml min–1 and injection volume to 10 μl. Finally, we lyophilizated the peptides with an Alpha 2–4 LDplus Freeze Dryer (Christ, Osterode am Harz, Germany) at 0.03 mbar and –85 °C.
Measurement of log D7.4
Log D7.4 was measured by adapting the shake flask procedure from OECD40 at room temperature in n-octanol >99% (Sigma-Aldrich, St. Louis, USA) and 20 mM phosphate-buffer pH 7.4 (PB). Solvents were mutually saturated by shaking overnight and following separation. We prepared stock solutions in either PB or n-octanol at 25–100 μg ml–1 and after shaking one hour (PB/n-octanol ratio between 1 : 1 and 1 : 10 respectively 6 : 1 depending on the lipophilic character of the peptide) and phase separation of 15 min, samples were centrifuged 10 min. Quantification in one phase before and after shaking of three independent samples was performed with HPLC-UV (VWR L-2000 series) and external calibration on a Lichrospher 100 RP18 column with isocratic runs (H2O + 0.1% TFA: ACN + 0.1% TFA in differing phase compositions). A stock solution aliquot served as quality control of the calibration. The final result was specified as the mean of all six samples.
Conflicts of interest
The authors declare the following competing interests: G. S. declares a potential financial conflict of interest in his role as life science industry consultant and cofounder of inSili.com GmbH, Zurich.
Supplementary Material
Acknowledgments
We thank Sarah Haller, Christian Steuer and Ruth Alder for technical assistance. This research was financially supported by the Schweizerischer Nationalfonds zur Förderung der Wissenschaftlichen Forschung (grant no. CR3212_159737).
Footnotes
†Electronic supplementary information (ESI) available. See DOI: 10.1039/c8md00370j
References
- Arnott J. A., Planey S. L. Expert Opin. Drug Discovery. 2012;7:863–875. doi: 10.1517/17460441.2012.714363. [DOI] [PubMed] [Google Scholar]
- Waring M. J. Expert Opin. Drug Discovery. 2010;5:235–248. doi: 10.1517/17460441003605098. [DOI] [PubMed] [Google Scholar]
- Mannhold R., Poda G. I., Ostermann C., Tetko I. V. J. Pharm. Sci. 2009;98:861–893. doi: 10.1002/jps.21494. [DOI] [PubMed] [Google Scholar]
- Fosgerau K., Hoffmann T. Drug Discovery Today. 2015;20:122–128. doi: 10.1016/j.drudis.2014.10.003. [DOI] [PubMed] [Google Scholar]
- Qvit N., Rubin S. J. S., Urban T. J., Mochly-Rosen D., Gross E. R. Drug Discovery Today. 2017;22:454–462. doi: 10.1016/j.drudis.2016.11.003. [DOI] [PMC free article] [PubMed] [Google Scholar]
- Gabernet G., Müller A. T., Hiss J. A., Schneider G. Med. Chem. Commun. 2016;7:2232–2245. [Google Scholar]
- Fjell C. D., Hiss J. A., Hancock R. Nat. Rev. Drug Discovery. 2012;11:37–51. doi: 10.1038/nrd3591. [DOI] [PubMed] [Google Scholar]
- Nevola L., Giralt E. Chem. Commun. 2015;51:3302–3315. doi: 10.1039/c4cc08565e. [DOI] [PubMed] [Google Scholar]
- Bruzzoni-Giovanelli H., Alezra V., Wolff N., Dong C.-Z., Tuffery P., Rebollo A. Drug Discovery Today. 2017;23:272–285. doi: 10.1016/j.drudis.2017.10.016. [DOI] [PubMed] [Google Scholar]
- Hansch C., Iwasa J., Fujita T. J. Am. Chem. Soc. 1964;86:5175–5180. [Google Scholar]
- Tao P., Wang R., Lai L. J. Mol. Model. 1999;5:189–195. [Google Scholar]
- Visconti A., Ermondi G., Caron G., Esposito R. J. Comput.-Aided Mol. Des. 2016;29:361–370. doi: 10.1007/s10822-015-9829-4. [DOI] [PubMed] [Google Scholar]
- Nembri S., Grisoni F., Consonni V., Todeschini R. Int. J. Mol. Sci. 2016;17:914. doi: 10.3390/ijms17060914. [DOI] [PMC free article] [PubMed] [Google Scholar]
- Rogers D., Hahn M. J. Chem. Inf. Model. 2010;50:742–754. doi: 10.1021/ci100050t. [DOI] [PubMed] [Google Scholar]
- Di L. AAPS J. 2014;17:134–143. doi: 10.1208/s12248-014-9687-3. [DOI] [PMC free article] [PubMed] [Google Scholar]
- Craik D. J., Fairlie D. P., Liras S., Price D. Chem. Biol. Drug Des. 2012;81:136–147. doi: 10.1111/cbdd.12055. [DOI] [PubMed] [Google Scholar]
- Tibshirani R. J. R. Statist. Soc. B. 1996;58:267–288. [Google Scholar]
- Tibshirani R. J. R. Statist. Soc. B. 2011;73:273–282. [Google Scholar]
- Drucker H., Burges C., Kaufman L., Smola A. and Vapnik V., Adv. Neural. Inf. Process Syst., 1997, pp. 155–161. [Google Scholar]
- Smola A. J., Schölkopf B. Statistics and Computing. 2004;14:199–222. [Google Scholar]
- Jolliffe I. T., in Principal Component Analysis, Springer New York, 1986, pp. 115–128. [Google Scholar]
- Mathea M., Klingspohn W., Baumann K. Mol. Inf. 2016;35:160–180. doi: 10.1002/minf.201501019. [DOI] [PubMed] [Google Scholar]
- Santos G. B., Ganesan A., Emery F. S. ChemMedChem. 2016;11:2245–2251. doi: 10.1002/cmdc.201600288. [DOI] [PubMed] [Google Scholar]
- Whitty A., Zhong M., Viarengo L., Beglov D., Hall D. R., Vajda S. Drug Discovery Today. 2016;21:712–717. doi: 10.1016/j.drudis.2016.02.005. [DOI] [PMC free article] [PubMed] [Google Scholar]
- Riniker S. J. Chem. Inf. Model. 2017;57:726–741. doi: 10.1021/acs.jcim.6b00778. [DOI] [PubMed] [Google Scholar]
- Ortwine D. F., Aliagas I. Mol. Pharmaceutics. 2013;10:1153–1161. doi: 10.1021/mp3006193. [DOI] [PubMed] [Google Scholar]
- Johnson T. W., Dress K. R., Edwards M. Bioorg. Med. Chem. Lett. 2009;19:5560–5564. doi: 10.1016/j.bmcl.2009.08.045. [DOI] [PubMed] [Google Scholar]
- Manchester K. R., Maskell P. D., Waters L. Drug Test. Anal. 2018:1–12. doi: 10.1002/dta.2387. [DOI] [PubMed] [Google Scholar]
- Wenlock M. C., Austin R. P., Barton P., Davis A. M. J. Med. Chem. 2003;46:1250–1256. doi: 10.1021/jm021053p. [DOI] [PubMed] [Google Scholar]
- Ritchie T. J., Luscombe C. N., Macdonald S. J. F. J. Chem. Inf. Model. 2009;49:1025–1032. doi: 10.1021/ci800429e. [DOI] [PubMed] [Google Scholar]
- Hou T., Wang J., Zhang W., Xu X. J. Chem. Inf. Model. 2007;47:460–463. doi: 10.1021/ci6003515. [DOI] [PubMed] [Google Scholar]
- Davies M. N., Flower D. R. Dataset Papers in Biology. 2013:1–4. doi: 10.7167/2013/706465. [DOI] [PMC free article] [PubMed] [Google Scholar]
- Conradi R. A., Hilgers A. R., Ho N., Burton P. S. Pharm. Res. 1991;8:1453–1460. doi: 10.1023/a:1015825912542. [DOI] [PubMed] [Google Scholar]
- Knipp G. T., Vander Velde D. G., Siahaan T. J., Borchardt R. T. Pharm. Res. 1997;14:1332–1340. doi: 10.1023/a:1012152117703. [DOI] [PubMed] [Google Scholar]
- Hunter E. B., Powers S. P., Kost L. J., Pinon D. I., Miller L. J., LaRusso N. F. Hepatology. 1990;12:76–82. doi: 10.1002/hep.1840120113. [DOI] [PubMed] [Google Scholar]
- Todeschini R., Ballabio D., Grisoni F. J. Chem. Inf. Model. 2016;56:1905–1913. doi: 10.1021/acs.jcim.6b00277. [DOI] [PubMed] [Google Scholar]
- Proceedings of the Fifth Berkeley Symposium on Mathematical Statistics and Probability, ed. L. M. Le Cam and J. Neyman, Univ. of California Press, Berkeley, 1967. [Google Scholar]
- Cortes C., Vapnik V. Mach. Learn. 1995;20:273–297. [Google Scholar]
- Sahigara F., Mansouri K., Ballabio D., Mauri A., Consonni V., Todeschini R. Molecules. 2012;17:4791–4810. doi: 10.3390/molecules17054791. [DOI] [PMC free article] [PubMed] [Google Scholar]
- OECD, Test No. 107: Partition Coefficient (n-octanol/water): Shake Flask Method, OECD Guidelines for the Testing of Chemicals, Section 1, OECD Publishing, Paris, 1995, 10.1787/9789264069626. [DOI]
Associated Data
This section collects any data citations, data availability statements, or supplementary materials included in this article.


