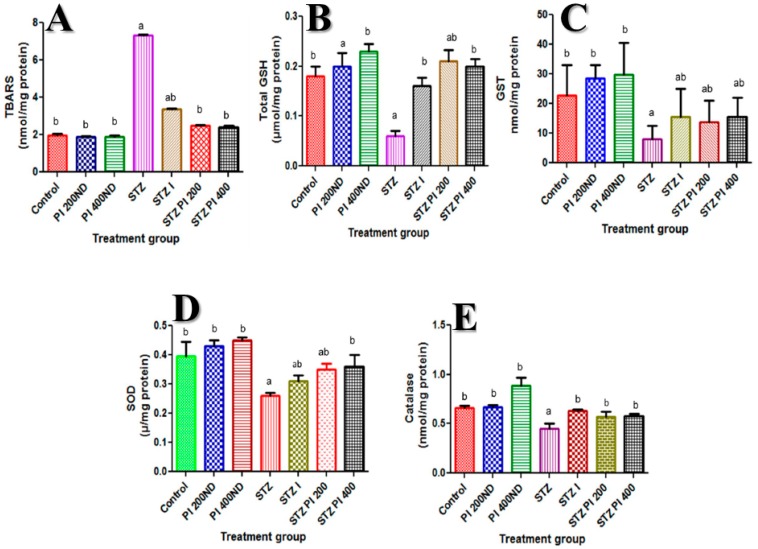
Figure 3.
Effect of PBPi on assessment of oxidative stress and antioxidants. (A) TBARS (nmol/mg protein), (B) Total GSH (μmol/mg protein), (C) GST (nmol/mg protein), (D) SOD (μ/mg protein), (E) CAT (nmol/mg protein). Data are presented as mean ± S.D. (n = 10). Mean differences are significant (p < 0.05) when compared with: a control group, b STZ only. Thiobarbituric acid reactive substances (TBARS), total reduced glutathione (Total GSH), glutathione-S-transferase (GST), superoxide dismutase (SOD), catalase (CAT).

