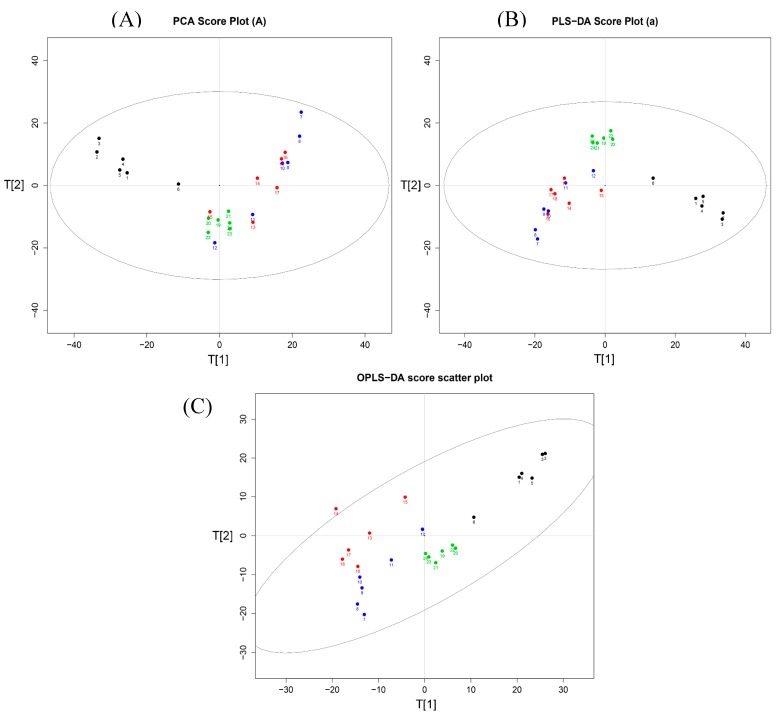
Figure 5.
(A) Score plots of principle component analysis (PCA), (B) partial least-squares discriminant analysis (PLS-DA) and (C) orthogonal partial least-squares discriminant analysis (OPLS-DA) analysis on the fever rat serum metabolic profiles of normal control (black dot), model (blue dot), SB treatment (red dot) and NB treatment group (green dot).

