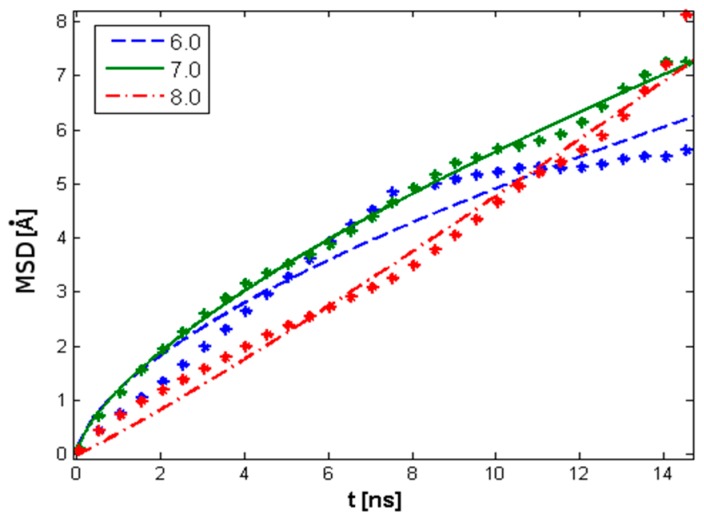
Figure 6.
Mean square displacement (MSD) of single HA molecules at different pH values. The data has been fit using the exponential function such that when , normal diffusion is represented; when , subdiffusion is represented; and when , superdiffusion is represented. Individual exponents are presented in Table 2. The legend indicates pH values.

