

Abstract
Background:
Sinonasal symptoms are common and can have several underlying causes. When symptoms occur in specified patterns lasting three months or more they meet criteria for chronic rhinosinusitis (CRS). Approaches to CRS symptom measurement do not specify how to measure symptoms and treat six sinonasal symptoms as generally interchangeable, suggesting that such symptoms should cluster on one or two latent factors.
Methods:
We used questionnaire responses to 37 questions on presence, severity, bother, and frequency of cardinal sinonasal and related symptoms lasting three months, from 3535 subjects at three time points over 16 months. We completed five exploratory factor analyses (EFA) to identify symptom clustering, one for each time point and two for the differences between adjacent questionnaires. The baseline EFA was used to provide factor scores that were described longitudinally and examined by CRS status.
Results:
Five EFAs identified the same five factors (blockage and discharge, pain and pressure, asthma and cold/flu symptoms, smell loss, and ear and eye [mainly allergy] symptoms), with clustering determined by symptom frequency, severity, and degree of bother. Responses to individual questions showed changes over time but when combined into factor scores showed less longitudinal change. All symptom factor scores were progressively higher from never to past to current CRS status.
Conclusions:
Although the current approaches to symptom characterization in CRS imply a single underlying latent construct, our results suggest that there are at least three latent constructs relevant to CRS. Further studies are needed to evaluate if these clusters have identifiable underlying pathobiologies.
Introduction
Chronic rhinosinusitis (CRS) is an inflammatory condition characterized by sinonasal symptoms, affecting up to 15% of the United States population [1]. Various groups have defined six symptoms of the disease (generally ascertained with four questions) which include nasal blockage/congestion, drainage (anterior or posterior combined into single question), smell loss, and facial pain or pressure (combined into single question) lasting at least 12 weeks [2–5]. The European Position Paper on Rhinosinusitis and Nasal Polyps (EPOS) has outlined criteria for clinical diagnosis of CRS, requiring subjective symptoms (nasal obstruction or discharge and at least one other symptom) lasting three months and objective evidence of inflammation on sinus computerized tomography (CT) scan or endoscopy [1]. Obtaining sinus CT or endoscopy in large-scale population studies is a recognized challenge; therefore, EPOS also advances an epidemiologic definition of CRS based on presence and duration of symptoms only (which we term EPOSs CRS, as the definition relying on subjective symptoms). However, EPOS does not specify how to measure symptoms in terms of severity (e.g., partial or complete blockage or smell loss, quantity of discharge) or frequency (e.g., some, most, or all of the time) during the required three-month duration.
Current guidelines for CRS primarily divide CRS into one of two primary phenotypes, based on the presence or absence of nasal polyps. However, increasing evidence reveals that CRS is likely much more heterogeneous, with endotypes that are defined by distinct pathophysiologic mechanisms that can be characterized by differences in responses to different treatment options [6]. These endotypes may present with heterogeneous patterns of sinonasal symptoms that could be used in clinical settings to inform targeted treatment strategies. However, to date, the ways in which sinonasal and related symptoms co-occur remain relatively unexplored [7–9].
Incorporating a large, prospective longitudinal cohort of subjects from Geisinger, an integrated health system, we used exploratory factor analysis (EFA) to assess the existence and structure of latent constructs (as yet unidentified subject attributes driving manifestation of symptoms) of sinonasal and other relevant symptoms. EFA was applied to symptoms at three separate time points over 16 months and the change in symptoms between time points. Prior studies have used EFA applied to CRS symptoms at one point in time, but utilized the Sino-nasal Outcome Test (SNOT) family of questionnaires, designed to assess treatment effectiveness among subjects known to have CRS [2, 10, 11]. SNOT assesses symptom severity only in a two-week recall window, so it cannot be used to evaluate compliance with EPOS duration criteria, and does not evaluate symptom frequency [1, 11]. The questionnaire utilized in this study assessed frequency, bother and severity of cardinal EPOS symptoms and related and comorbid symptoms (e.g., ear, eye, allergy, asthma, headache, fatigue, cold, flu), to assess a broad range of manifestations potentially associated with sinonasal disease. Understanding how symptoms group together and change over time may allow development of more precise approaches to symptom measurement and help identify biologic rationales for clustered symptoms. To our knowledge this is the first use of EFA applied to longitudinal information on a broad range of symptoms relevant to sinonasal disease in a sample representative of the general population.
Methods
Study population and design
A total of 200,769 Geisinger primary care patients over the age of 18 years were eligible for participation. From these subjects, 23,700 were chosen to receive longitudinal questionnaires in the mail utilizing a previously reported sampling scheme [12, 13] which oversampled both racial/ethnic minorities as well as those with higher likelihoods of CRS using International Classification of Diseases (ICD-9) and Current Procedural Terminology codes in electronic health record (EHR) data [12, 13]. Participants who returned the baseline questionnaire were followed for 16 months. Non-responders were sent questionnaires one or two additional times. A total of 7834, 4945, and 4584 subjects returned the baseline (April 2014), six-month (October 2014), and 16-month (August 2015) questionnaires, respectively, and had answered a sufficient number of the questions of interest as described below.
Data collection
The questionnaires included items on presence, frequency, severity, and bother of a range of symptoms associated with sinonasal disease and comorbid conditions (Online Supplement Table S1) [12–14]. Each questionnaire included 37 questions in common with the same response options (how often the symptom occurred in the past three months as 1 = never, 2 = once in a while, 3 = some of the time, 4 = most of the time, or 5 = all the time; Online Supplement Table S1). A total of 21 questions were about the presence, severity, and degree of bother of sinonasal symptoms; while the remaining questions assessed presence of four asthma symptoms, four allergy symptoms, three ear symptoms, and five cold/flu symptoms and other related symptoms (Online Supplement Table S1).
Analytic variables
EPOSs criteria were used to classify subjects as current, past, or never CRS based on self-reported current and past symptoms from the baseline questionnaire as previously reported [13]. The questionnaire has been previously described [13], and included sociodemographic items at baseline. Health information such as body mass index (BMI, measured in kg/m2) was derived from EHR data and linked to questionnaire data.
Statistical analysis
Overview
The goals of the analysis were to identify the latent constructs and their underlying structure, if present, among the 37 questions at each questionnaire time point, and then among the change in these symptoms over time from adjacent questionnaires (i.e., baseline to six-month, six-month to 16-month). The analysis included the 3535 subjects who returned all three questionnaires with no more than five missing values for the 37 questions for any single questionnaire. We did not want to impute values for subjects with many missing questions since the primary goal of the analysis was to evaluate the underlying latent structure of the patterns of symptom reporting. For subjects with five or fewer missing values, which we assumed to be at random, multivariate imputation by chained equations was conducted via the mice R package using the predictive mean matching (PMM) method [15] to impute missing values (approximately 3.5% of values) utilizing only information within each questionnaire. Once data were finalized for each questionnaire, two change scores were calculated as the difference between each person’s adjacent questionnaires.
Exploratory factor analysis
Subjects included in the analysis were first compared to subjects not included on demographic, health, and socioeconomic variables to evaluate selection bias. EFA was next utilized to evaluate the latent constructs and underlying structure of symptom reporting because there were multiple hypotheses and little a priori knowledge of how symptoms might cluster. Implied Pearson (polychoric) correlations were estimated among the 37 questions for the three cross-sectional questionnaires, using the two-step procedure as implemented by the psych R package [16]. These correlations were then utilized in the EFAs. Pearson correlation matrices were calculated for each of the two change scores as the difference score distribution appeared symmetric and contained more values than practical for polychoric correlations.
Factor scores and communalities
Each of the five EFAs was conducted fitting loadings estimates and communalities applying the ordinary (unweighted) least squares (OLS/ULS) procedure to correlations estimated as previously described. We used an oblimin rotation for each EFA to allow factors to be correlated [16]. The number of factors to extract was determined through Cattell’s scree test and parallel analysis [17, 18]. Factor loadings (values generally ranging from −1 to 1) provide a measure of the strength of the relationship between each question and each of the extracted factors, while the communalities for each question, which range from 0 to 1, are interpreted as the fraction of each question’s variability that is explained by the factor model.
Once factor loadings were extracted, item response theory (IRT) scores were estimated for each identified factor for each subject using the polytomous items from each of the questionnaires [19]. These estimated scores were computed as a measure of the strength of each latent factor for each subject. A factor score correlation matrix was first examined to evaluate correlations among the five factors. Lasagna plots were examined in order to visually assess the changes in quintiles of factor scores over time [20].
We next evaluated factor scores by EPOSs CRS status groups (current, past, never). For the four factor scores with approximately normal distributions, we used a multivariate analysis of variance (MANOVA) to compare all four at once between EPOSs CRS status groups (MANOVA models what is equivalent to the mean multivariate factor score). The smell loss factor score had a mixed-scale distribution, with many subjects having a value at the lower bound and the remaining individuals distributed relatively uniformly across higher values. Logistic and linear regression models were used to evaluate associations of EPOSs CRS status with the lower bound factor score and higher scores, respectively. Finally, we evaluated whether the first factor change score, over six months, captured more variability in symptoms than the second change score, over 10 months, by comparing EFA communalities using a Wilcoxon signed rank test. We hypothesized that models would explain more variation in symptoms, and thus have higher mean communality values, for the first change score because of the shorter duration for change.
Diagnostics and sensitivity analysis
Extensive diagnostics and sensitivity analyses were completed to confirm the fit and adequacy of EFA models, and the sensitivity of results to factoring method and imputation (described in Online Supplement).
Results
Description of study subjects
The 3535 subjects included in the analysis were first compared to the 4312 respondents from the baseline questionnaire excluded from analysis (Table 1). The two groups were similar on sex distribution (37.8% vs. 36.9% male) and BMI (mean 30.0 vs. 30.3 kg/m2). However, subjects differed on a number of other study variables, including age (mean 57.5 vs. 53.2 years), race/ethnicity (94.0% vs. 87.5% white), and socioeconomic status (32.9% vs. 25.1% earned over $50,000 annually).
Table 1.
Demographic information of the 4312 subjects who returned the baseline questionnaire but were not included and the 3535 subjects who were included in the analysis.
| Variable | Excluded from analysis |
Included in analysis |
|---|---|---|
| Male, n (%) | 1591 (36.9) | 1335 (37.8) |
| Age, years, mean (SD) | 53.2 (16.8) | 57.5 (14.8) |
| Smoking status | ||
| Never, n (%) | 2253 (52.2) | 2053 (58.1) |
| Former, n (%) | 1299 (30.1) | 1100 (31.1) |
| Current, n (%) | 760 (17.6) | 382 (10.8) |
| Income: | ||
| < $25,000, n (%) | 1599 (37.1) | 1021 (28.9) |
| $25,000-$50,000, n (%) | 1098 (25.5) | 970 (27.4) |
| > $50,000, n (%) | 1083 (25.1) | 1163 (32.9) |
| Body mass index, kg/m2, mean (SD) | 30.3 (7.05) | 30.0 (6.93) |
| Education level | ||
| High school, n (%) | 1608 (37.3) | 1209 (34.2) |
| Some college, n (%) | 1364 (31.6) | 979 (27.7) |
| College graduate, n (%) | 977 (22.7) | 1171 (33.1) |
| Race/ethnicity | ||
| White, n (%) | 3372 (87.5) | 3323 (94) |
| Black, n (%) | 264 (6.1) | 78 (2.2) |
| Hispanic, n (%) | 276 (6.4) | 134 (3.8) |
Across questionnaires, it was common for symptoms to change by one frequency category, with relatively few subjects changing by two or more (e.g., results for blockage frequency in Figure 1). For blockage frequency, the majority of those who answered “never” having blockage in the previous three months at baseline also reported infrequent blockage at follow-up. Similar patterns of change were observed among subjects who were in other categories of blockage frequency reporting at baseline. This overall pattern of symptom reporting across questionnaires was evident for other symptom questions as well (results not shown).
Figure 1.
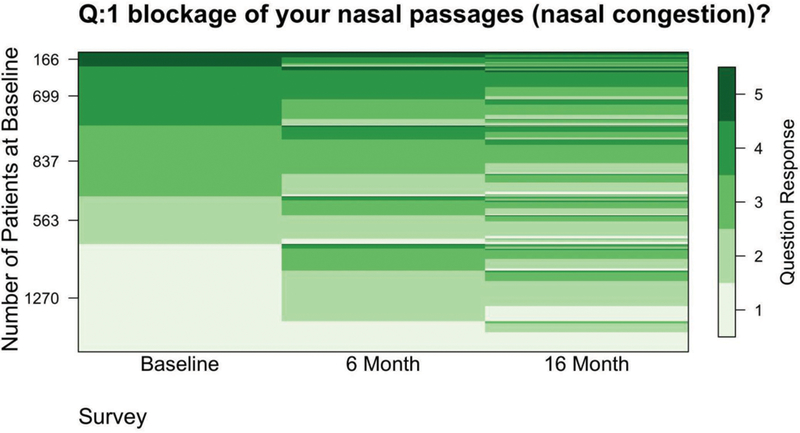
Lasagna plot displaying the proportion of individuals with each given response to the question “On average, how often in the past 3 months have you had post-nasal drip?” at baseline and 6 months and 16 months later (1 = never, 2 = once in a while, 3 = some of the time, 4 = most of the time, 5 = all the time). Y-axis values indicate the number of subjects with specific responses at baseline.
Cross-sectional EFAs
For each of the three cross-sectional EFAs, scree plots supported the extraction of five factors (Online Supplement Figures S1 to S3). Parallel analysis suggested the retention of five factors for baseline and six-month questionnaires and six factors for the 16-month follow up. For ease of comparability, five factors were extracted from each of the questionnaires. Each of the structures and the interpretation of the five factors in these three EFAs were similar: one factor each for symptoms of blockage and discharge; pain and pressure (including headache); asthma and cold/flu symptoms; ear and eye; and smell loss (Table 2 for baseline EFA, other two cross-sectional EFAs in Online Supplement Tables S2 and S3). Factor loadings (the degree to which specific question was related to latent factor) were consistent across all questionnaires (Tables 2 and S2 and S3). Most observed communalities were high, indicating that the factor models well-represented questions included in the analysis (Tables 2 and S2 and S3). A few low communalities were observed (e.g., bad breath [0.26], fever [0.34], cold/flu symptoms [0.37], fatigue [0.39]), suggesting that the model did not account for much of the variability in these symptoms.
Table 2.
Factor loadings and symptom communalities from the exploratory factor analysis (EFA)* of 37 questions about the presence, frequency, and severity of sinonasal and related symptoms on the baseline questionnaire from 3535 subjects.
| Factor | |||||||
|---|---|---|---|---|---|---|---|
| # | Item label | 1 | 2 | 3 | 4 | 5 | Communalities |
| 1 | Blockage | 0.65 | 0.80 | ||||
| 2 | Discharge discolored | 0.49 | 0.61 | ||||
| 3 | PND | 0.84 | 0.78 | ||||
| 4 | Smell loss | 0.95 | 0.89 | ||||
| 5 | Facial pain | 0.83 | 0.85 | ||||
| 6 | Facial pressure | 0.76 | 0.87 | ||||
| 7 | Blockage both sides | 0.58 | 0.72 | ||||
| 8 | Blockage complete | 0.55 | 0.73 | ||||
| 9 | Blockage bothered | 0.61 | 0.81 | ||||
| 10 | Discharge a lot | 0.86 | 0.84 | ||||
| 11 | Blow nose 10x daily | 0.82 | 0.76 | ||||
| 12 | Discharge bothered | 0.84 | 0.84 | ||||
| 13 | Cough lie down | 0.72 | 0.73 | ||||
| 14 | Lump in throat | 0.69 | 0.73 | ||||
| 15 | PND bothered | 0.84 | 0.85 | ||||
| 16 | Smell loss complete | 0.97 | 0.95 | ||||
| 17 | Smell loss bothered | 0.92 | 0.91 | ||||
| 18 | Facial pain 5+ | 0.83 | 0.90 | ||||
| 19 | Facial pain bothered | 0.84 | 0.91 | ||||
| 20 | Facial pressure severe | 0.77 | 0.86 | ||||
| 21 | Facial pressure bothered |
0.78 | 0.90 | ||||
| 22 | Headaches | 0.67 | 0.48 | ||||
| 23 | Fever | 0.43 | 0.34 | ||||
| 24 | Coughing | 0.46 | 0.50 | 0.53 | |||
| 25 | Bad breath | 0.26 | |||||
| 26 | Fatigue | 0.39 | |||||
| 27 | Nasal itching | 0.56 | 0.53 | ||||
| 28 | Sneezing | 0.31 | 0.54 | 0.51 | |||
| 29 | Eye itching | 0.72 | 0.62 | ||||
| 30 | Eye tearing | 0.60 | 0.49 | ||||
| 31 | Ear fullness | 0.35 | 0.54 | 0.62 | |||
| 32 | Ear pain | 0.51 | 0.49 | 0.65 | |||
| 33 | Ear pressure | 0.47 | 0.46 | 0.63 | |||
| 34 | Wheezing | 0.80 | 0.66 | ||||
| 35 | Chest tightness | 0.85 | 0.78 | ||||
| 36 | Shortness of breath | 0.82 | 0.68 | ||||
| 37 | Cold/flu symptoms | 0.44 | 0.37 | ||||
The EFA was fit using ordinary least squares and an oblimin rotation. Loadings less than 0.3 were omitted for readability. Communalities represent the fraction of each symptom’s variability that was captured by the utilized five factor model.
Longitudinal difference EFAs
The two longitudinal difference EFAs also supported five factor models (scree plots in Online Supplement Figures S4 and S5). Symptoms identified to load on single factors in the difference analyses indicated that these symptoms changed together and in the same direction over time. Notably, both difference EFAs yielded nearly identical factors and structures (Tables 3 and S4) to the cross-sectional EFAs. As expected, given the shorter duration for change, the baseline to six-month difference EFA had a significantly greater average communality than did the six-month to 16-month difference EFA (p-value = 0.002 from Wilcoxon signed rank test; Online Supplement Table S5).
Table 3.
Factor loadings and symptom communalities from the exploratory factor analysis (EFA)* of change in responses from the six- to 16-month questionnaire on 37 questions about the presence, frequency, and severity of sinonasal and related symptoms from 3535 subjects.
| # | Item Label | Factor | Communalities | ||||
|---|---|---|---|---|---|---|---|
| 1 | 2 | 3 | 4 | 5 | |||
| 1 | Blockage | 0.46 | 0.30 | ||||
| 2 | Discharge discolored | 0.32 | 0.19 | ||||
| 3 | PND | 0.49 | 0.28 | ||||
| 4 | Smell loss | 0.68 | 0.47 | ||||
| 5 | Facial pain | 0.66 | 0.47 | ||||
| 6 | Facial pressure | 0.59 | 0.41 | ||||
| 7 | Blockage both sides | 0.43 | 0.28 | ||||
| 8 | Blockage complete | 0.34 | 0.23 | ||||
| 9 | Blockage bothered | 0.52 | 0.40 | ||||
| 10 | Discharge a lot | 0.72 | 0.50 | ||||
| 11 | Blow nose 10x daily | 0.66 | 0.43 | ||||
| 12 | Discharge bothered | 0.75 | 0.54 | ||||
| 13 | Cough lie down | 0.34 | 0.33 | 0.29 | |||
| 14 | Lump in throat | 0.36 | 0.27 | ||||
| 15 | PND bothered | 0.57 | 0.40 | ||||
| 16 | Smell loss complete | 0.84 | 0.69 | ||||
| 17 | Smell loss bothered | 0.68 | 0.48 | ||||
| 18 | Facial pain 5+ | 0.78 | 0.60 | ||||
| 19 | Facial pain bothered | 0.79 | 0.63 | ||||
| 20 | Facial pressure severe | 0.65 | 0.44 | ||||
| 21 | Facial pressure bothered |
0.72 | 0.54 | ||||
| 22 | Headaches | 0.14 | |||||
| 23 | Fever | 0.10 | |||||
| 24 | Coughing | 0.42 | 0.29 | ||||
| 25 | Bad breath | 0.12 | |||||
| 26 | Fatigue | 0.12 | |||||
| 27 | Nasal itching | 0.35 | 0.19 | ||||
| 28 | Sneezing | 0.38 | 0.25 | ||||
| 29 | Eye itching | 0.50 | 0.29 | ||||
| 30 | Eye tearing | 0.51 | 0.30 | ||||
| 31 | Ear fullness | 0.64 | 0.41 | ||||
| 32 | Ear pain | 0.53 | 0.33 | ||||
| 33 | Ear pressure | 0.63 | 0.39 | ||||
| 34 | Wheezing | 0.58 | 0.33 | ||||
| 35 | Chest tightness | 0.64 | 0.40 | ||||
| 36 | Shortness of breath | 0.60 | 0.37 | ||||
| 37 | Cold/flu symptoms | 0.35 | 0.24 | ||||
EFA was fit using ordinary least squares and an oblimin rotation. Loadings less than 0.3 were omitted for readability. Communalities represent the fraction of each symptom’s variability that was captured by the utilized five factor model.
Factor scores
Using the baseline model to estimate factor scores within individuals at baseline, correlations among the five factor scores ranged from 0.30 to 0.64. The highest inter-factor correlations were observed between the blockage and discharge factor with the pain and pressure factor (ρ = 0.64) and the smell loss factor (ρ = 0.61; Online Supplement Figure S6). There was a significant difference (p-value < 0.001) in mean factor scores for factors 1, 2, 3, and 5 between EPOSs CRS groups (current, past, never; Figure 2 for factor 1). We observed factor scores were higher, in descending order, for current, past, then never CRS groups. Examination of factor scores across questionnaires (categorized values in Figure 3 for factor 1) showed that there was change in factor scores over time. Logistic and linear regression models revealed that EPOSs CRS status was positively associated with smell loss (factor 4) scores. Current and past EPOSs CRS at baseline (vs. never) were associated with a much lower odds of having low factor scores (odds ratios [95% CI] = 0.05 [0.04, 0.06] and 0.15 [0.12, 0.18], respectively). For those above the lower bound score, subjects with current and past EPOSs CRS at baseline (vs. never) had higher factor scores, with a mean (95% CI) factor 4 score of 0.48 (0.35, 0.60) and 0.22 (0.10, 0.34), respectively.
Figure 2.
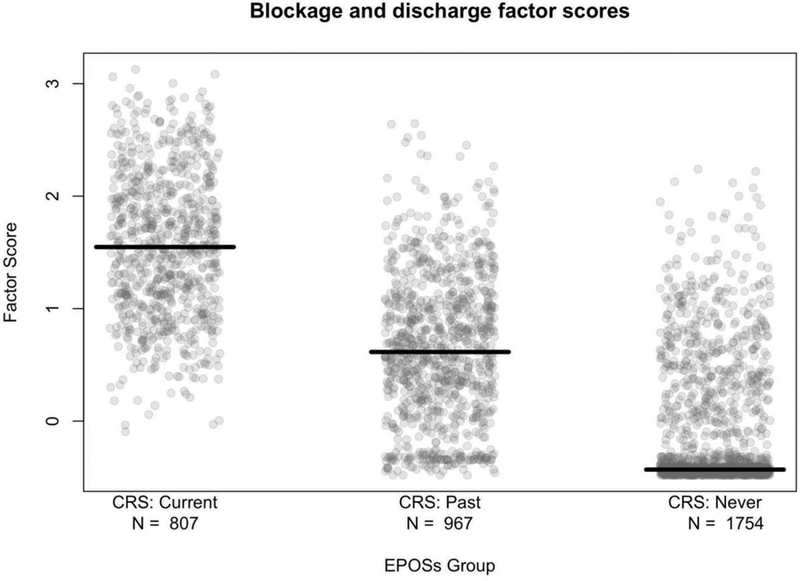
Factor 1 (blockage and discharge) scores by EPOSs CRS groups (current, past, never) at baseline. The number of subjects in each group is indicated. Factor scores were estimated by the item response theory (IRT) method. The X-axis was jittered to improve readability.
Figure 3.
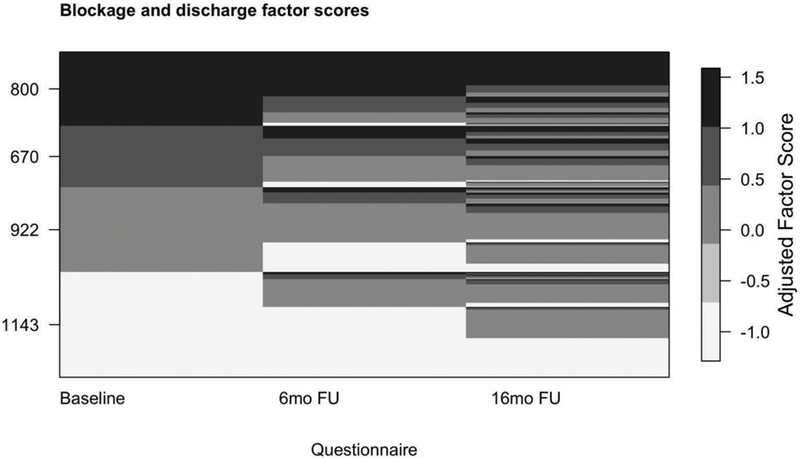
Continuous factor scores categorized to show longitudinal change across questionnaires for factor 1 (blockage and discharge). Factor scores were categorized as: factor score < −0.4 were assigned values of −1; between −0.4 and 0.6, assigned 0; between 0.6 and 1.2, assigned 1; and > 1.2, assigned 1.3. The Y-axis labels indicate the number of subjects at baseline in each adjusted factor score group. Factor scores were estimated by the item response theory (IRT) method.
Discussion
EFA was used to better understand the existence and structure of latent constructs underlying symptoms which have been traditionally categorized as major and minor CRS symptoms [21] as well as symptoms associated with CRS co-morbidities. Notably, this was performed in a general population representative sample utilizing both cross-sectional symptom questionnaires and changes in symptom responses over time. The analysis of sinonasal, asthma, headache, cold/flu, allergy, and ear symptoms identified five factors (i.e., symptom clusters representing latent constructs) that were similar in all three cross-sectional and two difference analyses, despite some change in symptoms over time. The five factors were blockage and discharge; pain and pressure; asthma and cold/flu; smell loss; and ear and eye symptoms (mainly allergy). All five factor scores were highest in subjects who met EPOSs current CRS criteria and lowest in those who met EPOSs never CRS criteria. Understanding how symptoms cluster within and across questionnaires can provide useful information that can aid clinical practice, inform symptom measurement in CRS, and lead to hypotheses about the pathobiology underlying these clusters.
In EPOS guidelines, the six symptoms we measured are reduced to four as anterior and posterior discharge and pain and pressure are combined. EPOS considers these four cardinal symptoms to be mainly interchangeable, with one required symptom (one of the three blockage or discharge symptoms) and one other symptom to meet EPOS criteria. If there was an underlying construct of CRS that could be measured with the cardinal symptoms, the EPOS criteria suggest symptoms should only load on one or two factors. We subjected a larger group of 37 symptom questions, encompassing common sinonasal and co-morbid condition symptoms, and expanded to evaluate how severity, bother, or frequency influenced clustering. The results suggested that frequency, severity, and bother were all important to clustering of symptoms within factors. EPOS allows either blockage or discharge to be a separate required symptom, but we found that all 12 blockage and discharge questions loaded on a single factor, suggesting these symptoms do not occur independently of one another. We found that the 37 symptoms identified five factors and the six EPOS CRS symptoms clustered in three factors (i.e., nasal blockage and discharge, facial pain and pressure, and smell loss), in all five EFAs. Most questionnaire responses were well-represented by the observed factor models as indicated by relatively high communality values.
While there was some longitudinal change in symptom reporting, large transitions (two or more steps on the Likert scale) were not very common. However, this could still result in large differences in proportions meeting EPOSs criteria for CRS over time and lead to misclassification of CRS status when symptoms are assessed at cross-section. For example, we have previously reported that, among subjects who met EPOSs current CRS at baseline, almost half did not meet criteria for current CRS six months later [14]. The latent constructs, however, were stable over time. Prevalence estimates around the world range from 5.5% to 15% [22–24] and differences may be partially attributable to differences in when and how EPOSs criteria are operationalized (i.e., symptoms assessed via Likert scale versus a binary measure of symptom presence or absence), as some methods may be more or less sensitive to the variability of symptoms over time. A standard approach to measuring symptoms in epidemiologic studies using EPOSs criteria is required to understand differences across studies and populations.
There has been increasing recognition of the heterogeneity of CRS with a focus on multiple groups of endotypes [6, 25]. An important question is whether the clustering of symptoms we observed represents one or more endotypes with distinct underlying pathobiologic processes or anatomic relationships. In a prior study we found that similar distinct sinonasal symptom patterns within individuals meeting EPOSs differed by age, sex, selected risk factors, and health outcomes, providing some evidence that CRS symptom subgroups may represent distinct disease processes [13]. The ability to use symptoms to identify subtypes of CRS, that might differ by inflammatory processes, location of sinus opacification, and co-morbidities, for example, has important implications for targeted treatment of the disease.
The consistency of the five factors in all five EFA models, despite the presence of some longitudinal change in symptoms, also provides some evidence that these five factors may each have an underlying pathobiology. EFA theory hypothesizes that there are real underlying mechanisms, including common pathobiology or reporting phenomena, which manifests in clustering of symptoms into observed factors. If this hypothesis was correct, we would expect factor composition to be invariant to time (i.e., within questionnaires, no seasonality); and to see symptoms cluster over time according to these same factors. Our observed results supported both of these expectations.
Analysis of multidimensional mean factor scores showed that EPOSs current CRS had the highest factor scores, followed by the past CRS group (p-values < 0.01). This result is unsurprising since the CRS groups here were determined by the EPOSs definition, which itself is based on many of the symptoms in the factors; however, the EFA included many questions beyond those used to define EPOSs CRS status. The factor scores comprised of eye, ear, asthma, cold/flu, and headache symptoms may represent the common co-occurrence of allergy, asthma, and headache disorders, for example, among patients with sinonasal disease.
While there has been some prior work on CRS symptom factors at a single point in time with the SNOT-20 and SNOT-22 questionnaires, prior work on factors using longitudinal information on symptoms has generally focused on the impact of treatment [10, 26]. The SNOT questionnaires using 20 or 22 Likert-scale questions ask the participants to consider physical, functional, and emotional symptoms in the previous two weeks [27, 28]. SNOT was designed to provide a single measure of patient quality of life and CRS-related symptom severity, implicitly suggesting that the combined questions provide information regarding a single CRS construct or factor [10]. However, prior studies of SNOT-20 or 22 found four or five factors like rhinologic symptoms, extranasal rhinologic symptoms, ear and facial symptoms, psychological dysfunction, and sleep dysfunction implying a variety of unobserved underlying factors [10, 27, 29]. The difference in symptom duration between SNOT and our questionnaire might explain the absence of latent constructs within the rhinologic symptoms in SNOT.
We observed differences between subjects included and excluded from the analysis. Included subjects were more likely to be white, more highly educated, and have higher incomes. This may have resulted in selection bias that could have influenced the results. In addition, there is the potential of same source bias impacting results by which some individuals report in a systemic manner (e.g. always or never reporting symptoms, or more likely to report symptoms located near each other on the questionnaire with the same response item). Finally, while we found strong evidence of clustering among 37 symptoms within visits and over time, the ultimate utility of the findings will be in whether these five factors identify unique CRS subgroups (new approaches to phenotypes, or combined with molecular measurements into endotypes) that predict natural history, response to treatment, or long-term outcomes.
Conclusions
In an analysis of 37 sinonasal, allergy, ear, asthma, headache, and cold/flu symptoms, we identified five underlying factors – blockage and discharge, pain and pressure, asthma and cold/flu, ear and eye, and smell loss – that were very consistent in three cross-sectional and two longitudinal change EFAs. Questions assessed presence, severity, bother, and frequency of all 37 symptoms. Frequency, severity, and degree of bother were each important to clustering of symptoms within factors and this clustering within factors was stable over time. The findings have implications for how to measure sinonasal symptoms in epidemiologic studies of CRS and possibly in the clinical setting too (e.g., EPOS criteria). Future consideration should be given to whether and how to incorporate frequency and severity into symptom measurement to optimize diagnosis and care for patients with nasal and sinus symptoms.
Supplementary Material
HIGHLIGHTS.
Exploratory factor analysis of 37 symptom questions from three questionnaires obtained from 3535 subjects over 16 months consistently identified five symptom factors.
The five symptom factors – blockage and discharge, pain and pressure, asthma and cold/flu symptoms, smell loss, and ear and eye (mainly allergy) symptoms – were present in cross-sectional and longitudinal analyses.
The findings suggest that current approaches to symptom measurement in CRS should be reconsidered, and frequency and severity of symptoms should be incorporated.
Acknowledgments
Funding: This publication was supported by the Chronic Rhinosinusitis Integrative Studies Program grant U19AI106683 from the NIH. The study sponsor did not play a role in the study design, analysis, interpretation, or writing of the report and did not take part in the decision to submit this article for publication.
ABBREVIATIONS
- BMI
body mass index
- CRS
chronic rhinosinusitis
- CT
computerized tomography
- EFA
exploratory factor analyses
- EHR
electronic health record
- EPOS
European Position Paper on Rhinosinusitis and Nasal Polyps
- EPOSs
EPOS epidemiologic definition of CRS based on presence and duration of symptoms only
- ICD-9
International Classification of Diseases
- IRT
item response theory
- KMO
Kaiser-Meyer-Olkin
- MANOVA
multivariate analysis of variance
- OLS
ordinary least squares
- PMM
predictive mean matching
- SNOT
Sino-nasal Outcome Test
- ULS
unweighted least squares
Footnotes
Conflict of interest statement: All authors report no conflicts of interest.
References
- 1.Fokkens WJ, et al. , EPOS 2012: European position paper on rhinosinusitis and nasal polyps 2012. A summary for otorhinolaryngologists. Rhinology, 2012. 50(1): p. 1–12. [DOI] [PubMed] [Google Scholar]
- 2.Hopkins C, et al. , The Lund-Mackay staging system for chronic rhinosinusitis: how is it used and what does it predict? Otolaryngol Head Neck Surg, 2007. 137(4): p. 555–61. [DOI] [PubMed] [Google Scholar]
- 3.Tan BK, et al. , Chronic rhinosinusitis: the unrecognized epidemic. Am J Respir Crit Care Med, 2013. 188(11): p. 1275–7. [DOI] [PMC free article] [PubMed] [Google Scholar]
- 4.Rosenfeld RM, et al. , Clinical practice guideline (update): adult sinusitis. Otolaryngol Head Neck Surg, 2015. 152(2 Suppl): p. S1–S39. [DOI] [PubMed] [Google Scholar]
- 5.Orlandi RR, et al. , International Consensus Statement on Allergy and Rhinology: Rhinosinusitis. Int Forum Allergy Rhinol, 2016. 6 Suppl 1: p. S22–209. [DOI] [PubMed] [Google Scholar]
- 6.Akdis CA, et al. , Endotypes and phenotypes of chronic rhinosinusitis: a PRACTALL document of the European Academy of Allergy and Clinical Immunology and the American Academy of Allergy, Asthma & Immunology. J Allergy Clin Immunol, 2013. 131(6): p. 1479–90. [DOI] [PMC free article] [PubMed] [Google Scholar]
- 7.Greguric T, et al. , Association between computed tomography findings and clinical symptoms in chronic rhinosinusitis with and without nasal polyps. Eur Arch Otorhinolaryngol, 2017. 274(5): p. 2165–2173. [DOI] [PubMed] [Google Scholar]
- 8.Sedaghat AR, et al. , Clustering of chronic rhinosinusitis symptomatology reveals novel associations with objective clinical and demographic characteristics. Am J Rhinol Allergy, 2015. 29(2): p. 100–5. [DOI] [PubMed] [Google Scholar]
- 9.Gudziol V, et al. , Olfaction and sinonasal symptoms in patients with CRSwNP and AERD and without AERD: a cross-sectional and longitudinal study. Eur Arch Otorhinolaryngol, 2017. 274(3): p. 1487–1493. [DOI] [PubMed] [Google Scholar]
- 10.Browne JP, et al. , The Sino-Nasal Outcome Test (SNOT): can we make it more clinically meaningful? Otolaryngol Head Neck Surg, 2007. 136(5): p. 736–41. [DOI] [PubMed] [Google Scholar]
- 11.Hopkins C, et al. , Psychometric validity of the 22-item Sinonasal Outcome Test. Clin Otolaryngol, 2009. 34(5): p. 447–54. [DOI] [PubMed] [Google Scholar]
- 12.Tustin AW, et al. , Associations between Unconventional Natural Gas Development and Nasal and Sinus, Migraine Headache, and Fatigue Symptoms in Pennsylvania. Environ Health Perspect, 2017. 125(2): p. 189–197. [DOI] [PMC free article] [PubMed] [Google Scholar]
- 13.Hirsch AG, et al. , Nasal and sinus symptoms and chronic rhinosinusitis in a population-based sample. Allergy, 2017. 72(2): p. 274–281. [DOI] [PMC free article] [PubMed] [Google Scholar]
- 14.Sundaresan AS, et al. , Longitudinal Evaluation of Chronic Rhinosinusitis Symptoms in a Population-based Sample. J Allergy Clin Immunol Pract, 2017. [DOI] [PMC free article] [PubMed]
- 15.van Buuren S and Groothuis-Oudshoom K, mice: Multivariate imputation by chained equations in R. J Statistical Software, 2011. 45(3): p. 1–67. [Google Scholar]
- 16.Revelle W psych: Procedures for psychological, psychometric, and personality research 2017. September 27, 2017]; Available from: https://CRAN.R-project.org/package=psych. [Google Scholar]
- 17.Cattell RB, The Scree Test For The Number Of Factors. Multivariate Behav Res, 1966. 1(2): p. 245–76. [DOI] [PubMed] [Google Scholar]
- 18.Gorsuch RL, Factor analysis 2nd ed1983, Hillsdale, N.J.: L. Erlbaum Associates; xvii, 425 p. [Google Scholar]
- 19.Kamata A and Bauer DJ, A note on the relation between factor analytic and item response theory. Structural Equation Modeling-a Multidisciplinary Journal, 2008. 15(1): p. 136–153. [Google Scholar]
- 20.Swihart BJ, et al. , Lasagna plots: a saucy alternative to spaghetti plots. Epidemiology, 2010. 21(5): p. 621–5. [DOI] [PMC free article] [PubMed] [Google Scholar]
- 21.Benninger MS, et al. , Adult chronic rhinosinusitis: definitions, diagnosis, epidemiology, and pathophysiology. Otolaryngol Head Neck Surg, 2003. 129(3 Suppl): p. S1–32. [DOI] [PubMed] [Google Scholar]
- 22.Pilan RR, et al. , Prevalence of chronic rhinosinusitis in Sao Paulo. Rhinology, 2012. 50(2): p. 129–38. [DOI] [PubMed] [Google Scholar]
- 23.Shi JB, et al. , Epidemiology of chronic rhinosinusitis: results from a cross-sectional survey in seven Chinese cities. Allergy, 2015. 70(5): p. 533–9. [DOI] [PMC free article] [PubMed] [Google Scholar]
- 24.Hastan D, et al. , Chronic rhinosinusitis in Europe--an underestimated disease. A GA(2)LEN study. Allergy, 2011. 66(9): p. 1216–23. [DOI] [PubMed] [Google Scholar]
- 25.Steinke JW and Borish L, Chronic rhinosinusitis phenotypes. Ann Allergy Asthma Immunol, 2016. 117(3): p. 234–40. [DOI] [PMC free article] [PubMed] [Google Scholar]
- 26.Soler ZM, et al. , Cluster analysis and prediction of treatment outcomes for chronic rhinosinusitis. J Allergy Clin Immunol, 2016. 137(4): p. 1054–1062. [DOI] [PMC free article] [PubMed] [Google Scholar]
- 27.DeConde AS, et al. , Response shift in quality of life after endoscopic sinus surgery for chronic rhinosinusitis. JAMA Otolaryngol Head Neck Surg, 2014. 140(8): p. 712–9. [DOI] [PMC free article] [PubMed] [Google Scholar]
- 28.Hopkins C, et al. , The national comparative audit of surgery for nasal polyposis and chronic rhinosinusitis. Clin Otolaryngol, 2006. 31(5): p. 390–8. [DOI] [PubMed] [Google Scholar]
- 29.DeConde AS, et al. , SNOT-22 quality of life domains differentially predict treatment modality selection in chronic rhinosinusitis. Int Forum Allergy Rhinol, 2014. 4(12): p. 972–9. [DOI] [PMC free article] [PubMed] [Google Scholar]
Associated Data
This section collects any data citations, data availability statements, or supplementary materials included in this article.