

Abstract
Mutations in the ectodysplasin A gene (EDA) cause X-LHED (X-linked hypohidrotic ectodermal dysplasia), the most common human form of ectodermal dysplasia. Defective EDA signaling is linked to hypoplastic development of epithelial tissues, resulting in hypotrichosis, hypodontia, hypohidrosis, and xerostomia. The primary objective of the present study was to better understand the salivary gland dysfunction associated with ectodermal dysplasia using the analogous murine disorder. The salivary flow rate and ion composition of the 3 major salivary glands were determined in adult Eda-deficient Tabby hemizygous male (Ta/Y) and heterozygous female (Ta/X) mice. Submandibular and sublingual glands of Eda-mutant mice were smaller than wild-type littermates, while parotid gland weight was not significantly altered. Fluid secretion by the 3 major salivary glands was essentially unchanged, but the decrease in submandibular gland size was associated with a dramatic loss of ducts in Ta/Y and Ta/X mice. Reabsorption of Na+ and Cl–, previously linked in salivary glands to Scnn1 Na+ channels and Cftr Cl- channels, respectively, was markedly reduced at high flow rates in the ex vivo submandibular glands of Ta/Y mice (~60%) and, to a lesser extent, Ta/X mice (Na+ by 14%). Consistent with decreased Na+ reabsorption in Ta/Y mice, quantitative polymerase chain reaction analysis detected decreased mRNA expression for Scnn1b and Scnn1g, genes encoding the β and γ subunits, respectively. Moreover, the Na+ channel blocker amiloride significantly inhibited Na+ and Cl– reabsorption by wild-type male submandibular glands to levels comparable to those observed in Ta/Y mice. In summary, fluid secretion was intact in the salivary glands of Eda-deficient mice but displayed marked Na+ and Cl– reabsorption defects that correlated with the loss of duct cells and decreased Scnn1 Na+ channel expression. These results provide a likely mechanism for the elevated NaCl concentration observed in the saliva of affected male and female patients with X-LHED.
Keywords: hidrotic ectodermal dysplasia, salivary glands, Scnn1, epithelial sodium channels, cystic fibrosis transmembrane conductance regulator, fluids and secretions
Introduction
Patients with hypohidrotic ectodermal dysplasia (HED) typically present with sparse hair, missing teeth, exocrinopathies of sweat and salivary glands, and craniofacial dysmorphologies (Pinheiro and Freire-Maia 1994; Priolo and Lagana 2001; Itin and Fistarol 2004; Visinoni et al. 2009). X-linked HED (X-LHED), the most common form of HED, is caused by EDA (ectodysplasin A) gene mutations (Kere et al. 1996; Martinez et al. 1999). Clinical studies reported that patients with X-LHED have decreased saliva production and increased salivary NaCl content (Nordgarden et al. 2003; Lexner et al. 2007). Like EDA mutations in humans, Tabby X-LHED mice present an analogous murine Eda-deficiency disorder (Ferguson et al. 1997; Srivastava et al. 1997). The submandibular salivary glands of Tabby X-LHED mice exhibit less branching morphogenesis, consistent with the essential role of Eda in embryonic salivary gland development (Jaskoll et al. 2003; Melnick et al. 2009; Haara et al. 2011). Moreover, perinatal treatment of Tabby mice with recombinant Eda protein rescues the X-LHED phenotype, including restoration of sweat gland, hair, teeth, and salivary glands (Gaide and Schneider 2003; Jaskoll et al. 2003; Wells et al. 2010).
The compromised salivary gland development associated with EDA mutations leads to hyposecretion and changes in the ionic composition of saliva (Nordgarden et al. 2003; Lexner et al. 2007); however, the specific mechanism by which EDA-null mutations cause salivary gland dysfunction is unknown. Saliva is generated in 2 stages wherein secretory acinar cells produce a plasma-like, NaCl-rich saliva (stage 1) and, subsequently, much of the NaCl secreted by the acinar cells is reabsorbed upon passage through the ducts (stage 2; Melvin et al. 2005; Lee et al. 2012). Acinar cell fluid secretion involves the coordinated activity of multiple ion channels and transporters (Melvin et al. 2005; Lee et al. 2012), while Na+ and Cl– reabsorption by the ducts is mediated by Scnn1 (sodium channel, nonvoltage-gated) Na+ channels and Cftr (cystic fibrosis transmembrane conductance regulator) Cl– channels (Catalan et al. 2010). Because male and female patients with X-LHED secrete less saliva with an elevated NaCl concentration (Nordgarden et al. 2003; Lexner et al. 2007), both stages of secretion may be compromised in this disease.
In this study, adult Tabby X-LHED mice were utilized to test the hypothesis that salivary gland dysfunction linked to Eda mutations is caused by impaired fluid secretion and NaCl reabsorption mechanisms. Unexpectedly, the acinar cell fluid secretion mechanism was intact in the hypoplastic salivary glands of adult Tabby male mice (Ta/Y). In contrast, salivary glands displayed a pronounced Na+ and Cl– reabsorption defect that correlated with loss of ducts and decreased Scnn1 Na+ channel expression. Such molecular and functional changes may reflect the elevated salivary NaCl concentration observed in patients affected with X-LHED.
Materials and Methods
General Methods and Materials
C57BL/6J Aw-J-Ta6J (Tabby, stock 000338) mice were housed in microisolator cages with ad libitum access to laboratory chow and water during 12-h light/dark cycles. C57BL/6J Aw-J-Ta6J mice carry a point deletion mutation on the X chromosome at position 1049 of the Eda gene (Ferguson et al. 1997; Srivastava et al. 1997). Heterozygous female (Ta/X) mice were mated with wild-type male (X/Y) mice to obtain hemizygous Tabby males (Ta/Y; Eda-null) and heterozygous Tabby females (Ta/X; harboring Eda-null and wild-type alleles). The genotype of the resulting offspring was confirmed by polymerase chain reaction, followed by DdeI restriction enzyme digestion, as previously described (Cui et al. 2006). Experiments were performed on 2- to 4-mo-old wild-type Ta/Y and Ta/X mice. All animal procedures were approved by the Animal Care and Use Committee of the National Institute of Dental and Craniofacial Research, National Institutes of Health (ASP 16-802).
Calculation of Cross-sectional Area
Paraformaldehyde-fixed and paraffin-embedded mouse submandibular gland (SMG), parotid gland (PG), and sublingual gland (SLG) were sectioned at 5 μm and stained with hematoxylin and eosin. Subsequently, 5 stained sections were then randomly selected for each gland from 3 male and 3 female 12-wk-old mice. Images were captured and analyzed as described in the Appendix.
In Vivo Saliva Collection
Mice were anaesthetized by intraperitoneal injection of chloral hydrate (400 mg/kg body wt) and fluid secretion stimulated with the cholinergic receptor agonist pilocarpine-HCl (10 mg/kg) as previously described (Romanenko et al. 2007). The salivas secreted by the SMG, PG, and SLG were simultaneously collected from the severed ends of the 3 ducts inserted into individual glass capillary tubes.
Ex Vivo Saliva Secretion
Ex vivo submandibular and sublingual salivary gland experiments were performed as previously described (Romanenko et al. 2007). Briefly, the glands were surgically dissected and transferred to a temperature-controlled perfusion chamber at 37°C, and the mandibular artery was perfused with a solution containing the cholinergic receptor agonist carbachol (0.3 μM) and β-adrenergic receptor agonist isoproterenol (1.0 μM) to stimulate secretion. Saliva was collected in calibrated glass capillary tubes. For amiloride-containing experiments, 10 μM amiloride was perfused for 30 min prior to and during stimulation. The ex vivo perfusion solution contained the following (in mM): 4.3 KCl, 120 NaCl, 25 NaHCO3, 5 glucose, 10 HEPES, 1 CaCl2, 1 MgCl2, pH 7.4 gassed with 95% O2–5% CO2 at 37 °C.
Calculation of Na+ and Cl– Reabsorption
The sodium concentration of the collected saliva was analyzed by atomic absorption spectroscopy (PerkinElmer Life Sciences 3030 Spectrophotometer), and chloride activity was measured with an Orion Research 940 expandable ion analyzer. The measured Na+ and Cl– concentrations of the final saliva are presented in the Appendix. The magnitude of Na+ and Cl– reabsorption was estimated as described in the Appendix.
Quantitative PCR
Quantitative PCR was performed as previously described (Mukaibo et al. 2018). Changes in gene expression were estimated as described in the Appendix.
Statistical Analysis
Results are presented as mean ± SEM showing individual data points. Statistical significance was determined with unpaired Student’s t test (Origin 7.0 Software; OriginLab). P values <0.05 were considered statistically significant.
Results
Decrease in Submandibular and Body Weights in Eda-Deficient Mice
Eda gene mutations disrupt mouse SMG development (Jaskoll et al. 2003; Melnick et al. 2009; Haara et al. 2011), but the effects on PG and SLG development are unclear. Adult Tabby 6J mice were used to study the X-LHED phenotype in PG, SMG, and SLG. The body weights of hemizygous Tabby male (Ta/Y) and heterozygous Tabby female (Ta/X) mice were significantly decreased by 18.3% and 10.1%, respectively (Table). The weight of the SMG was decreased more in Ta/Y (51.0%) than in Ta/X (14.0%) mice, consistent with Eda-null versus heterozygous mutations, respectively. While PG and SLG weights also tended to be smaller in Ta/Y and Ta/X mice, the loss of gland weight did not reach statistical significance except for a modest decrease in the male Ta/X SLG. These results reveal that of the 3 major salivary glands the adult male SMG weight is most affected by the Eda-null mutation.
Table.
Characterization of Salivary Glands in Tabby Hemizygous Male, Heterozygous Female, and Wild-type Mice.
| Mean ± SEM (n)a |
||||
|---|---|---|---|---|
| X/Y | Ta/Y | X/X | Ta/X | |
| Body weight, g | 22.9 ± 0.6 (17) | 18.7 ± 0.6 (16) | 19.8 ± 0.5 (12) | 17.8 ± 0.4 (11) |
| Gland weight, mg | ||||
| SMG | 57.2 ± 1.6 (23) | 28.0 ± 0.9 (23) | 31.5 ± 1.7 (20) | 27.1 ± 0.8 (19) |
| PG | 21.1 ± 2.4 (9) | 21.1 ± 1.7 (9) | 19.4 ± 0.8 (12) | 16.4 ± 1.4 (10) |
| SLG | 7.8 ± 0.4 (22) | 6.4 ± 0.3 (21) | 6.8 ± 0.2 (16) | 6.0 ± 0.3 (15) |
| Ductal/acinar cross-sectional ratio | ||||
| SMG | 0.919 ± 0.028 (15) | 0.256 ± 0.008 (15) | 0.326 ± 0.029 (15) | 0.215 ± 0.008 (15) |
| PG | 0.107 ± 0.012 (15) | 0.054 ± 0.008 (15) | 0.078 ± 0.010 (15) | 0.084 ± 0.010 (15) |
| SLG | 0.040 ± 0.004 (15) | 0.012 ± 0.003 (10) | 0.039 ± 0.004 (15) | 0.026 ± 0.005 (10) |
| Saliva flow rate, µL/min | ||||
| SMG | ||||
| In vivo | 3.1 ± 0.3 (8) | 2.7 ± 0.5 (9) | 1.0 ± 0.1 (12) | 0.8 ± 0.1 (10) |
| Ex vivo | 11.8 ± 0.4 (10) | 8.0 ± 0.9 (9) | 7.1 ± 0.7 (8) | 6.5 ± 0.4 (9) |
| Ex vivo +Amil | 3.5 ± 0.6b (5) | 2.7 ± 0.4b (5) | ||
| PG: in vivo | 3.9 ± 0.3 (9) | 3.6 ± 0.4 (9) | 1.7 ± 0.2 (12) | 1.3 ± 0.1 (10) |
| SLG | ||||
| In vivo | 0.21 ± 0.05 (7) | 0.09 ± 0.01 (8) | 0.25 ± 0.04 (9) | 0.12 ± 0.03 (8) |
| Ex vivo | 0.7 ± 0.04 (10) | 0.6 ± 0.1 (9) | 0.7 ± 0.1 (6) | 0.8 ± 0.05 (7) |
| Normalized saliva flow rate, µL/min/100-mg GW | ||||
| SMG | ||||
| In vivo | 5.2 ± 0.5 (8) | 10.2 ± 1.8 (9) | 3.4 ± 0.3 (12) | 3.3 ± 0.4 (10) |
| Ex vivo | 20.2 ± 0.7 (10) | 29.4 ± 4.0 (9) | 21.2 ± 2.3 (8) | 23.1 ± 1.7 (9) |
| Ex vivo +Amil | 7.3 ± 1.4b (5) | 9.4 ± 1.9b (5) | ||
| PG: in vivo | 20.6 ± 3.7 (9) | 18.1 ± 2.5 (9) | 8.8 ± 1.2 (12) | 8.1 ± 0.6 (10) |
| SLG | ||||
| In vivo | 2.3 ± 0.6 (7) | 1.3 ± 0.2 (8) | 3.7 ± 0.7 (9) | 1.9 ± 0.5 (8) |
| Ex vivo | 10.4 ± 1.20 (10) | 10.9 ± 1.6 (9) | 11.0 ± 0.9 (6) | 15.9 ± 1.87 (7) |
| Na+ reabsorption, mM | ||||
| SMG | ||||
| In vivo | 151.1 ± 1.3 (7) | 117.6 ± 4.0 (9) | 144.7 ± 2.3 (11) | 143.3 ± 3.7 (10) |
| Ex vivo | 137.2 ± 4.7 (10) | 52.9 ± 6.0 (9) | 126.5 ± 6.4 (8) | 108.6 ± 4.7 (8) |
| Ex vivo +Amil | 88.6 ± 9.0b (5) | 62.8 ± 3.2 (5) | ||
| PG: in vivo | 63.5 ± 3.4 (9) | 49.0 ± 3.4 (9) | 78.8 ± 2.8 (11) | 72.3 ± 6.3 (10) |
| SLG: ex vivo | 70.8 ± 2.9 (9) | 57.8 ± 1.8 (9) | 83.4 ± 5.7 (6) | 63.5 ± 1.7 (7) |
| Cl– reabsorption, mM | ||||
| SMG | ||||
| In vivo | 70.7 ± 3.3 (8) | 60.1 ± 4.8 (9) | 98.5 ± 3.8 (9) | 91.8 ± 4.6 (9) |
| Ex vivo | 84.9 ± 4.0 (10) | 33.4 ± 8.6 (9) | 75.8 ± 4.9 (8) | 73.0 ± 6.7 (8) |
| Ex vivo +Amil | 49.7 ± 5.8b (5) | 16.2 ± 3.0 (5) | ||
| PG: in vivo | 29.8 ± 3.2 (9) | 12.2 ± 2.9 (9) | 53.1 ± 3.7 (11) | 49.2 ± 8.1 (9) |
| SLG: ex vivo | 29.4 ± 3.1 (9) | 5.0 ± 2.7 (9) | 36.6 ± 5.4 (5) | 18.9 ± 2.9 (6) |
The ductal/acinar cross-sectional area ratio and Na+ and Cl– reabsorption were estimated as described in Methods. In vivo saliva was induced by 10 mg/kg of pilocarpine (intraperitoneal injection), whereas ex vivo glands were stimulated by perfusion with 0.3µM carbachol plus 1.0µM isoproterenol in the absence or presence of 10µM amiloride (+Amil). Statistical analysis was performed with the unpaired Student’s t test, P < 0.05. Tabby (Ta/Y and Ta/X) values in gray are statistically different from wild-type (X/Y and X/X) littermate mice. For details describing how the magnitude of Na+ and Cl– reabsorption was estimated, see Figure 2 and the Appendix.
GW, gland weight; PG, parotid gland; SLG, sublingual gland; SMG, submandibular gland; Ta/X, heterozygous female; Ta/Y, hemizygous male; X/Y and X/X, wild-type mice.
The number of mice for body weight and the number of glands for all other measurements are shown in parentheses.
Statistically significant differences (P < 0.05) in ex vivo salivary flow and ion composition in the presence or absence of amiloride treatment between male Tabby (Ta/Y vs. T/Y +Amil) and wild-type (X/Y vs. X/Y +Amil) littermate mice.
Loss of Ducts in SMGs of Tabby Mice
The mouse SMG is composed of >30% ducts, while the PG and SLG contain about 10% ducts (Kondo et al. 2015). The 51% decrease in the SMG weight in Ta/Y mice was associated with a dramatic reduction in the contribution of ducts to gland mass (Fig. 1A); that is, the ratio of the ductal/acinar cross-sectional areas was significantly decreased in the SMG of male Ta/Y (72.1%) and female Ta/X (34.0%) mice, as summarized in Figure 1B. A significant decrease in the ratio of the ductal/acinar cross-sectional areas was also seen in the PG and SLG of male Ta/Y but not female Ta/X mice (Table). Given that the PG and SLG contain only about 10% ducts, it is not surprising that the decrease in the ductal cross-sectional areas of Ta/Y PG and SLG did not appreciably affect gland weight.
Figure 1.
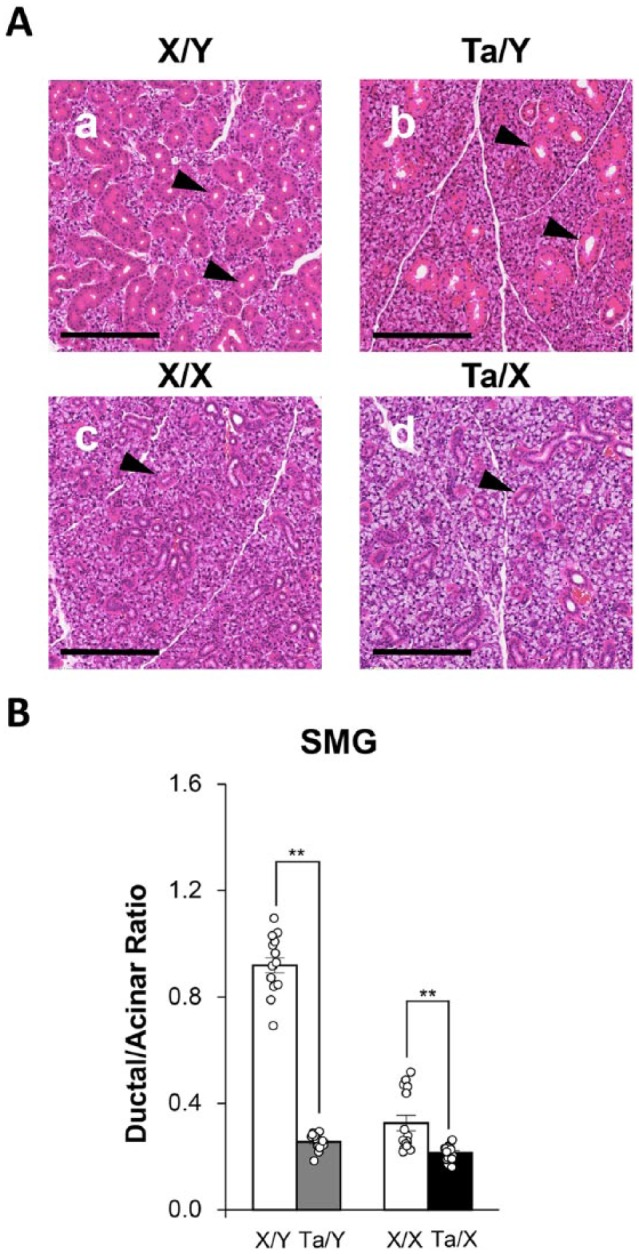
Decrease in the cross-sectional area of submandibular gland ducts in Tabby male (Ta/Y) and female (Ta/X) mice. (A) Representative hematoxylin and eosin–stained submandibular glands of wild-type (a) male X/Y and (c) female X/X and Tabby (b) male Ta/Y and (d) female Ta/X mice. Arrowheads indicate granular ducts. Scale bars represent 200 µm. (B) Quantitative evaluation of submandibular gland (SMG) ductal/acinar ratio calculated from cross-sectional areas of images like those shown in panel A. Each bar represents the mean ± SEM of 15 slides from 3 independent mice. The ductal/acinar ratio significantly decreased in Ta/Y and Ta/X mice. Unpaired Student’s t test (**P < 0.01).
Fluid Secretion Mechanism Is Intact in Eda Mutant Mice
When analyzed for salivary flow, the SMG and PG of Ta/Y mice displayed in vivo rates comparable to those of wild-type X/Y littermates (Fig. 2A and Table, respectively). The SMG was further studied with the isolated ex vivo preparation to allow analysis at a greater agonist-stimulated flow rate; that is, the male ex vivo SMG generates 3- to 4-fold more stimulated saliva than the in vivo SMG in Ta/Y and X/Y mice, while the SMG of Ta/X and X/X mice produces ex vivo saliva at about a 7-fold-greater rate than the in vivo SMG. Ex vivo SLG saliva was also collected, but too little saliva was produced in vivo to permit ion composition analysis. Ta/Y SMG displayed about a 32% lower ex vivo flow rate as compared with wild-type X/Y mice (Fig. 2C). However, when the ex vivo flow rate was normalized to gland weight, the SMG flow rate was greater from Ta/Y mice than its X/Y controls, indicating that the acinar cell fluid secretion mechanism remains intact in Eda-null mice.
Figure 2.
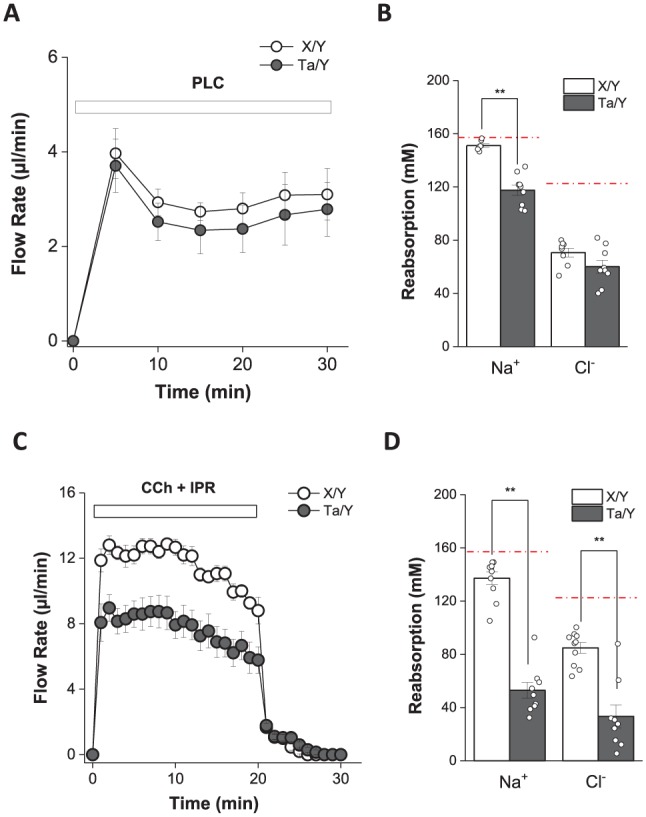
Defective NaCl reabsorption in the submandibular glands (SMGs) of Tabby male (Ta/Y) mice. (A) Flow rate of in vivo stimulated SMG saliva from wild-type male (X/Y; open circle n = 8) and Ta/Y (filled circle n = 9) mice (intraperitoneal pilocarpine [PLC], 10 mg/kg body weight). (B) Summary of Na+ and Cl– reabsorption of in vivo stimulated SMG saliva from panel A. (C) Flow rate of ex vivo stimulated SMG saliva in response to 0.3 μM carbachol (CCh) and 1.0μM isoproterenol (IPR) from X/Y (open circle, n = 10) and Ta/Y (filled circle, n = 9) mice. (D) Summary of Na+ and Cl– reabsorption of ex vivo stimulated SMG saliva from panel C. The red broken lines at 157 and 122 mM in panels B and D represent the [Na+] and [Cl–] of primary saliva, respectively (see Methods). Values are presented as the mean ± SEM. Unpaired Student’s t test statistical analysis (**P < 0.01). To estimate the magnitude of Na+ and Cl– reabsorption, the measured Na+ and Cl– concentration values were subtracted from the previously reported Na+ and Cl– concentration values for the primary saliva collected by micropuncture from mouse SMG acinar cells (Mangos et al. 1973). The [Na+] and [Cl–] of the primary saliva represents the Na+ and Cl– concentrations secreted into the acinar lumen. Consequently, subtraction of the final saliva [Na+] and [Cl–] as it exits the main duct from the Na+ and Cl– concentrations of the primary saliva estimates the amount of Na+ and Cl– reabsorption that occurs during transit through the salivary gland ducts. For additional details see Appendix.
Na+ and Cl– Reabsorption Defects in Salivary Glands of Eda-Deficient Mice
When saliva was analyzed for ion concentration, Na+ reabsorption by the in vivo Ta/Y SMG was significantly decreased ~22% as compared with X/Y mice, whereas there was a subtle nonsignificant decrease in Cl– reabsorption (Fig. 2B). Of note, at the higher flow rate in the ex vivo SMG, Eda-null Ta/Y mice displayed even greater reductions in Na+ and Cl– reabsorption as compared with wild-type male mice (about 60%; Fig. 2D). The female Ta/X SMG also showed a significant decrease in Na+ reabsorption but of a lesser magnitude, as expected for the heterozygous Eda mutation (~14%; Table). There were statistically significant decreases in Na+ and Cl– reabsorption by the ex vivo SLG of male and female Tabby mice but only for Na+ reabsorption in the male in vivo PG. Thus, the PG, SMG, and SLG of male Ta/Y mice all displayed decreased Na+ and Cl– reabsorption, whereas female Ta/X salivary glands showed a variable and less severe response to the heterozygous Eda mutation.
The in vivo and ex vivo Ta/Y and X/Y SMG data from individual glands were plotted for Na+ and Cl– reabsorption versus salivary flow rate. We predicted that Na+ and Cl– reabsorption pathways would be saturated at higher flow rates and thus more vulnerable to the Eda mutation. Indeed, Na+ reabsorption was compromised at all flow rates in Ta/Y mice, and it was most dramatic at high flow rates (Fig. 3A)—that is, about 25% less Na+ reabsorption at low flow rates and 70% less at high flow rates. In contrast, Cl– reabsorption was significantly impaired only at higher flow rates (Fig. 3B).
Figure 3.
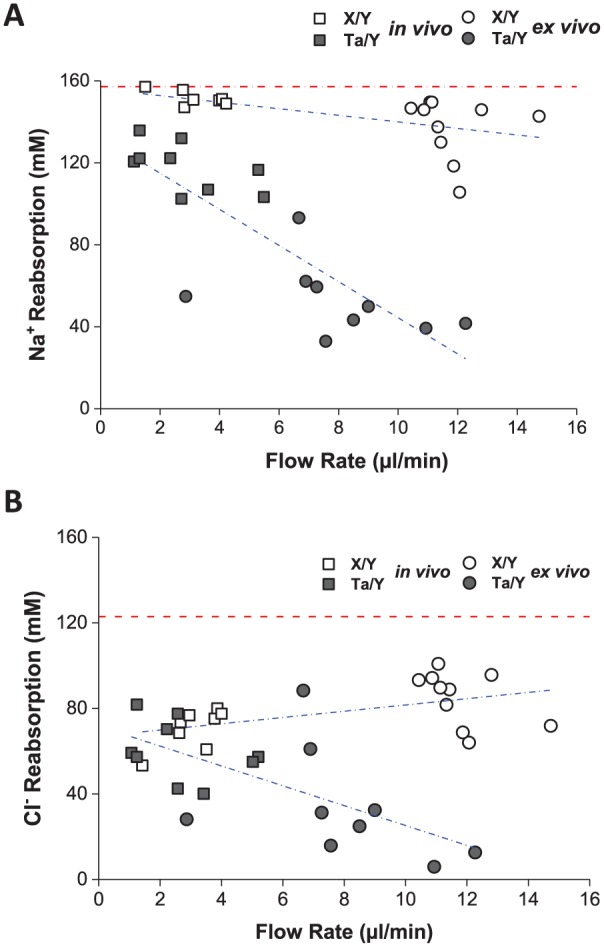
The Na+ and Cl reabsorption defect in Ta/Y is flow rate dependent. (A) Correlation between in vivo (squares) and ex vivo (circles) stimulated saliva flow rate and Na+ reabsorption in wild-type male (X/Y; open symbols n = 7 to 10) and Tabby male (Ta/Y; filled symbols n = 9) mice (data from Fig. 2). (B) Correlation between in vivo (squares) and ex vivo (circles) stimulated saliva flow rate and Cl– reabsorption in X/Y (open symbols n = 8 to 10) and Ta/Y (filled symbols n = 9) mice (data from Fig. 2). Red dotted lines at 157 mM [Na+] (panel A) and at 122 mM [Cl–] (panel B) represent the concentration for these ions in primary submandibular gland saliva (Mangos et al. 1973). Blue lines represent linear regression of the data points for each group. For details describing how the magnitude of Na+ and Cl– reabsorption was estimated, see Figure 2 and the Appendix.
Decreased Scnn1 Expression in SMGs of Eda-Deficient Mice
Na+ and Cl– reabsorption by the mouse SMG requires functional coupling of Scnn1 Na+ and Cftr Cl– channels (Catalan et al. 2010). Consequently, we hypothesized that a decrease in Scnn1 and/or Cftr expression might compromise Na+ and Cl– reabsorption in the SMG of Ta/Y mice. As predicted with this model, mRNA expression of Scnn1b and Scnn1g (β and γ subunits, respectively) was significantly decreased in Ta/Y mice, whereas Scnn1α and Cftr expression levels were comparable in the SMG of male X/Y and Ta/Y mice (Fig. 4A). However, a mutation in Eda could affect multiple processes other than expression of Scnn1 genes, which could account in part for the salivary gland phenotype of the Tabby mouse. Nevertheless, in contrast to the decrease in Scnn1b and Scnn1g mRNA levels in the Ta/Y mouse SMG, immunofluorescence (Ano1, Nkcc1, and Aqp5) and quantitative PCR (Ano1, Nkcc1, Aqp5, Chrm1, and Chrm3) results revealed that mRNA expression and protein targeting of key gene products involved in the salivary gland fluid and electrolyte secretion mechanism did not significantly change in Ta/Y mice, except for increased expression of Ano1 and Aqp5 (see Appendix).
Figure 4.
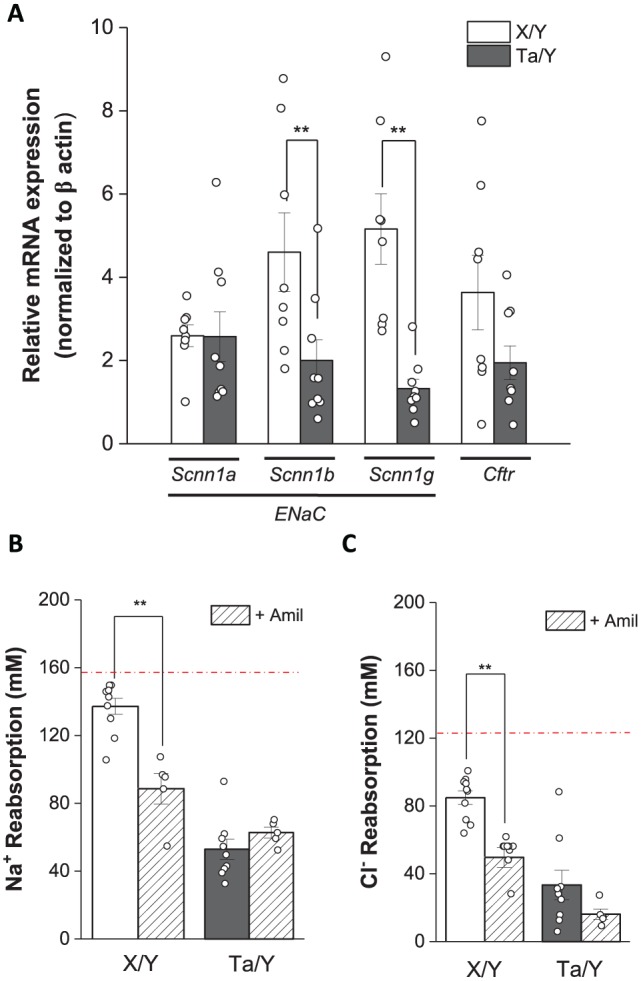
Scnn1 expression and function are critical for NaCl reabsorption. (A) Quantitative polymerase chain reaction analysis of Scnn1a, Scnn1b, Scnn1g, and Cftr mRNA expression levels in wild-type male (X/Y; open bars, n = 8) and Tabby male (Ta/Y; closed bars, n = 9) mice. (B) Na+ and (C) Cl– concentration of saliva from submandibular gland perfused with 10μM amiloride (+Amil) prior to and during stimulation (0.3μM carbachol and 1.0μM isoproterenol, n = 5). The red broken lines in panels B and C represent the [Na+] and [Cl–] of primary saliva (see Methods). Values are presented as the mean ± SEM. Unpaired Student’s t test (**P < 0.01). For details describing how the magnitude of Na+ and Cl– reabsorption was estimated, see Figure 2 and the Appendix.
Na+ Channel Inhibition Mimicked the NaCl Reabsorption Defect in Eda-Null Mice
The results shown in Figure 4A indicate that disruption of Na+ and Cl– reabsorption is likely caused by decreased expression of functional Scnn1 Na+ channels in the SMG of Ta/Y mice. The Scnn1 channel blocker amiloride was used to further establish the link between Scnn1 expression and reduced Na+ and Cl– reabsorption in male Ta/Y SMG (Table). In the SMG of X/Y wild-type mice, amiloride significantly inhibited Na+ and Cl– reabsorption to levels like those seen in Ta/Y mice. In contrast, amiloride failed to further reduce the magnitude of Na+ or Cl– reabsorption (Fig. 4B, C, respectively) in Ta/Y mice, demonstrating that the effects of the Eda mutation and amiloride on Na+ and Cl– reabsorption were not additive.
Discussion
Of the >170 clinically defined ectodermal dysplasias (Priolo and Lagana 2001; Visinoni et al. 2009; Pagnan and Visinoni 2014), X-LHED is most frequently observed (Schneider et al. 2011; Fete et al. 2014; Kaercher et al. 2015). Genetic mutations in EDA disrupt EDA signaling, which results in hypoplastic development of epithelial tissues. Hemizygous X-LHED males display the most severe phenotype, including hypohidrosis, hypotrichosis, hypodontia, and xerostomia, while “carrier” heterozygous X-LHED females typically exhibit similar but more variable and less severe traits, comparable to the results of the present study.
The Tabby X-LHED phenotype is characterized by defective hair follicles (Cui et al. 2006), teeth (Pispa et al. 1999), and sweat glands (Blecher 1986), thus confirming that Eda/Edar signaling plays a critical role in the morphogenesis of various epithelial tissues. The Eda/Eda receptor (Edar) signaling pathway has also been linked to developmental defects in mouse submandibular salivary glands (Jaskoll et al. 2003; Melnick et al. 2009; Haara et al. 2011). Indeed, we found that the adult gland weight of the SMG was markedly decreased by >50% in male hemizygous Ta/Y mice, whereas the weight of SMG decreased <15% in female heterozygous Ta/X mice, which retain 1 wild-type allele. In contrast, SLG weight in male hemizygous Ta/Y mice decreased modestly with no change in weight for the PG; thus, the effects of the Eda mutation on salivary gland weight were clearly the most dramatic in the SMG. Earlier studies with the Tabby X-LHED mouse model focused on the SMG; consequently, the effects of Eda disruption on organogenesis of the other 2 major salivary glands have not been reported. Note that clinical studies have not directly addressed if EDA disruption affects salivary gland size in patients with X-LHED.
Like the effects of the Eda mutation on SMG gland weight, the number of SMG ducts relative to acini was markedly decreased in male Ta/Y mice and, to a lesser extent, in female Ta/X mice. Similarly, the gland weight of the SLG in male Ta/Y mice tended to be smaller, and they displayed a significant decrease in the cross-sectional area of their ducts. It is unclear why female SMG weights and ducts but not female PG and SLG were affected in Eda-deficient Ta/X mice. Of note, female Ta/X mice harbor a wild-type Eda allele; thus, Eda/Edar signaling is not completely abolished and may be variable in the different salivary glands. The SMG may simply be more sensitive to Eda/Edar signaling than the PG and SLG during morphogenesis. Regardless, the different members of the Eda/Edar signaling pathway are expressed during early SMG embryogenesis (Gluck et al. 2016) and in the adult PG, SMG, and SLG (Gao et al. 2018). However, sex differences were not specifically addressed in these studies.
Alternatively, the greater sensitivity of the mouse SMG to Eda disruption may involve its unique responsiveness to androgens during development. The mouse SMG contains a subpopulation of specialized duct cells—the so-called granular convoluted tubule (GCT) cells (Pinkstaff 1980). Although both sexes express GCT ducts, the GCT cells are much larger in male SMG due to the inclusion of very large secretory granules (Kurabuchi et al. 2002). Of note, individual GCT duct cells in male Ta/Y mice appeared to have a cross-sectional area similar to that in X/Y mice, suggesting that androgen signaling remains intact in Ta/Y mice. Consequently, the dramatic decrease of ducts in the SMG of male Ta/Y mice was not due to smaller GCT duct cells but, rather, the total number of GCT ducts decreased in this mouse. Thus, it appears that Eda plays a major developmental role in determining the number of GCT cells in the SMG but it is less important for the adult phenotype of these cells.
Saliva is generated by a 2-stage mechanism where the secretory acinar cells produce a plasma-like, NaCl-rich saliva (stage 1), and subsequently, much of the NaCl secreted by the acinar cells is reabsorbed upon passage through the ducts (stage 2) (Melvin et al. 2005; Lee et al. 2012). Hemizygous male and heterozygous female patients with X-LHED secrete less saliva with an elevated NaCl concentration (Nordgarden et al. 2003; Lexner et al. 2007), suggesting that both stages of secretion may be compromised. The saliva flow rate was significantly reduced in the SMG of Ta/Y mice, but the flow rate was unchanged in the other salivary glands. Fluid secretion by human SMGs also appeared to be more affected than the PGs of patients with ectodermal dysplasia (Nordgarden et al. 2003), but gland size was not evaluated. When the flow rate of the SMG was normalized to gland weight, the Ta/Y SMG secreted at a greater rate than the SMG of wild-type X/Y littermates, possibly suggesting compensation for hypoplastic development of the Ta/Y SMG. Thus, considering that the magnitude of the decrease in Ta/Y SMG weight corresponded with a decrease in the contribution of ducts to the total gland mass, the acinar cell fluid secretion mechanism appears to remain intact in the SMG of Tabby mice.
In contrast to the intact fluid secretion mechanism, Na+ and Cl– reabsorption by the SMG was severely compromised in Ta/Y mice. Note that Na+ and Cl– reabsorption was calculated (see Appendix for details) per reports showing that the Na+ and Cl– secretion mechanism is highly conserved across species and different salivary glands (Holzgreve et al., 1966; Mangos et al., 1966; Martinez et al, 1966; Martin and Young 1971; Kaladelfos and Young 1973). Nevertheless, we cannot rule out that such assumptions may affect our calculation; thus, the final saliva Na+ and Cl– concentrations are also provided in the Appendix.
The decrease in Na+ and Cl– reabsorption directly correlated with a decrease in the expression of the β and γ subunits of Scnn1 Na+ channels in the SMG of Ta/Y mice. Heteromeric ENaC (epithelial Na+ channel) is assembled from 3 homologous Scnn1 subunits: α, β, and γ (Kashlan and Kleyman 2011; Kleyman et al. 2018). NaCl reabsorption is mediated by the coordinated activity of Scnn1 Na+ and Cftr Cl– channels in the duct cells of salivary glands (Catalan et al. 2010) and sweat glands (Reddy et al. 1999); Reddy and Quinton 2003). Hence, it seems likely that decreased Scnn1 expression in the SMG of Ta/Y mice results in a decrease in the reabsorption of Na+ and Cl–. Consistent with this hypothesis, the Scnn1 inhibitor amiloride decreased Na+ and Cl– reabsorption in wild-type SMG but not that of Ta/Y mice.
The simplest interpretation of these results is that the Eda mutation and amiloride act on the same Na+ reabsorption pathway; thus, Scnn1 function was likely compromised in Ta/Y mice. These results also confirm that Scnn1 channel activity is functionally linked with that of the Cftr channel; consequently, Ta/Y mice also display impaired Cl– reabsorption due to reduced Scnn1 activity. Increased Na+ and Cl– concentrations (i.e., less NaCl reabsorption) were also found in human whole saliva in patients with X-LHED, where the Na+ and Cl– concentrations were highest in affected males, followed by carrier females (Lexner et al. 2007). One clinical study collected saliva from individual parotid and submandibular salivary glands, but Na+ and Cl– concentrations were not analyzed (Nordgarden et al. 2003). Thus, clinical studies have not directly addressed if the NaCl reabsorption defect in patients with X-LHED is salivary gland specific. Note that up to 73.5% of patients with X-LHED experience respiratory tract infections in the first year (Blüschke et al. 2010; Fete 2014). Given that Scnn1 Na+ channels play a critical role in maintaining the volume of airway fluid to facilitate the clearance of bacteria and debris, decreased Scnn1 channel expression might also contribute to respiratory problems of patients with X-LHED.
Author Contributions
J.E. Melvin, T. Mukaibo, T. Munemasa, contributed to conception, design, data acquisition, analysis, and interpretation, drafted and critically revised the manuscript; C. Masaki, C.Y. Cui, contributed to data interpretation, critically revised the manuscript. All authors gave final approval and agree to be accountable for all aspects of the work.
Supplemental Material
Supplemental material, DS_10.1177_0022034518782461 for Defective NaCl Reabsorption in Salivary Glands of Eda-Null X-LHED Mice by T. Mukaibo, T. Munemasa, C. Masaki, C.Y. Cui and J.E. Melvin in Journal of Dental Research
Acknowledgments
We thank Yasna Jaramillo and Jaideep Honavar for technical assistance and Drs. David Schlessinger and Peter Burbelo for helpful discussions during the preparation of this manuscript.
Footnotes
A supplemental appendix to this article is available online.
This study was supported by 1-ZIA-DE000738 (J.E.M.) and 1-ZIG- DE000740 (Veterinary Research Core) from the Intramural Research Program of the National Institute of Dental and Craniofacial Research, National Institutes of Health.
The authors declare no potential conflicts of interest with respect to the authorship and/or publication of this article.
References
- Blecher SR. 1986. Anhidrosis and absence of sweat glands in mice hemizygous for the Tabby gene: supportive evidence for the hypothesis of homology between Tabby and human anhidrotic (hypohidrotic) ectodermal dysplasia (Christ-Siemens-Touraine syndrome). J Invest Dermatol. 87(6):720–722. [DOI] [PubMed] [Google Scholar]
- Blüschke G, Nüsken KD, Schneider H. 2010. Prevalence and prevention of severe complications of hypohidrotic ectodermal dysplasia in infancy. Early Hum Dev. 86(7):397–399. [DOI] [PubMed] [Google Scholar]
- Catalan MA, Nakamoto T, Gonzalez-Begne M, Camden JM, Wall SM, Clarke LL, Melvin JE. 2010. Cftr and ENaC ion channels mediate NaCl absorption in the mouse submandibular gland. J Physiol. 588(Pt 4):713–724. [DOI] [PMC free article] [PubMed] [Google Scholar]
- Cui CY, Hashimoto T, Grivennikov SI, Piao Y, Nedospasov SA, Schlessinger D. 2006. Ectodysplasin regulates the lymphotoxin-beta pathway for hair differentiation. Proc Natl Acad Sci U S A. 103(24):9142–9147. [DOI] [PMC free article] [PubMed] [Google Scholar]
- Ferguson BM, Brockdorff N, Formstone E, Ngyuen T, Kronmiller JE, Zonana J. 1997. Cloning of Tabby, the murine homolog of the human EDA gene: evidence for a membrane-associated protein with a short collagenous domain. Hum Mol Genet. 6(9):1589–94. [DOI] [PubMed] [Google Scholar]
- Fete M, Hermann J, Behrens J, Huttner KM. 2014. X-linked hypohidrotic ectodermal dysplasia (XLHED): clinical and diagnostic insights from an international patient registry. Am J Med Genet A. 164(10):2437–2442. [DOI] [PubMed] [Google Scholar]
- Fete T. 2014. Respiratory problems in patients with ectodermal dysplasia syndromes. Am J Med Genet A. 164A(10):2478–2481. [DOI] [PubMed] [Google Scholar]
- Gaide O, Schneider P. 2003. Permanent correction of an inherited ectodermal dysplasia with recombinant EDA. Nat Med. 9(5):614–618. [DOI] [PubMed] [Google Scholar]
- Gao X, Oei MS, Ovitt CE, Sincan M, Melvin JE. 2018. Transcriptional profiling reveals gland-specific differential expression in the three major salivary glands of the adult mouse. Physiol Genomics. 50(4):263–271. [DOI] [PMC free article] [PubMed] [Google Scholar]
- Gluck C, Min S, Oyelakin A, Smalley K, Sinha S, Romano RA. 2016. RNA-seq based transcriptomic map reveals new insights into mouse salivary gland development and maturation. BMC Genomics. 17(1):923. [DOI] [PMC free article] [PubMed] [Google Scholar]
- Haara O, Fujimori S, Schmidt-Ullrich R, Hartmann C, Thesleff I, Mikkola ML. 2011. Ectodysplasin and Wnt pathways are required for salivary gland branching morphogenesis. Development. 138(13):2681–2691. [DOI] [PubMed] [Google Scholar]
- Holzgreve H, Martinez JR, Vogel A. 1966. Micropuncture and histologic study of submaxillary glands of young rats. Pflugers Arch. 290(2):134–143. [DOI] [PubMed] [Google Scholar]
- Itin PH, Fistarol SK. 2004. Ectodermal dysplasias. Am J Med Genet C Semin Med Genet. 131(1):45–51. [DOI] [PubMed] [Google Scholar]
- Jaskoll T, Zhou YM, Trump G, Melnick M. 2003. Ectodysplasin receptor-mediated signaling is essential for embryonic submandibular salivary gland development. Anat Rec A Discov Mol Cell Evol Biol. 271(2):322–331. [DOI] [PubMed] [Google Scholar]
- Kaercher T, Dietz J, Jacobi C, Berz R, Schneider H. 2015. Diagnosis of X-linked hypohidrotic ectodermal dysplasia by meibography and infrared thermography of the eye. Curr Eye Res. 40(9):884–890. [DOI] [PubMed] [Google Scholar]
- Kashlan OB, Kleyman TR. 2011. ENaC structure and function in the wake of a resolved structure of a family member. Am J Physiol Renal Physiol. 301(4):F684–F696. [DOI] [PMC free article] [PubMed] [Google Scholar]
- Kere J, Srivastava AK, Montonen O, Zonana J, Thomas N, Ferguson B, Munoz F, Morgan D, Clarke A, Baybayan P, et al. 1996. X-linked anhidrotic (hypohidrotic) ectodermal dysplasia is caused by mutation in a novel transmembrane protein. Nat Genet. 13(4):409–416. [DOI] [PubMed] [Google Scholar]
- Kleyman TR, Kashlan OB, Hughey RP. 2018. Epithelial Na+ channel regulation by extracellular and intracellular factors. Annu Rev Physiol. 80:263–281. [DOI] [PMC free article] [PubMed] [Google Scholar]
- Kondo Y, Nakamoto T, Jaramillo Y, Choi S, Catalan MA, Melvin JE. 2015. Functional differences in the acinar cells of the murine major salivary glands. J Dent Res. 94(5):715–721. [DOI] [PMC free article] [PubMed] [Google Scholar]
- Kurabuchi S, Hosoi K, Gresik EW. 2002. Developmental and androgenic regulation of the immunocytochemical distribution of mK1, a true tissue kallikrein, in the granular convoluted tubule of the mouse submandibular gland. J Histochem Cytochem. 50(2):135–145. [DOI] [PubMed] [Google Scholar]
- Lee MG, Ohana E, Park HW, Yang D, Muallem S. 2012. Molecular mechanism of pancreatic and salivary gland fluid and HCO3 secretion. Physiol Rev. 92(1):39–74. [DOI] [PMC free article] [PubMed] [Google Scholar]
- Lexner MO, Bardow A, Hertz JM, Almer L, Nauntofte B, Kreiborg S. 2007. Whole saliva in X-linked hypohidrotic ectodermal dysplasia. Int J Paediatr Dent. 17(3):155–162. [DOI] [PubMed] [Google Scholar]
- Mangos JA, Braun G, Hamann KF. 1966. Micropuncture study of sodium and potassium excretion in the rat parotid saliva. Pflugers Arch. 291(1):99–106. [DOI] [PubMed] [Google Scholar]
- Mangos JA, McSherry NR, Nousia-Arvanitakis S, Irwin K. 1973. Secretion and transductal fluxes of ions in exocrine glands of the mouse. Am J Physiol. 225(1):18–24. [DOI] [PubMed] [Google Scholar]
- Martin CJ, Young JA. 1971. Electrolyte concentrations in primary and final saliva of the rat sublingual gland studied by micropuncture and catheterization techniques. Pflugers Arch. 324(4):344–360. [DOI] [PubMed] [Google Scholar]
- Martinez F, Millan JM, Orellana C, Prieto F. 1999. X-linked anhidrotic (hypohidrotic) ectodermal dysplasia caused by a novel mutation in eda1 gene: 406T > G (Leu55Arg). J Invest Dermatol. 113(2):285–286. [DOI] [PubMed] [Google Scholar]
- Martinez JR, Holzgreve H, Frick A. 1966. Micropuncture study of submaxillary glands of adult rats. Pflugers Arch. 290(2):124–133. [DOI] [PubMed] [Google Scholar]
- Melnick M, Phair RD, Lapidot SA, Jaskoll T. 2009. Salivary gland branching morphogenesis: a quantitative systems analysis of the Eda/Edar/NFκB paradigm. BMC Dev Biol. 9:32. [DOI] [PMC free article] [PubMed] [Google Scholar]
- Melvin JE, Yule D, Shuttleworth T, Begenisich T. 2005. Regulation of fluid and electrolyte secretion in salivary gland acinar cells. Annu Rev Physiol. 67:445–469. [DOI] [PubMed] [Google Scholar]
- Mukaibo T, Munemasa T, George AT, Tran DT, Gao X, Herche J, Masaki C, Shull GE, Soleimani M, Melvin JE. 2018. The apical anion exchanger Slc26a6 promotes oxalate secretion by murine submandibular gland acinar cells. J Biol Chem. 293(17):6259–6268. [DOI] [PMC free article] [PubMed] [Google Scholar]
- Nordgarden H, Storhaug K, Lyngstadaas SP, Jensen JL. 2003. Salivary gland function in persons with ectodermal dysplasias. Eur J Oral Sci. 111(5):371–376. [DOI] [PubMed] [Google Scholar]
- Pagnan NA, Visinoni AF. 2014. Update on ectodermal dysplasias clinical classification. Am J Med Genet A. 164(10):2415–2423. [DOI] [PubMed] [Google Scholar]
- Pinheiro M, Freire-Maia N. 1994. Ectodermal dysplasias: a clinical classification and a causal review. Am J Med Genet. 53(2):153–162. [DOI] [PubMed] [Google Scholar]
- Pinkstaff CA. 1980. The cytology of salivary glands. Int Rev Cytol. 63:141–261. [DOI] [PubMed] [Google Scholar]
- Pispa J, Jung HS, Jernvall J, Kettunen P, Mustonen T, Tabata MJ, Kere J, Thesleff I. 1999. Cusp patterning defect in Tabby mouse teeth and its partial rescue by FGF. Dev Biol. 216(2):521–534. [DOI] [PubMed] [Google Scholar]
- Priolo M, Lagana C. 2001. Ectodermal dysplasias: a new clinical-genetic classification. J Med Genet. 38(9):579–585. [DOI] [PMC free article] [PubMed] [Google Scholar]
- Reddy MM, Light MJ, Quinton PM. 1999. Activation of the epithelial Na+ channel (ENaC) requires CFTR Cl- channel function. Nature. 402(6759):301–304. [DOI] [PubMed] [Google Scholar]
- Reddy MM, Quinton PM. 2003. Functional interaction of CFTR and ENaC in sweat glands. Pflugers Arch. 445(4):499–503. [DOI] [PubMed] [Google Scholar]
- Romanenko VG, Nakamoto T, Srivastava A, Begenisich T, Melvin JE. 2007. Regulation of membrane potential and fluid secretion by Ca2+-activated K+ channels in mouse submandibular glands. J Physiol. 581(Pt 2):801–817. [DOI] [PMC free article] [PubMed] [Google Scholar]
- Schneider H, Hammersen J, Preisler-Adams S, Huttner K, Rascher W, Bohring A. 2011. Sweating ability and genotype in individuals with X-linked hypohidrotic ectodermal dysplasia. J Med Genet. 48(6):426–432. [DOI] [PubMed] [Google Scholar]
- Srivastava AK, Pispa J, Hartung AJ, Du Y, Ezer S, Jenks T, Shimada T, Pekkanen M, Mikkola ML, Ko MS, et al. 1997. The Tabby phenotype is caused by mutation in a mouse homologue of the EDA gene that reveals novel mouse and human exons and encodes a protein (ectodysplasin-A) with collagenous domains. Proc Natl Acad Sci U S A. 94(24):13069–13074. [DOI] [PMC free article] [PubMed] [Google Scholar]
- Visinoni AF, Lisboa-Costa T, Pagnan NA, Chautard-Freire-Maia EA. 2009. Ectodermal dysplasias: clinical and molecular review. Am J Med Genet A. 149(9):1980–2002. [DOI] [PubMed] [Google Scholar]
- Wells KL, Mou C, Headon DJ, Tucker AS. 2010. Recombinant EDA or sonic hedgehog rescue the branching defect in ectodysplasin a pathway mutant salivary glands in vitro. Dev Dyn. 239(10):2674–2684. [DOI] [PubMed] [Google Scholar]
Associated Data
This section collects any data citations, data availability statements, or supplementary materials included in this article.
Supplementary Materials
Supplemental material, DS_10.1177_0022034518782461 for Defective NaCl Reabsorption in Salivary Glands of Eda-Null X-LHED Mice by T. Mukaibo, T. Munemasa, C. Masaki, C.Y. Cui and J.E. Melvin in Journal of Dental Research