

Abstract
Most bacteriophages terminate infection by creating lesions in the cytoplasmic membrane, which not only cause immediate cell death but also allow escape of a phage-encoded endolysin. Destruction of the peptidoglycan and cell lysis follows very rapidly, allowing efficient release of the progeny virions. These membrane lesions are formed by a small integral membrane protein called a holin. Holins have highly charged carboxyl-termini that are thought to have two transmembrane α-helical domains. Holins are believed to oligomerize and form large holes in the inner membrane. The prototype holin is the S protein from bacteriophage λ. Scheduling of the lytic event is determined in part by the “structure directed initiation” or sdi translational control region. Inductions of S, cloned under a variety of native and nonnative promoters but with native translational control, resulted in cell lysis at about 1000 molecules of holin per cell, and thus do not produce biochemically useful amounts of S protein. By utilizing a plasmidbased system with the T7 RNA polymerase promoter in tandem with a consensus ribosome binding site, Coomassie blue-detectable quantities of S protein were obtained upon induction, corresponding to an approximately 100-fold increase over the normal lethal level of holin. Characterization of this expression system is presented and discussed with respect to the current model of holin function.
Keywords: Holin, Overexpression, Bacteriophage lysis
HOLINS are small membrane proteins encoded by bacteriophages. The function of a holin is to form a membrane lesion to allow release of a phage-encoded bacteriolytic enzyme, or endolysin, to the periplasm, causing degradation of the peptidoglycan and lysis of the cell (3). The membrane lesion is of unknown structure and appears to be relatively nonspecific. For example, the holin S of phage lambda can allow release of the lambda R transglycosylase, the P22 lysozyme, and the T4 lysozyme (20). Formation of the “hole” occurs at a precisely scheduled time in the infective cycle, and this timing is genetically programmed into the structure of the holin (1,18,19). Part of the regulation of S function stems from the “dual start” motif, which characterizes the S ribosome binding site region (Fig. 1) (3). Two AUG start codons, at positions 1 and 3 of the 107 codon reading frame, are both active in vivo, leading to the synthesis of two different proteins, S107 and S105 (named for their length in amino acid residues), from translational events at the two positions. Although the two proteins are identical except for the N-terminal Met1Lys2 sequence present on S107, they have opposing functions. S105 is the lethal lysis effector, whereas S107 acts as an inhibitor of S105 (1,2,6). Normally, the ribosome binding region of the S mRNA, which has at least one stable stem-loop structure, is very inefficient in vivo, supporting the synthesis of less than one S protein per minute per S mRNA, at a ratio of about two S105 molecules per S107 (2,6). In induced λ lysogens, hole formation occurs at about 50 min, when about 103 molecules of S protein have accumulated in the membrane (6,13).
FIG. 1.
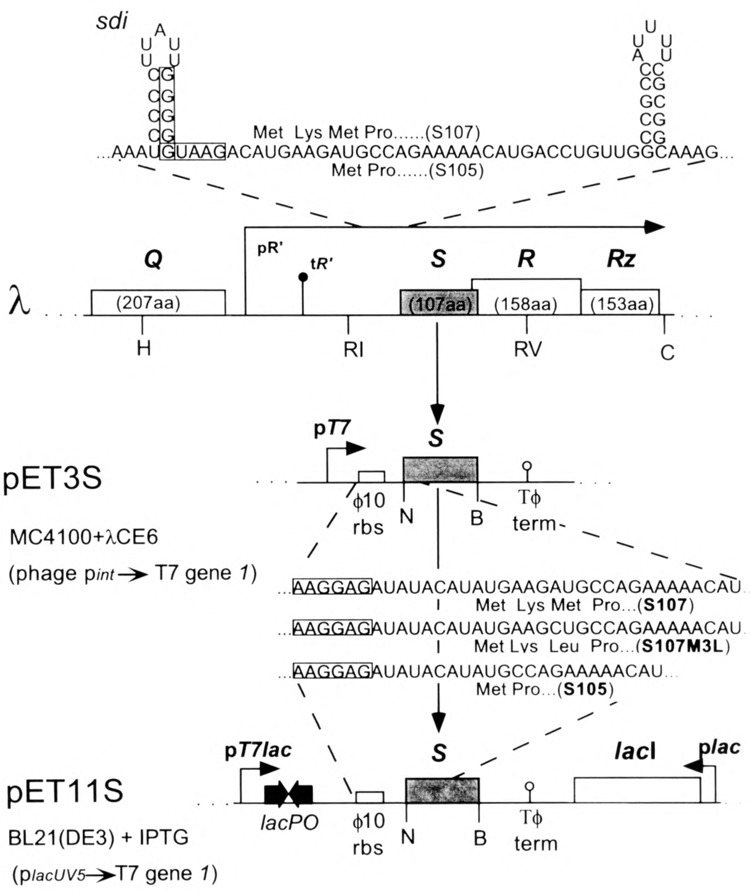
Diagram indicating native and artificial transcriptional and translational control of the S cistron in transcripts made from λ and pET constructs. The N-terminal sequences of the three types of constructs, S107, S107m3l, and S105 are indicated. The boxed sequences in the λ mRNA indicate the Shine-Dalgarno sequences for the dual translational starts of the S gene, sdi is the genetic locus for single base changes causing dominant-negative lysis defects, one of two RNA stem-loop structures involved in translational initiation of S(2). The pR′ and tR′ promoter and terminator for the lambda late transcriptional unit are shown upstream of the EcoRI site. Restriction sites are indicated (H, HindIII; RI, EcoRI; RV, EcoRV; C, ClaI; N, NdeI; B, BamHI). Transcription in pET3 and pET11 constructs is efficiently terminated by the Tϕ transcriptional terminator located directly downstream of the cloned gene (21). pET3 and pET11 constructs are distinguished by the hybrid promoter of pET11a in which the lac operator sequence is embedded adjacent to the T7 promoter. pET11a also harbors the lacI repressor gene to decrease basal level of transcription from pT7lac. The pET1 la expression system is further repressed by having T7 gene 1 under lacUV5 promoter control on the BL21 (DE3) chromosome.
Mutational analysis of S structure and function has been convenient because S is lethal and small, thereby making the selection and mapping of mutants relatively easy. Moreover, much of the S sequence is presumably dedicated to transmembrane helix structures, thus limiting the structure-function problem to manageable size, at least in principle. However, these features make for complementary difficulties in studying the function of the S holin in vitro. In particular, devising strategies to obtain biochemically useful amounts of S protein are severely constrained by the fact that S has evolved to kill Escherichia coli and can be expected to be a challenging candidate for overproduction protocols. Moreover, S is equivalently lethal in yeast (10), probably reflecting the fact that all S needs to kill the cell is the membrane bilayer as a target. Here we report the construction of an overexpression system for S. Its characteristics are discussed in terms of current models for the function and regulation of S in particular and holins in general.
MATERIALS AND METHODS
Strains, Phages, Plasmids, Oligonucleotides, and Growth Media
The E. coli strains, bacteriophage, plasmids, and oligonucleotides used in this study are listed in Table 1. Oligonucleotides were purchased from the Gene Technologies Laboratory in the Department of Biology at Texas A&M University. The pET plasmid vectors were acquired from Novagen (Madison, WI). Unless otherwise indicated, chemical compounds were obtained from Sigma (St. Louis, MO). M9 maltose, TB maltose (TBM), and LB media were prepared as described by Miller (14).
TABLE 1.
BACTERIAL STRAINS, BACTERIOPHAGES, PLASMIDS, AND OLIGONUCLEOTIDES
| Strain | Genotype/Relevant Features | Source or Reference |
|---|---|---|
| Bacterial strains | ||
| BL21 (DE3) | E. coli B F− ompT lon hsdS galλ(imm 21 nin5 int::larI-lac p UV5-T7gene1) | 28 |
| MC4100 | E. coli K12 F− lacΔU169 araDI39 relA rpsL thi | 25 |
| MS59 | MC4100 supF | laboratory stock |
| XL1-Blue | E. coli K12 recAI endA1 gyrA96 thi-1 hsdR17 supE44 relA1 lac /F′ proAB lacI q Z Δ M15 ::Tn10 | Stratagene |
| Phage | ||
| λS+ | cI857 | laboratory stock |
| λCE6 | cI857 nin5 Sam7 int::T7 gene1 | 28 |
| Plasmids | ||
| pBSM13− | T7 and T3 promoters; ApR (pUC derivative) | Stratagene |
| pBS110 | Derivative of pBSM13−, SRRzgene cluster cloned under T7 transcriptional but cognate translational control | 1 |
| pBSS107 | Derivative of pBSM13−, S107M3LRRz cloned under T7 transcriptional but cognate translational control | 5,6,16 |
| pRG1 | Derivative of pBH20, SRRzgene cluster cloned under plac transcriptional but cognate translational control | laboratory stock; 11 |
| pJF118EH | tac promoter; ApR (pBR322 derivative) | laboratory stock; 9 |
| pRY93 | Derivative of pJF118EH, SRRz gene cluster cloned as EcoRI/HindIII fragment under ptac transcriptional but cognate translational control | laboratory stock |
| pLS157 | Derivative of pPLc236, SRRz gene cluster cloned under pL transcriptional but cognate translational control | laboratory stock; 2 |
| pET3a | Expression vector containing T7 promoter and ϕ10 ribosome binding site (pBR322 derivative) | Novagen; 21 |
| pET3S107 | S + gene cloned by NdeI/BamHI into pET3a | this work |
| pET3S105 | Same as pET3S107, but fused at Met3 | this work |
| pET3S107 m3l | Same as pET3S107, but carries S m3l allele | this work |
| pET11a | Expression vector containing hybrid T7-lacPO promoter, ϕ10 ribosome binding site, and lacl gene (pBR322 derivative) | Novagen |
| pET11S107 | S + gene cloned by NdeI/BamHI into pET11a | this work |
| pET11S105 | Same as pET11S107, but fused at Met3 | this work |
| pET11S107 m31 | Same as pET11S107, but carries S m31 allele | this work |
| Oligonucleotides | Sequence and Relevant Features | |
| RevSBam | cgggatccGACCACGCCAGCATAT | |
| Reverse primer anneals downstream of S (in R); creates a BamHI site to subclone the S gene | ||
| ForSwtNde | cgaattcatATGAAGATGCCAGAAAAACATGACC | |
| Forward primer anneals to S gene start; creates an NdeI site at the Metl codon to subclone S107(i.e., S +) | ||
| ForS107Nde | cgaattcatATGAAGcTGCCAGAAAAACATGACC | |
| Same as above, but alters S Met3 to Leu to subclone S107 m3l | ||
| ForS105Nde | cgaattcatATGCCAGAAAAACATGACCTG | |
| Same as above, but creates an Ndel site at the Met3 codon to subclone S105 | ||
| SeqpET | tgtaaaacgacggccagttaatacgactcactatagggg | |
| Forward primer anneals upstream of pT7-lac in pET vectors; contains Seqman priming site | ||
| ERevpET | gcggatccagggcgagcgcgctagttattgctcagcgg | |
| Reverse primer anneals upstream of T7 ϕ10 terminator in pET vectors; contains ERevBam priming site | ||
| Seqman | tgtaaaacgacggccagt | |
| Forward universal primer used for automated sequencing of PCR products | ||
| ERevBam | gcggatccagggcgagcgc | |
| Reverse universal primer used for automated sequencing of PCR products | ||
Letters in small case represent either mismatches or insertions, and new restriction sites are indicated by boldface.
DNA Manipulations
Restriction enzymes were purchased from Pro-mega (Madison, WI) and restriction of DNA was performed as per manufacturer’s instructions. Mini-preparations of plasmid DNA were obtained either by a standard alkaline lysis method (22) or with the Qiaprep Spin Miniprep Kit (QIAGEN, Santa Clarita, CA). Fragments from acrylamide gels were excised, macerated, and extracted with elution buffer (0.5 M ammonium acetate, 10 mM magnesium acetate, 1 mM EDTA, pH 8.0, 0.1% SDS) (22) by shaking 18 h at 37°C. Alternatively, DNA fragments excised from agarose gels were purified using Qiaex gel extraction spin columns (QIAGEN) as per manufacturer’s instructions. The Rapid DNA Ligation Kit from Boehringer Mannheim (Indianapolis, IN) was used with a ligation incubation period of 5 min at room temperature, as per manufacturer’s instructions. A standard calcium chloride procedure was used for E. coli competent cell preparation and transformation (22). The method of Chung et al. (7) was also used to produce competent cells for long-term storage at −80°C.
Amplification of DNA
Polymerase chain reaction (PCR) was employed to amplify DNA fragments for subcloning and automated fluorescent sequencing. Typical 100 μl PCR reactions contained 5 units of cloned Pfu DNA polymerase (Stratagene, La Jolla, CA), 1 × cloned Pfu DNA polymerase buffer, 20 mM deoxyribonucleotide triphosphates (dNTPs), and 0.5 μM each primer, forward and reverse. A standard program for amplification of 500 base pair (bp) sequence consisted of 32 cycles of 94°C (melting) for 1 min, 50°C (annealing) for 1 min, and 72°C (extension) for 2 min. PCR products were purified with QIAGEN PCR purification spin columns according to manufacturer’s instructions.
Automated Fluorescent Sequencing
Sequencing reactions were performed using the ABI Prism™ Dye Terminator Cycle Sequencing Ready Reaction Kit (Perkin-Elmer, Foster City, CA) as per manufacturer’s instructions for 10-μl reactions. The samples were run on an ABI 373A DNA Sequencer (Perkin-Elmer, Foster City, CA) by the Gene Technologies Laboratory in the Department of Biology at Texas A&M University and sequence data were analyzed using the ABI Sequencher™ software program. Templates were prepared by PCR amplification from plasmid or bacteriophage DNA (base pairs 45,186 to 45,506 of λ) with forward and reverse primers, SeqpET and ERevpET (Table 1). The amplification primers produced “landing sites” on the PCR products complementary to the respective sequencing primers. Seqman, also known as M13 universal primer, was used on PCR products amplified with SeqpET (Table 1). ERevBam was used for reverse direction sequencing on PCR products amplified with ERevpET (Table 1).
λCE6 Purification
Mini-lysates were made by infecting 0.1 ml of an overnight MS59 TBM culture with a single picked plaque at 25°C, diluting 30-fold with TB plus 10 mM MgCl2, and rolling with good aeration at 37°C for 5–6 h or until complete lysis occurred. The mini-lysate procedure was repeated using the first mini-lysate to infect at a multiplicity of infection (moi) of 0.03 to improve lysate titers. By the same procedure, the second mini-lysate was then used to prepare large-scale lysates (0.5–1.0 liter) by infecting MS59. Phage particles were pelleted from lysates in four 100-ml polyethylene tubes in a Beckman JA14 rotor at 16,000 × g for at least 12 h at 4°C. The concentrated phages were subjected to isopycnic cesium chloride (CsCl) density gradient centrifugation (0.83 g/ml in 10 mM MgSO4, 50 mM Tris-HCl, pH 7.5, 0.01% gelatin) at 45,000 rpm in a Beckman VTi 65.2 rotor for 16 h at 4°C. The white phage band was collected and dialyzed against 1 M NaCl in 10 mM MgSO4, 50 mM Tris-HCl, pH 7.5, 0.01% gelatin (SM) (22) for 2 h, against 0.1 M NaCl in the same medium for 2 h, and finally against the SM medium alone for 2–4 h, to remove CsCl and avoid osmotic shock of phage particles. The concentrated phage was stored in SM at 4°C at a titer of approximately 1012 plaque forming units per milliliter (pfu/ml).
Pulse Labeling
The culture growth for E. coli MC4100 carrying pBS- or pET3a-derived S clones followed Studier and Moffatt (28) with minor modifications. The culture was inoculated at A600 = 0.04 and aerated at 30°C in M9 maltose medium supplemented with Ap. Glucose was added to a final level of 0.4% when A600 reached 0.3 and the cultures were shifted to 37°C for another 1.5 h to reach a cell density of 5 × 10⁸ cells/ml. MgCl2 was added to a final concentration of 10 mM followed by CsCl-purified λCE6 phage at an moi of 5. For the time course pulse labeling experiment, 0.5-ml culture was taken at various times after λCE6 infection and labeled with 10 μCi [35S]methionine at 37°C for 5 min. The reactions were stopped by removing samples onto ice immediately after labeling. After cells were spun down, the pellets were resuspended in 1 × sample buffer and boiled for 3 min. One third of each sample was used for SDS-PAGE.
Pulse-Chase Labeling
The λCE6 infection was performed as described above. However, for pulse-chase labeling experiments, at 20 min after λCE6 infection, 5-ml aliquots of cell culture were labeled with 100 μCi [35S]methionine for 10 min, and then chased with 0.1% unlabeled methionine solution and 0.06 mg/ml chloramphenicol dissolved in M9 medium. Samples were withdrawn at various times after labeling and prepared for SDS-PAGE as described above.
Induction of pET11 Clones of the S Gene
The plasmid, pET11a (Novagen, Madison, WI) and derivatives with Sinserts (see Table 1) were grown and induced as follows. Fresh transformants were inoculated into 1–5 ml LB media supplemented with Ap (100 μg/ml) and aerated at 37°C to an A550 not exceeding 0.8. The cultures were then subcultured into larger volumes (25–50 ml) of the same media. Upon reaching an A550 = 0.8, cultures were induced by adding the allosteric inducer, isopropyl-β-d-thiogalactopyranoside (IPTG) to a final concentration of 1.0 mM and continuing incubation at 37°C for the remainder of the experiment. Viability was assessed by serially diluting small aliquots at defined intervals pre- and postinduction and plating for survivors on selective (Ap) noninducing medium at 37°C.
Photomicroscopy
Images of cells were obtained using a Nikon Optiphot phase contrast microscope (Nikon Inc., Instrument Group, Melville, NY) equipped with a Nikon HFX automatic exposure system, and a Polaroid camera (Polaroid Corp., Cambridge, MA) mounted to the microscope with a 4 × camera adapter. Images were acquired by oil immersion using a Plan 100 DL objective with a phase contrast setting of 4 using Polaroid 667 black and white instant film.
Membrane Protein Sample Preparation
Cells were harvested by low-speed centrifugation (10,000 × g, Beckman JA20, 4°C), resuspended in French press buffer [100 mM sodium phosphate, pH 7.0, 100 mM KC1, 5 mM ethylene-diaminetetraacetic acid (EDTA), 1 mM dithiothreitol (DTT), 1 mM phenylmethylsulfonyl fluoride (PMSF)] at one hundredth the original culture volume, and disrupted in a French pressure cell at 16,000 psi. The resultant inside-out vesicles were collected by centrifugation for 1 h at 100,000 × g at 18°C (38,000 rpm/Beckman Ti50.1 or 55,000 rpm/Beckman TLA100.3). Membrane pellets were subjected to differential solubilization in membrane extraction buffer (1% Triton X-100, 10% glycerol, 20 mM Tris-HCl, pH 8.0, 0.5 M NaCl, 35 mM MgCl2) (17,24) for 2–18 h at 37°C with shaking. Detergent-insoluble material was removed by centrifugation at 100,000 × gfor 45 min to produce a detergent-solubilized preparation of inner membrane proteins.
SDS-PAGE
Protein samples were routinely analyzed by Tris/Tricine 16.5% sodium dodecyl sulfate-polyacrylamide gel electrophoresis (SDS-PAGE) according to the method of Schägger and von Jagow (23). Eight to 25% gradient PhastGels (Phast system; Pharmacia, Piscataway, NJ) and 16% Tris/Tricine precast gels (Xcell II Minicell; Novex, San Diego, CA) were also used routinely. The method of Wessel and Flügge (30) was used to remove lipopolysaccharide (LPS) from samples in which it was known to obscure S105 due to equivalent mobilities on SDS-PAGE. Proteins were visualized by staining with Coomassie blue in 10% acetic acid and then destaining with 30% methanol, 10% acetic acid. Gels were fixed in 20% methanol, 5% glycerol, and dried between two sheets of cellulose (Promega).
In some cases, glycine-SDS-PAGE was performed on 40-cm-long gels to enhance resolution of low molecular mass species. The resolving gel consisted of 17.5% total acrylamide (30:0.8 acryl-amide/bis-acrylamide), 1 M Tris, pH 8.8, and 0.1% SDS. The stacking gel consisted of 3.85% (30:0.8) acrylamide, 0.125 M Tris, pH 6.8, and 0.1% SDS. Running buffer contained 0.2 M glycine, 0.05 M Tris, and 0.1% SDS. Gels were loaded and subjected to 250 volts for approximately 18 h, or about 4000 accumulated volt hours, never exceeding 30 mA. Proteins were visualized with Coomassie blue as previously described.
Western Blotting and Immunodetection
For immunodetection of S protein, extracts and prestained molecular mass standards (Gibco BRL, Gaithersburg, MD) were resolved on 16.5% Tris/ Tricine gels as above. Proteins were then transferred to 0.1 μm nitrocellulose (Schleicher & Schuell, Keene, NH) and developed as described by Towbin et al. (29). Images of blots and stained acrylamide gels were digitally recorded with a Hewlett-Packard ScanJet IIcx scanner (Palo Alto, CA). Quantitative analysis of gel and immunoblot data was performed using the image analysis program NIH Image (version 1.54) public domain software suite (W. Rasband, National Institutes of Health; wayne@helix.nih.gov).
Fluorescence Quenching
Inverted membrane vesicles (IMVs) obtained from cells containing S protein were analyzed for their ability to maintain a membrane potential based on the fluorescence quenching assay of Monticello and Brusilow (15). IMVs were prepared from induced BL21 (DE3) cells harboring pET11a vector, pETHS107, or pETHS105 as follows. Cultures (150 ml) were induced and cells were harvested, resuspended in 1.5 ml of 50 mM 3-[N-morpholino]propanesulfonic acid (MOPS), 10 mM MgCl2, pH 7.0 (M&M buffer), and disrupted in a French pressure cell at 16,000 psi. Unbroken cells and large debris were removed by low-speed centrifugation and IMV were collected by centrifugation at 100,000 × g(Beckman TLA100.3, 60,000 rpm, 60 min, 4°C). The IMV pellet was resuspended and washed in 100 ml M&M buffer and centrifugation was repeated. The IMV were finally resuspended at a final protein concentration of 20–40 mg/ml in M&M buffer (ca. 200 μl final volume) as determined by the Bio-Rad protein assay (Hercules, CA).
The fluorescence assays were performed in an SLM-Aminco AB2 Fluorescence spectrophotometer (Spectronic Instruments, Rochester, NY) in a stirred 2-ml quartz cuvette as follows. Twenty to 40 μl of IMVs (0.5 mg protein) was added to 2 ml of fluorescence quenching (FQ) buffer (20 mM Tris-HCl, pH 7.8, 200 mM KC1, 5 mM MgSO4). The solution was adjusted to 5 μM 9-aminoacridine (9AA) by the addition of 1 mM 9AA in 100% ethanol. A stable fluorescent signal was obtained by exciting the sample with 410 nm light and observing light emission at 490 nm. This signal was defined as 100% relative fluorescence. 9AA fluorescence is extremely sensitive to membrane potential (26). Quenching of the fluorescent signal was achieved by energizing the membranes with 0.5 mM adenosine 5′-triphosphate (ATP) as a substrate for the F0F1 ATPase or with 0.5 mM β-nicotinamide adenine dinucleotide reduced form-(NADH) as a substrate for NADH oxidase (12,15). ATP and NADH were added as 50 mM stocks in 20 mM Tris-HCl, pH 8.0, or M&M buffer, respectively. In the control IMVs, the generation of a membrane potential by either method resulted in a quenched signal arbitrarily defined as 0% relative fluorescence. Any quenching induced by ATP or NADH could be immediately relieved by addition of 10 mM NH4Cl or 1 mM KCN, respectively. Fluorescence was monitored over a period of 5–15 min and data were collected and plotted as relative fluorescence versus time.
RESULTS
S Levels at Time of Lysis
In the course of our analysis of the role of the S105 and S107 proteins in the scheduling of lysis, constructs with the S gene under the control of various promoters had been prepared. By Western blotting, we determined that the amount of S protein present in the membranes of cells lysed by induction of these clones was approximately constant, within a factor of two (Table 2). In none of these cases was sufficient S protein synthesized to appear as a prominent Coomassie blue-detectable band in SDS-PAGE analysis. These findings are consistent with the conclusions of Chang et al. (6), who, based on an analysis of lysis caused by induction of constructs in pL vector plasmids, concluded that the onset of lysis begins when a certain quantity of the S105 lysis effector accumulated in excess of the S107 inhibitor. In any case, the purification of biochemically useful amounts of functional S protein was impractical under all of these conditions.
TABLE 2.
RELATIVE AMOUNTS OF S PROTEIN PRESENT IN VARIOUS MEMBRANES
| Strain | Promoter and Lysis Genotype | S |
|---|---|---|
| λS + | λcI857sdi sdi + S + R + Rz + | 1.0 |
| pRGl | plac sdi + S + R + Rz + | 2.0 |
| pRY93 | ptac sdi + S + R + Rz + | 1.8 |
| pLS157 | p1 sdi + S + R + Rz + | 1.1 |
| pBS110 | pT7 sdi + S + S + R + Rz + | 1.8 |
The relative amount of S protein present in the membranes of cells lysed by induction of the listed lytic vector was determined by Western blotting. All values are normalized to the amount of S, both S105 and S107 forms, produced in thermally induced lysogens of λ cI857S +. In all cases listed above, the cognate sdi “dual start” motif of the wild-type S gene was present (1,3,19).
S Fused to T7 ϕ10 Ribosome Binding Site Leads to Production of Coomassie Blue-Detectable Quantities of Holin
It was hypothesized that an increase in S accumulation in excess of the normal lethal concentration might be achieved if expression were raised to levels that might sequester a substantial proportion of S protein intracellularly as denatured material in inclusion bodies (8). The complex transitional initiation region of S, defined by the presence of the two start codons, two secondary structure elements, and also upstream RNA sequences (1,2,6,18,19), is extremely inefficient (6,33), such that even very high-level transcription of the lysis genes from a T7 RNA polymerase promoter fails to result in significant accumulation of S protein (Fig. 1, Table 2). To eliminate these factors in the expression of 5, the entire 5 reading frame, beginning with the codon 1 AUG, was fused directly to the efficient ribosome binding site of the T7 ϕ10 capsid protein gene in the pET3a expression vector (Novagen), resulting in pET3S107 (Fig. 1). To permit expression of the lysis effector in absence of the inhibitor, a second construct was prepared in which codon 3 (AUG), the start codon for S105, was used, resulting in pET3S105 (Fig. 1).
We suspect that pET3S107 might produce a mixture of S107 and S105, because the second start codon is in such close proximity. To obtain a construct in which the S107 inhibitor form could be produced free of S105, pET3S107m3l was prepared (Fig. 1). These plasmids were constructed in hosts lacking the T7 gene 7. Transformation of these constructs into the standard BL21 (DE3) host, which has T7 gene 1 under lacUV5 control, was uniformly unsuccessful (C.-Y. Chang and R. Young, unpublished data). This indicated that the basal level of T7 RNA polymerase in this background caused sufficient expression of S to be toxic. Expression of these constructs was achieved by infecting the primary hosts with λCE6, a transducing phage carrying T7 gene 1(28). Cultures carrying the S constructs stopped accumulating culture mass soon after infection with λCE6 (by 15 min for pET3S105 and by 26 min with pET3S107) and then exhibited a gradual loss of turbidity (Fig. 2). Microscopic examination of these cultures revealed that the loss of turbidity was accompanied by a conversion of normal rod-shaped morphology to spherical structures, which gradually lost refractility (not shown). This morphological transition occurs for both the pET3S105 and pET3S107, although significantly more slowly and less drastically for the S107 construct. This phenotype has been observed for infections of λRz in the presence of millimolar concentrations of divalent cations (32), and also for the equivalent mutants of phage P22 in infections of Salmonella typhimurium (4). The conditions used here for expression of the pET3 S clones did include the requisite divalent cation (10 mM Mg2+). Although the infecting phage were genotypically Rz +,presumably the level of expression of the phage late genes is greatly suppressed by the dominant activity of the T7 RNA polymerase on the multicopy plasmid templates.
FIG. 2.
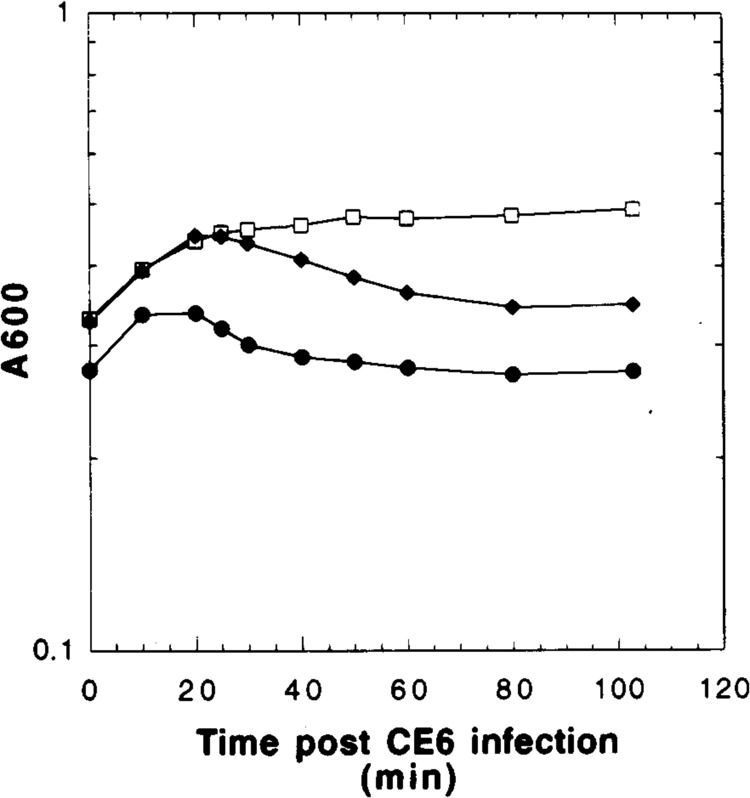
λCE6 infection profiles of MC4100 harboring pET3a clones. A600 values plateau between 30 and 40 min postinfection in the vector control, pET3a (□), whereas both pET3S107 ( ) and pET3S105 (•) display gradual decreases in absorbance.
Cells carrying the vector showed no such morphological change or loss of turbidity, although growth is significantly inhibited after infection (Fig. 2). Similar results were found for infections done in minimal medium, except that the loss of turbidity begins about 10 min later for each infection. Pulse labeling of the infected pET3S105 cultures in minimal medium revealed that the S105 species reaches a peak of synthesis at about 10 min before the loss of turbidity begins and then rapidly declines (Fig. 3). Pulse-labeled samples from the infected pET3S107 cultures showed only S107 being made, reaching a maximum synthesis rate at about the same time as for S105 in the pET3S105 culture, but continuing for much longer and declining only gradually after 50 min of infection (Fig. 3).
FIG. 3.
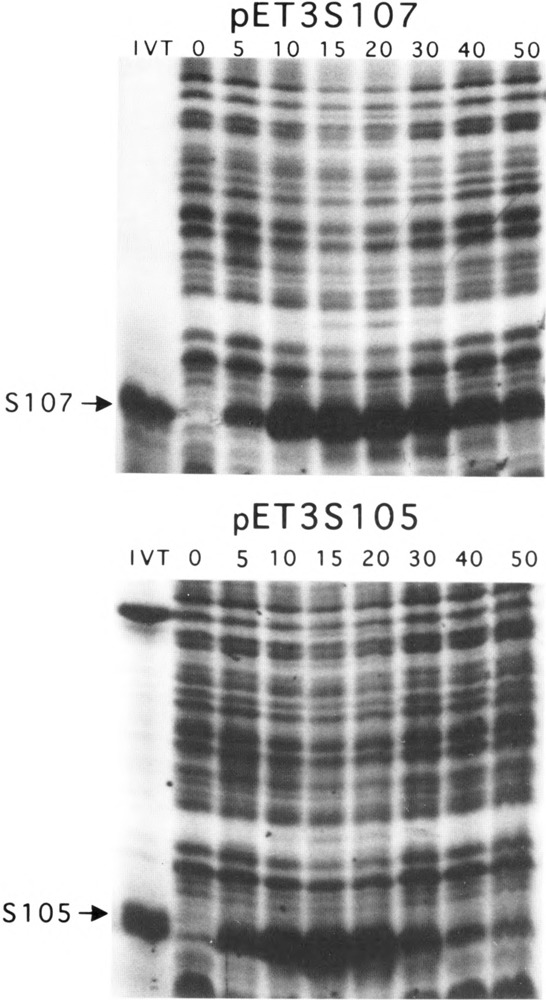
[35S]Methionine pulse labeling analysis of S gene expression from pET3 constructs. The first lane in the upper panel (pET3S107) contains in vitro-translated (IVT), radiolabeled S protein from pET3S107. The same lane in the lower panel (pET3S105) corresponds to IVT S protein from pBS110 (6). The second lanes represent preinfection labeling and are denoted by a zero. Subsequent lanes are denoted as to postinfection addition of label by the times indicated in minutes.
Triton-soluble membrane extracts of these cells were analyzed by Tris/Tricine-SDS PAGE. Coomassie blue-detectable bands with the expected mobilities of SI07 and SI05 were seen in these extracts, but not in the vector samples (Fig. 4A). No Coomassie blue-detectable material of the mobility of S105 was detectable in the pET3S107 sample, indicating that the efficient Shine-Dalgarno sequence of T7 gene 10 predominantly directs initiations to codon 1, despite the presence of another AUG codon at position 3. Densitometric analysis of the stained gels was performed, using a panel of standard proteins as a Coomassie blue reference (data not shown). Assuming that S protein stains with Coomassie blue within the range of intensities observed for the panel of standard proteins, the yield of S105 protein could be estimated at approximately 1.1 μg per ml of induced culture for the pET3S105 construct. This represents approximately 105 S molecules per induced cell. By comparison, the amount of S protein detected in the membranes of the lysed cells after induction of an S +lysogen was approximately 103 molecules per cell, as judged by comparative Western blotting (Table 1). Thus, relative expression of S in the pET3a system versus previous systems was about two orders of magnitude higher (Fig. 4B).
FIG. 4.
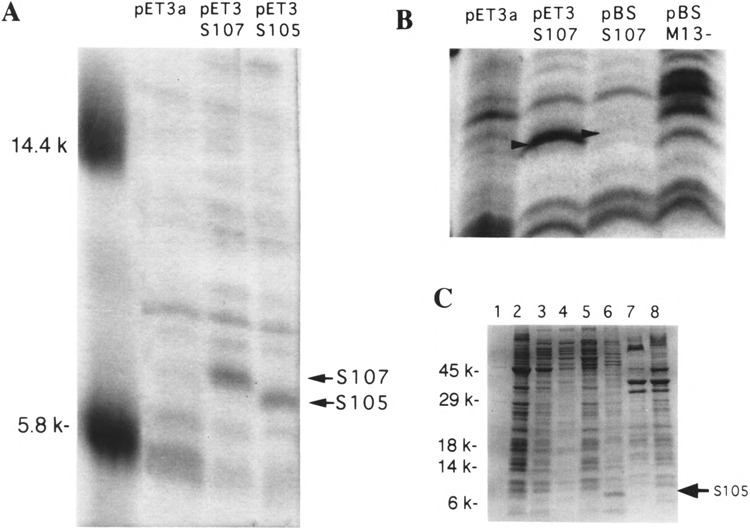
Coomassie blue-stained SDS-PAGE. (A) Visible bands for S105 and S107 (glycine buffer system). pET3 clones were induced, membranes were collected, and proteins were extracted with 1% Triton X-100 and resolved by glycine SDS-PAGE as described in Materials and Methods. Lane 1 contains molecular weight markers with masses denoted on the left. Lanes 2–4 correspond to vector, S107, and S105, respectively. (B) Comparison of amounts of S107 accumulated in pET3S107 and pBS107 inductions. Whole-cell samples were resolved by glycine SDS-PAGE and visualized with Coomassie blue. Lanes 1 and 4: induced vector samples for pET3a and pBSM13−, respectively; lane 2: pET3S107; lane 3: pBSS107. (C) Localization of hyperexpressed S105. Molecular mass is indicated on the left. Lanes 1, 3, 5, and 7: samples obtained from induction of BL21 (DE3) pET11a; lanes 2, 4, 6, and 8: induction of BL21 (DE3) pETHS105. Lanes 1 and 2 represent the pellets obtained from the low-speed centrifugation step to isolate inclusion bodies. Lanes 3 and 4 represent the supernatants (cytoplasmic and periplasmic fractions) from the 100,000 × g centrifugation step to isolate total membranes. Lanes 5 and 6 correspond to the Triton-magnesium-solubilized membrane pellets. Lanes 7 and 8 represent the delipidated, LPS-deficient, Triton-insoluble fraction, obtained by methanol/chloroform extraction of the pellet from the Triton solubilization procedure. The arrow indicates the position of S105 (seen predominantly in lane 6).
Hyperaccumulation of S Protein
We hypothesized that the rate of S protein production in the pET3a system was no longer the rate-limiting step in the S-mediated lethality, which limits accumulation of S protein. To address this question, it was necessary to have plasmid constructs capable of equivalently high level of Sexpression but not requiring infection by the λCE6 transducing phage, which would itself be lethal. We took advantage of the plasmid vector pET11a, which is under more stringent control by virtue of the hybrid T7lac promoter and a copy of the lacI gene in cis to the expression site on the plasmid (21). Constructs pETHS107, pETHS105, and pET11S107m3l, analogous to the pET3a constructs, were prepared in a host lacking T7 gene 1 (Fig. 1). Introduction of these plasmids into BL21 (DE3) yielded transformants with distinctive plate phenotypes. Transformants with the pET11S105 plasmid formed colonies that exhibited a viscous morphology and rapidly died on plates, indicating that, even with the pET11a negative control system, the basal level of production of the S105 protein was very lethal to cells late in colony growth conditions. However, fresh transformants of pET11S105 could be grown in liquid culture. Western blot analysis of detergent solubilized membrane samples prepared from uninduced cultures revealed that detectable levels of S protein were present for all three constructs (data not shown).
Induction of these constructs in broth yields, for all three S constructs, a relatively short period when the culture mass continued to increase, after which a gradual loss of A550 is observed (Fig. 5). By 1 h after induction, a dramatic change in the refractility of the cells was noted by phase contrast microscopy, with the pETS105 cells becoming uniformly nonrefractile and both pETS107 and pETS107m3l cells also becoming translucent, although less uniformly (Fig. 6). No spherical forms or lysed cells were detected, as expected, because endolysin and Rz genes are not induced (32). In contrast, cells carrying the vector plasmid suffer a reduction in growth rate after induction, presumably as result of the exceedingly high level of transcription by T7 RNA polymerase, with no change in cellular morphology or refractility. Remarkably, although culture mass continues to increase for 10–15 min after induction for the S clones, viability drops nearly five orders of magnitude within 5 min for the induced pET11S105 cells (Fig. 5). Killing is slower for the pET11S107m3l construct (100-fold in 5 min), and slower still for the pET11S107 construct (30-fold in 5 min), but in both cases viability ultimately is reduced to less than 0.1% at 1 h after induction. We conclude that under hyperexpression conditions, the S107 protein, which acts as a nonlethal inhibitor of S105 function under physiological conditions (1), can act as a lethal holin, apparently forming the same kind of membrane lesions that allow loss of intracellular contents, as detected by loss of refractility. Moreover, the M3L change apparently somewhat increases the lethality of the SI07 molecule, at least under hyperexpression conditions.
FIG. 5.
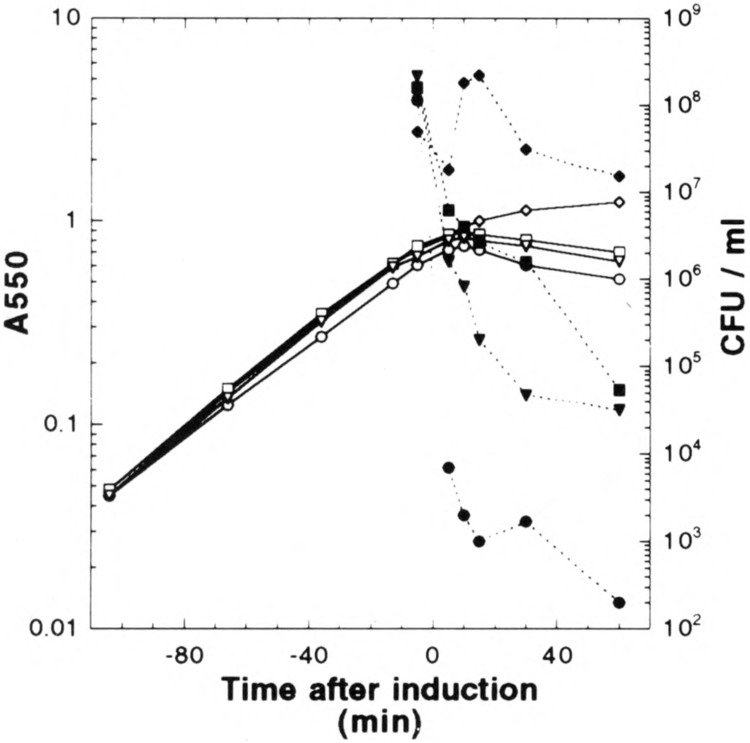
Profiles of BL21 (DE3) pET11 inductions. Growth curves are indicated by open symbols and viability curves are denoted with filled symbols. Cells harboring the plasmids pET11a (♦,◊), pET11S107 (▪, □), pET11S107m3l (▾, ▿), and pET11S105 (•, ○) were induced at time zero and followed for 1 h. Initial viability dilution and plating were performed 2 min prior to induction.
FIG. 6.
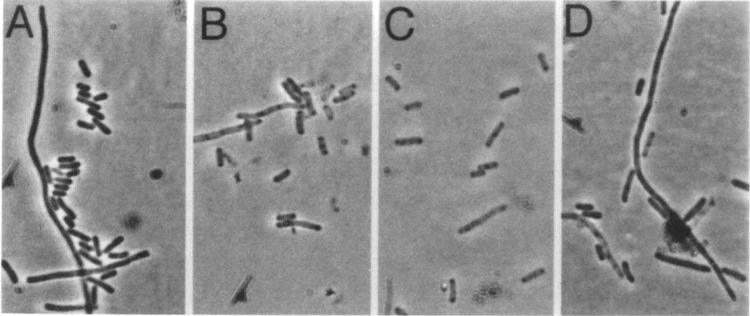
Phase contrast micrographs depicting cell morphologies of induced pET11a derivatives. (A), (B), (C), and (D) represent BL21 (DE3) harboring the plasmids pET11a, pETHS105, pETHS107, and pET11S107m3l, respectively. At 1 h postinduction, cells harboring the vector, pET11a, appear dense and retractile. In contrast, cells containing overexpressed S105, and to a lesser extent S107 or S107m3l, appear translucent and nonrefractile.
Subcellular Localization of S Protein
The yield and subcellular localization of S protein was determined for the pET11 inductions by differential sedimentation and detergent solubilization of lysates produced by passage through a French pressure cell. The crude lysate from the pETHS105 induction, but not the pET11a vector control, was cloudy, and inspection of these samples by phase contrast microscopy revealed the presence of large numbers of irregular-shaped particles approximately one tenth the size of E. coli cells, which were presumed to be inclusion bodies (data not shown). Surprisingly, however, when the inclusion bodies were harvested by low-speed centrifugation and analyzed by SDS-PAGE, they were found to contain only a minor amount of S, if any (Fig. 4C, lane 2). (The minor amount detected may in fact be present in the small numbers of unlysed cells, which persist in the lysate.) Instead, multiple protein species are present, and the SDS-PAGE staining profile was very similar to that of the soluble fraction from the vector sample (compare lanes 2 and 3 of Fig. 4C). This suggests that much of the soluble protein component of the pET11S105 sample was segregated into the inclusion bodies, a notion supported by the depletion of soluble species in these cells (Fig. 4C, lane 4). The great bulk of S protein was found in the inner membrane fraction, as determined by detergent solubilization in the presence of MgCl2 to stabilize the outer membrane component (Fig. 4C, lane 6). Thus, the unexpected overaccumulation of S protein far beyond its lethal limits is not due to a sequestration of the bulk of S into insoluble and inactive aggregates.
Assessing Permeability of Membranes After Hyperexpression
The state of membranes containing hyperexpressed levels of S protein was assessed by generating IMVs from the induced cells and performing fluorescence quenching assays. When exposed to 9AA, IMVs from induced cells harboring pET11a, pET11S107, and pETHS105 all displayed a characteristically intense fluorescent signal (Fig. 7). Upon addition of ATP or NADH, the pET11a IMV fluorescent signal was completely quenched, reflecting the hydrolysis of ATP or oxidation of NADH, concomitant transfer of protons into the vesicles, and subsequent rapid quenching of the membrane-associated fluorophore, 9AA. Fluorescence was restored by addition of a proton pump inhibitor (NH4Cl) or an energy poison (KCN). IMVs harboring S105 protein exhibited less than 5% quenching when exposed to ATP or NADH (Fig. 7), suggesting that protons pumped into the vesicles by the F1F0 ATP synthase or cytochrome oxidase could not be retained, but immediately diffused out of the vesicles. This is direct evidence that S protein accumulated in the cytoplasmic membrane is functional even after cellular disruption, at least to the extent that lesions still exist in these membranes that can destroy the permeability barrier to protons. The fluorescence signal from IMVs containing S107 was quenched approximately 50% by addition of ATP and NADH. This partially quenched signal was restored by addition of the inhibitors, NH4Cl and KCN.
FIG. 7.
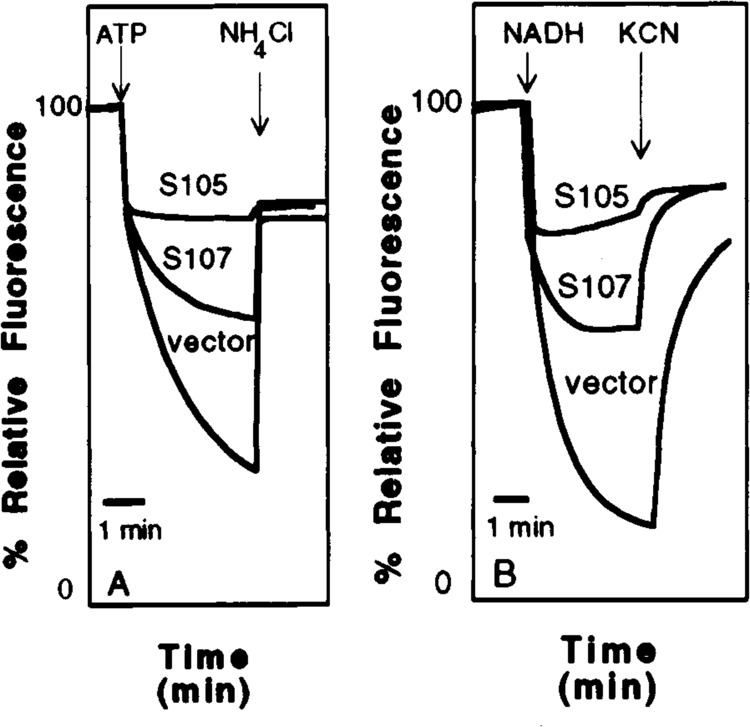
Fluorescence quenching analysis of membranes containing S. Vesicles were prepared from induced BL21 (DE3) cells harboring the pET11a vector, pET11S107, and pET11S105 as described in Materials and Methods. Membranes from the vector-containing cells displayed optimal fluorescent quenching when treated with ATP (A) and NADH (B), indicating sealed membrane structures capable of supporting a membrane potential or proton gradient. This signal was defined arbitrarily as 0% relative fluorescence. Fluorescence is restored to approximately 75% by addition of 10 mM NH4C1 (A) or 1 mM KCN (B). By comparison, vesicles containing S107 were approximately twofold less quenchable, which could be relieved as with the vector controls. S105-containing membrane vesicles failed to support a significant membrane potential.
DISCUSSION
Overview
We have constructed plasmid clones in which the S gene encoding the X holin is placed under the powerful T7 class III promoter and the perfectly consensus ϕ10 translational initiation site. Basal level expression of the version of this construct carrying the S105 reading frame, beginning with codon Met3, is highly toxic, so much so that transformant colonies only a few hours old rapidly lose viability and change morphology. Induction of the S105 clone is rapidly lethal, with more than five orders of magnitude of killing, as defined by loss of colony-forming units, by 5 min after induction (Fig. 5). Surprisingly, both S107 and S107m3l alleles in isogenic constructs also cause rapid lethality, with 95–99% of cells nonviable after 5 min of induction. Thus, at very high levels of synthesis, S107 is capable of quantitative lethality, despite its inhibitory role under physiological conditions. IMVs containing S107 appear to be reduced in their capacity to maintain a membrane potential according to the fluorescent quenching data. It is unclear whether this result reflects the state of the S107-dependent holes or the distribution of S107 in the population of vesicles. S105-containing IMVs, on the other hand, are incapable of establishing or maintaining a significant proton gradient, suggesting that the S “hole” are present in all vesicles.
Heretofore, S protein could not be readily visualized by Coomassie blue after normal S-mediated lethality in the plasmid or phage contexts. In all of the pET constructs, we find that S105 or S107 protein accumulates to Coomassie blue-detectable quantities. To our knowledge, this is the first time that the accumulation of biochemically useful quantities of a holin protein has been reported and suggests that purification and functional analysis of the λ holin may be feasible. In principle, the same kind of protocol could be applied to any of the many different holin proteins currently known (3,31).
Triggering of S Lethality as a Function of Concentration
The most surprising aspect of this work is the fact that under these hyperexpression conditions, the amount of S present in the membrane of the killed cells is nearly two orders of magnitude higher than in membranes from cells lysed by λ phage or by induction of lysis genes expressed from σ 70-dependent promoters and under the control of the cognate ribosome binding sites. The simplest interpretation is that, although the amount of S normally required to trigger hole formation and consequent physiological death is synthesized within seconds, nevertheless, at this rate of synthesis, the supply of S is no longer limiting for S-mediated lethality. Presumably, steps involving aggregation and conformational changes within the inner membrane bilayer must take place, and that process cannot occur any faster than about 10 min after induction, irrespective of the concentration of S. Viability is lost much more quickly because once a cell has produced a certain amount of S, it is committed to cell death. However, during the delay mandated by the putative “hole formation” step within the membrane, detectable quantities of S protein accumulate. This interpretation is consistent with the results of Chang et al. (6), who found inverse dependence of lysis time on the amount of S105 protein in excess of S107, with the curve monotonically approaching approximately 10 min. Although the system used for that work was different, a pL-mediated thermoinducible vector for the expression of the S alleles, ultimately the minimum time to “hole formation” after induction of an S gene appears to be independent of the expression system and thus probably reflects a rate-limiting step that is independent of the rate of supply of S monomers to the membrane.
In the process of subcellular localization it was discovered that hyperexpression of S protein induced the formation inclusion bodies. Surprisingly, however, S localized completely to the membrane, and little if any S was found in the inclusion bodies. We are aware of no precedent for such a phenomenon. According to the current model, S creates holes in the inner membrane sufficiently large to allow endolysin indiscriminate transit into the periplasm as a fully folded enzyme. We suspect that such a serious membrane insult results in abnormal oxidative, ionic, and osmotic conditions being imposed in the cytoplasm in an extremely saltatory fashion, which leads to large-scale aggregation of cytoplasmic proteins.
The fact that both S107 clones also cause lethality and the characteristic nonrefractile cellular morphology is also unexpected. Furthermore, the fluorescence quenching data indicate that S107 is capable of causing lesions at least large enough to allow the release of protons. Paradoxically, it appears that at rates of expression that allow cells to accumulate 100-fold higher than normal levels of S, the S107 protein loses its inhibitor function, becoming capable of the lethal, hole-forming step normally effected by S105. The S107 protein is identical to S105 except for its two N-terminal residues, and it has been demonstrated that the operational difference that confers the inhibitor capacity on S107 is the positively charged lysine residue at position 2 (1). Moreover, when S107 was provided in trans to an S + allele in sufficient quantity to block lysis and then the cells were treated with cyanide as an external trigger, the rate of lysis was more rapid than with the wild-type allele alone, indicating that the S107 protein could participate in hole formation (1). The picture that emerges is that S107 is a much less active form of S105, with dominant character. Under normal rates of S expression and in the context of the time scale of the normal lambda vegetative cycle, S107 functions as an inhibitor, possibly because its intrinsic propensity for hole formation is so low that it poisons the process of assembly of the oligomeric structures, which must be on the hole formation pathway. Interestingly, S107m3l appears to be more lethal than S107 at these nonphysiological levels of expression. This may represent an extension to the findings of Bläsi et al., who found that charge changes in the N-terminal region of S resulted in phenotypes similar to that of S107 (27). That is, in general, changes that increase positive charge retard the onset of lysis after induction of the S gene, whereas changes that increase negative charge accelerate the onset of lysis. The simplest interpretation of the increased lethality of M3L is that increasing the hydrophobic character of the residue at position 3 makes the protein more lethal. Taken together, these findings can be taken as support for the notion that the N-terminus must traverse the membrane bilayer at some point in the hole formation pathway. In any case, the ability to accumulate the S protein in the membrane to levels orders of magnitude higher than the normal lethal level of S makes it feasible to begin developing an in vitro system for the study of the lysis phenomenon at the molecular level. Experiments in this line are underway in this laboratory.
ACKNOWLEDGMENTS
We thank Bill Brusilow for his assistance with the fluorescence quenching assay, George Han for his help with the inductions and viability assays, Sharyll Pressley for her usual competent clerical assistance, and all the members of the Young laboratory, past and present, for their encouragement and constructive criticism. This work was funded by grant GM27099 from the National Institute of General Medical Sciences, National Institutes of Health, to R.Y. and by funds from the College of Agriculture at Texas A&M University.
REFERENCES
- 1. Bläsi U.; Chang C.-Y.; Zagotta M. T.; Nam K.; Young R. The lethal lambda S gene encodes its own inhibitor. EMBO J. 9:981–989; 1990. [DOI] [PMC free article] [PubMed] [Google Scholar]
- 2. Bläsi U.; Nam K.; Hartz D.; Gold L.; Young R. Dual translational initiation sites control function of the lambda S gene. EMBO J. 8:3501–3510; 1989. [DOI] [PMC free article] [PubMed] [Google Scholar]
- 3. Bläsi U.; Young R. Two beginnings for a single purpose: The dual-start holins in the regulation of phage lysis. Mol. Microbiol. 21:675–682; 1996. [DOI] [PubMed] [Google Scholar]
- 4. Casjens S.; Eppler K.; Parr R.; Poteete A. R. Nucleotide sequence of the bacteriophage P22 gene 19 to 3 region: Identification of a new gene required for lysis. Virology 171(2):588–598; 1989. [DOI] [PubMed] [Google Scholar]
- 5. Chang C-Y. Synthesis, function and regulation of the lambda holin. Ph.D. dissertation; 1994. [Google Scholar]
- 6. Chang C.-Y.; Nam K.; Young R. Sgene expression and the timing of lysis by bacteriophage lambda. J. Bacteriol. 177:3283–3294; 1995. [DOI] [PMC free article] [PubMed] [Google Scholar]
- 7. Chung C. T.; Niemela S. L.; Miller R. H. One-step preparation of competent Escherichia coli: Transformation and storage of bacterial cells in the same solution. Proc. Natl. Acad. Sci. USA 86:2172–2175; 1989. [DOI] [PMC free article] [PubMed] [Google Scholar]
- 8. Fischer B.; Sumner I.; Goodenough P. Isolation and renaturation of bio-active proteins expressed in Escherichia coli as inclusion bodies. Arzneimittelforschung 42:1512–1515; 1992. [PubMed] [Google Scholar]
- 9. Fürste J. P.; Pansegrau W.; Frank R.; Blöcker H.; Scholz P.; Bagdasarian M.; Lanka E. Molecular cloning of the plasmid RP4 primase region in a multi-host-range tacP expression vector. Gene 48:119–131; 1986. [DOI] [PubMed] [Google Scholar]
- 10. Garrett J.; Bruno C.; Young R. Lysis protein S of phage lambda functions in Saccharomyces cerevisiae . J. Bacteriol. 172:7275–7277; 1990. [DOI] [PMC free article] [PubMed] [Google Scholar]
- 11. Garrett J.; Fusselman R.; Hise J.; Chiou L.; Smith-Grillo D.; Schulz R.; Young R. Cell lysis by induction of cloned lambda lysis genes. Mol. Gen. Genet. 182:326–331; 1981. [DOI] [PubMed] [Google Scholar]
- 12. Hartzog P. E.; Cain B. D. Mutagenic analysis of the alpha subunit of F1F0 ATP synthase in Escherichia coli: Gln-252 through Tyr-263. J. Bacteriol. 175:1337–1343; 1993. [DOI] [PMC free article] [PubMed] [Google Scholar]
- 13. Johnson-Boaz R.; Chang C.-Y.; Young R. A dominant mutation in the bacteriophage lambda S gene causes premature lysis and an absolute defective plating phenotype. Mol. Microbiol. 13:495–504; 1994. [DOI] [PubMed] [Google Scholar]
- 14. Miller J. H. A short course in bacterial genetics: A laboratory manual and handbook for Escherichia coli and related bacteria. Cold Spring Harbor, NY: Cold Spring Harbor Laboratory Press; 1992. [Google Scholar]
- 15. Monticello R. A.; Brusilow W. S. A. Role of the delta subunit in enhancing proton conduction through the F0 of the Escherichia coli F1F0 ATPase. J. Bacteriol. 176:1138–1389; 1994. [DOI] [PMC free article] [PubMed] [Google Scholar]
- 16. Nam K. Translational regulation of the S gene of bacteriophage lambda. Ph.D. dissertation; 1991. [Google Scholar]
- 17. Osborn M. J.; Gander J. E.; Parisi E. Mechanism of assembly of the outer membrane of Salmonella typhimurium.Site of synthesis of lipopolysaccharide. J. Biol. Chem. 247:3973–3986; 1972. [PubMed] [Google Scholar]
- 18. Raab R.; Neal G.; Garrett J.; Grimaila R.; Fusselman R.; Young R. Mutational analysis of bacteriophage lambda lysis gene S . J. Bacteriol. 167:1035–1042; 1986. [DOI] [PMC free article] [PubMed] [Google Scholar]
- 19. Raab R.; Neal G.; Sohaskey C.; Smith J.; Young R. Dominance in lambda S mutations and evidence for translational control. J. Mol. Biol. 199:95–105; 1988. [DOI] [PubMed] [Google Scholar]
- 20. Rennell D.; Poteete A. R. Phage P22 lysis genes: Nucleotide sequences and functional relationships with T4 and lambda genes. Virology 143:280–289; 1985. [DOI] [PubMed] [Google Scholar]
- 21. Rosenberg A. H.; Lade B. N.; Chui D.-S.; Lin S.-W.; Dunn J. J.; Studier F. W. Vectors for selective expression of cloned DNAs by T7 RNA polymerase. Gene 56:125–135; 1987. [DOI] [PubMed] [Google Scholar]
- 22. Sambrook J.; Fritsch E. F.; Maniatis T. Molecular cloning: A laboratory manual, 2nd ed. Cold Spring Harbor, NY: Cold Spring Harbor Press; 1989. [Google Scholar]
- 23. Schägger H.; von Jagow G. Tricine-sodium dodecyl sulfate-polyacrylamide gel electrophoresis for the separation of proteins in the range from 1 to 100 kDa. Anal. Biochem. 166:368–379; 1987. [DOI] [PubMed] [Google Scholar]
- 24. Schnaitman C. A. Solubilization of the cytoplasmic membrane of Escherichia coli by Triton X-100. J. Bacteriol. 108:545–552; 1971. [DOI] [PMC free article] [PubMed] [Google Scholar]
- 25. Silhavy T. J.; Berman M. L.; Enquist L. W. Bacterial strains. In: Silhavy T. J.; Berman M. L.; Enquist L. W., eds. Experiments with gene fusions. Cold Spring Harbor, NY: Cold Spring Harbor Laboratory; 1984: xi–xiii. [Google Scholar]
- 26. Singh A. P.; Bragg P. D. ATP-dependent proton translocation and quenching of 9-amino acridine fluorescence in inside-out membrane vesicles of a cytochrome-deficient mutant of Escherichia coli . Biochim. Biophys. Acta 464:562–570; 1977. [DOI] [PubMed] [Google Scholar]
- 27. Steiner M.; Bläsi U. Charged amino-terminal amino acids affect the lethal capacity of lambda lysis proteins S107 and S105. Mol. Microbiol. 8:525–533; 1993. [DOI] [PubMed] [Google Scholar]
- 28. Studier F. W.; Moffatt B. A. Use of bacteriophage T7 RNA polymerase to direct selective high-level expression of cloned genes. J. Mol. Biol. 189:113–130; 1986. [DOI] [PubMed] [Google Scholar]
- 29. Towbin H.; Staehelin T.; Gordon J. Electrophoretic transfer of proteins from polyacrylamide gels to nitrocellulose sheets: Procedure and some applications. Proc. Natl. Acad. Sci. USA 76:4350–4354; 1979. [DOI] [PMC free article] [PubMed] [Google Scholar]
- 30. Wessel D.; Flügge U. I. A method for the quantitative recovery of protein in dilute solution in the presence of detergents and lipids. Anal. Biochem. 138:141–143; 1984. [DOI] [PubMed] [Google Scholar]
- 31. Young R.; Bläsi U. Holins: Form and function in bacteriophage lysis. FEMS Microbiol. Rev. 17:191–205; 1995. [DOI] [PubMed] [Google Scholar]
- 32. Young R.; Way S.; Yin J.; Syvanen M. Transposition mutagenesis of bacteriophage lambda: A new gene affecting cell lysis. J. Mol. Biol. 132:307–322; 1979. [DOI] [PubMed] [Google Scholar]
- 33. Zagotta M. T.; Wilson D. B. Oligomerization of the bacteriophage lambda S protein in the inner membrane of E. coli . J. Bacteriol. 172:912–921; 1990. [DOI] [PMC free article] [PubMed] [Google Scholar]