

Abstract
The Drosophila CNS consists of a bilaterally symmetric group of neurons separated by a discrete group of CNS midline cells. The specification of the CNS midline cell lineage requires transcription of the single-minded gene. Genetic evidence suggests that a group of transcription factors, including Dorsal, Snail, Twist, and Daughterless:: Scute, is required for initial single-minded transcription. Comparison of the DNA sequences of the single-minded gene regulatory regions between two Drosophila species reveals conserved sequence elements. Biochemical studies using purified proteins indicate that a number of these conserved sequences represent binding sites for Dorsal, Snail, and Twist. In vitro mutagenesis combined with germline transformation indicates that these binding sites are required in vivo for single-minded mesectodermal transcription. These results show that single-minded transcription and, thus, CNS midline specification is directly controlled by dorsal/ventral patterning transcription factors. They also suggest a model in which multiple transcriptional activators function in a cooperative, concentration-dependent mode in combination with a transcriptional repressor to restrict single-minded transcription to the CNS midline precursor cells.
Keywords: Dorsal, Dorsal/ventral, Single-minded, Snail, Transcription, Twist
THE Drosophila blastoderm embryo is subdivided along the dorsal/ventral (D/V) axis into discrete cell lineages, including (from ventral to dorsal) mesoderm, neuroectoderm, dorsal ectoderm, and amnioserosa (Fig. 1). The neuroectoderm gives rise to the central nervous system (CNS), which consists of two bilaterally symmetric sets of neurons separated by a group of CNS midline cells. Thus, the ectodermal precursors of the CNS can be subdivided into the mesectoderm, which gives rise to CNS midline cells, and lateral neuroectoderm, which forms the lateral CNS. The mesectodermal precursors are unique in that they constitute two single-cell wide stripes along the blastoderm D/V axis (44), and represent a remarkable achievement in refined patterning along the D/V axis. These cells merge together during gastrulation, develop into a group of midline precursor cells, and then differentiate into 22–26 midline neurons and glia (3,21,44). Genetic and molecular evidence has shown that the single-minded (sim) gene acts as a master regulator of CNS midline cell development and transcription [(12,30,31,44) and reviewed in (8)]. The sim gene contains two promoters (28,30). The early promoter (PE) is activated in the mesectoderm just before gastrulation. It remains active in CNS midline precursor cells, but is extinguished during midline differentiation. The late promoter (PL) is also expressed in CNS midline precursor cells and in the differentiated midline cells. The sim gene encodes a basic helix–loop–helix–PAS (bHLH-PAS) protein that functions by forming heterodimers with the Tango (Tgo) bHLH-PAS protein and activating midline gene transcription by binding CNS midline elements (CMEs) found within target genes (39,47). Sim is positively autoregulatory and Sim::Tgo heterodimers are able to maintain midline expression from PE and PL. However, the specification of the CNS mid-line cell lineage requires understanding how D/V patterning genes initially activate sim transcription within the mesectoderm.
FIG. 1.

Molecular genetics of sim mesectodermal transcription. Shown is a schematic cross-section of the Drosophila blastoderm embryo. Dorsal aspect is at the top. The different presumptive tissue anlage are dorsal ectoderm and amnioserosa (dea), neuroectoderm (ne), and mesoderm (mes). Specification of the mesectodermal lineage is correlated with expression of sim in the mesectodermal cells (filled). The genes shown to genetically influence initial sim transcription are shown along with their protein distributions. Dorsal positively (+) regulates sim transcription and Dorsal protein is distributed as a nuclear gradient with highest concentrations ventrally. Twi is also a positive regulator of sim and distributed as a gradient along the ventral region of the embryo. Snail is localized specifically in the mesoderm and represses (–) sim transcription. E-box binding proteins including Daughterless and Scute (Da::Sc) form an ubiquitously localized heterodimer that positively regulates sim transcription. Members of the Notch (N) signaling cell pathway positively regulate sim transcription although the relevant transcription factor has not been identified, nor is it known which cells are involved in sending the presumed signal.
Genetic, cellular, and molecular studies have suggested that a group of transcription factors is required for initial sim transcription [Fig. 1; also reviewed in (32)]. However, it is unknown whether they directly influence sim expression. These proteins include Dorsal, Snail (Sna), Twist (Twi), Daughterless (Da), Scute (Sc), and members of the Notch (N) signaling pathway. The same proteins are also required for patterning other regions of the blastoderm embryo (7,35). The Dorsal protein (40) is distributed as a nuclear gradient along the ventral side of the embryo (33,36,41), and triggers a cascade of patterned gene transcription along the D/V axis. Dorsal directly activates twi expression, and the Twi bHLH protein (43) forms a gradient along the ventral region (19). Dorsal and Twi together activate Sna within the mesodermal anlage (16). The Sna zinc-finger protein (4) has a sharp boundary: it is present in the mesoderm and absent in the adjacent mesectoderm (1,22,24). The Da and Sc proteins are found ubiquitously in the embryo at this time, and function as a DNA binding heterodimer that binds to E-box control elements (18,29). Members of the N pathway are expressed in the ventral regions of the embryo during mesectodermal specification (25).
Mutations in dorsal show an absence of sim transcription (22,24). Mutations in sna show ectopic expression of sim in the mesoderm, consistent with its role as a mesodermal repressor (22,24,30). twi mutations show reduced expression in a more ventral location, and twi-sna double mutants reveal an absence of sim transcription (22,24). Experiments using combinations of da and sc with other D/V mutations indicate that they are positive regulators of mesectodermal gene expression (13), and mutations in most members of the N signaling pathway also result in a reduction in early sim expression (25–27). These results lead to a model in which Dorsal, Twi, Da::Sc, and N activate sim in the ventral region of the embryo and sna represses it within the mesoderm. The combinatorial action of these positive and negative regulators restricts sim expression to the mesectoderm.
In this article, we present the sequence structure of the sim gene, and describe a group of regulatory elements that controls initial sim mesectodermal transcription. The sequence elements are conserved between related Drosophila species, and several are shown to be binding sites for Dorsal, Twi, Sna, and Da::Sc. Germline transformation of mutated sim sequence elements was employed to show that binding sites for these proteins are required in vivo for sim transcription. The multiplicity of elements and their arrangement suggest a model in which transcriptional activators including Dorsal, Twi, and Da::Sc act in a cooperative and concentration-dependent fashion to activate sim in ventral regions of the embryo. Sna limits sim expression to the mesectoderm by repressing it in the mesoderm. The modes of Sna repression may include direct competition of activator binding as well as other mechanisms.
MATERIALS AND METHODS
Isolation and Sequence Analysis of sim cDNA and Genomic Clones
D. melanogaster sim cDNA clones were isolated from 4–8- and 3–12-h embryonic RNA cDNA libraries and subjected to sequence and restriction map analysis to determine their structure. All 5′ and 3′ ends were sequenced and the internal sequence was determined by comparison of restriction sites to the completely sequenced λC1 sim cDNA clone (9). Fragments derived from sim genomic clones (44) were sequenced by generation of deletion fragments and use of the dideoxynucleotide chain termination method. Some areas were sequenced using specific primers. The length of the transcription unit is 20.2 kb. The total amount of genomic DNA sequenced is 10262 bp. The sequenced DNA includes all 8 exons, introns 2–7, and 3.0 kb of intron 1 that includes PE and the early regulatory region. The entire 10262 bp sequence has been deposited in GenBank (accession #AF071933, AF071934).
Generation of sim Gene Deletions
The ExonucleaseIII-based Erase-a-base kit (Promega) was used to create 5′ deletions of the 3.7-kb sim early regulatory region fragment. The fragments (2.8, 2.2,1.6, and 0.9 kb) were cloned into the CaSpeR-AUG-β-gal P-element transformation vector that fuses the regulatory region onto lacZ (45).
Germline Transformation of P[sim-lacZ] Transgenes
All P-element constructs were introduced into germline DNA using microinjection (34). The Pπ25.7wc plasmid was included in the injected DNA sample as a source of transposase. All transgenes contained the white (w) minigene for selection on a w – background. Three or more independent strains were analyzed for each construct.
Embryo Whole-Mount In Situ Hybridization
Stage 5 to 11 embryos from fly strains with two copies of a P[sim-lacZ] transgene were collected on grape juice–yeast agar plates, and processed for whole-mount in situ hybridization (42). The probe used for detection of lacZ transcripts was a digoxygenin-labeled riboprobe containing a full-length β-galactosidase transcript. After hybridization, expression was detected using alkaline phosphatase (AP)-conjugated antidigoxygenin antibodies and 4-nitro-blue tetrazolium chloride (NBT) plus X-phosphate. Stained embryos were cleared in 70% glycerol/PBT and photographed using a Zeiss Axiophot microscope.
Cloning and Transgenic Analysis of the D. virilis sim Gene
Genomic clones containing the D. virilis sim gene were isolated from a D. virilis genomic clone library kindly provided by J. Tamkun). The screening probe was a D. melanogaster sim cDNA clone fragment that contained the bHLH and PAS domains but lacked the poly[glutamine]-encoded carboxy-terminal region. The fragment was labeled with 32P by hexamer-primed labeling, and hybridized under relaxed stringency (50% formamide, 1 M Na2+) at 37°C. Final washing of the hybridized filters was in 1 × SSC at 50°C. The clones isolated corresponded to a single gene, and sequence analysis of exonic regions confirmed that the D. virilis gene was an orthologue of D. melanogaster sim.
The ability of D. virilis sim DNA to drive mesectodermal expression was tested by germline transformation into D. melanogaster. D. virilis DNA corresponding to the sim early regulatory region was contained in a 4.6-kb NsiI-NcoI fragment. This fragment was cloned into the SmaI site of Bluescript II KS, excised as a KpnI-BamHI fragment and cloned into CaSpeR-AUG-βgal. This P-element construct was introduced into germline DNA by microinjection and transformed embryos were tested for mesectodermal lacZ transcription by in situ hybridization.
DNA Sequence Analysis of the D. virilis sim Gene
The region of the D. virilis sim gene corresponding to the early regulatory region of the D. melanogaster sim gene was subcloned, converted into a deletion series, and sequenced using the dideoxynucleotide chain termination method. Two different D. virilis sim clones were characterized and 4978 bp sequenced. The sequence was compared to the D. melanogaster sim gene sequence by dot matrix and other sequence alignment computer programs from UWGCG and Intelligenetics GeneWorks. The sequence has been deposited with GenBank (accession #AF071932).
Synthesis of Dorsal and GST-Twi Proteins
The Dorsal protein used in DNA binding experiments was synthesized as full-length protein using a baculovirus expression system [(15); kindly provided by J. Shirokawa and A. Courey, UCLA]. Sf9 cells were infected with the recombinant Dorsal-baculovirus, nuclear protein extracts prepared, and Dorsal protein purified to homogeneity by DNA affinity chromatography. The Twi protein used in DNA binding experiments was synthesized in E. coli as a full-length glutathione S-transferase-Twi (GST-Twi) fusion protein (clone kindly provided by T. Ip and M. Levine, UCSD) (17). Soluble protein produced in E. coli was purified using a glutathione-agarose affinity column (38).
Gel Shift Analysis
The 2.8-kb sim early regulatory region cloned DNA was cut with restriction enzymes into 11 fragments (A–K) (20). Each fragment was end-labeled with 32P and individually incubated with Dorsal or GST-Twi proteins, and subjected to gel shift analysis as previously described (20). Each protein sample (0.2 μg GST-Twi and 1 μl of a 1:10 dilution of Dorsal protein extract) was preincubated for 10 min at room temperature without labeled DNA in 25 mM HEPES, pH 7.5, 50 mM KC1, 3 mM MgCl2, 0.5% NP40, 10% glycerol, and 10 μg/ml poly(dI-dC). 32P-labeled DNA fragment (2,000 dpm) was added to a final volume of 25 μl and incubated for 30 min at room temperature. The 4% polyacrylamide/0.5 × TBE gel was prerun at 150 V for 30 min, the sample was loaded, and electrophoresis continued at 150 V for 30 min followed by 250 V for 1.5 h. The gel was subjected to autoradiography.
Competition experiments were carried out for the Dorsal gel shift experiments to show specificity of binding. The wild-type competitor oligonucleotide was a 25-bp oligonucleotide, GATCGATCGGGTATTCCCAACTC, containing a strong Dorsal binding site (underlined). The mutant competitor oligonucleotide, GATCGATCCTTTTATTTCCCAACTC, contained three substitutions in the Dorsal binding site (underlined). Competitor was added at a 100 times molar excess to the 32P-labeled fragment.
DNAsel Footprint Analysis
DNAseI footprint analysis was carried out as previously described (20). Fragment B of the sim early regulatory region is a 241-bp NdeI-NheI fragment. The fragment was blunt-ended using Klenowl and cloned into the SmaI site of pBluescript II KS. Labeled antisense probe was generated by cutting with Sail, end-labeling with 32P, and cutting with BamHI. The sense probe was generated by cutting with BamHI, labeling with 32P, and cutting with BssHII. The protein-DNA incubation conditions were the same as used for gel shift analysis. The incubation mixture contained the 32P-labeled fragment and either 0.5-2 μg of GST-Twi or 5 ul Dorsal extract. Controls included 32P-labeled fragment incubated with no protein or 2 μg GST. In a 50-pl reaction volume, 2 × 10⁵ dpm of 32P-labeled restriction fragment was incubated with protein for 30 min. Subsequently, 5 μl of 10 × DNase I buffer (100 mM MgCl2, 35 mM CaCl2) containing 0.04 units/μl of DNase I (Promega) was added and incubation continued for 1 min at 25°C. Reactions were terminated by the addition of 50 μl of Stop buffer (40 mM EDTA, 2% SDS, 20 mM NaCl, and 0.2 mg/ml tRNA) followed by extraction with phenol/chloroform, ethanol precipitation, and electrophoresis on a 7 M urea, 6% polyacrlyamide sequencing gel.
In Vitro Mutagenesis of sim Genomic DNA
Deletions of sim melanogaster-virilis conserved elements (smvs) were generated in the 2.8-kb sim genomic DNA fragment using oligonucleotide-generated in vitro mutagenesis. The mutated inserts were cloned into the CaSpeR-AUG-βgal transformation vector that fuses the 2.8-kb fragment onto lacZ. DNA was microinjected into embryos to establish germline transformants. Shown below are the constructs bearing the mutations (indicating the smv deleted), the region deleted, and the sequence of the oligonucleotide employed. The sequence between the dots indicates the region deleted. Each deletion introduced a novel restriction site within the mutant gene. The mutations are as follows:
[1] P[2.8simΔ2a] 12006–12051 GGAAAGCGGCTCAG·GATCC·GGTGCTCGCAACAG,
[2] P[2.8simΔ3] 12165–12245 TGGCCGCCTCGCA·AGCTT·CGATGGCGATGCG,
[3] P[2.8simΔ11] 13392–13411 TTCCCTCAATCTCTG·GATCC·TTCTTTCTGCTAAATGG,
[4] P[2.8simΔ12] 13660–13702 ACTAAAAACATTTAAGA·GTACT·CAGCCATTCGGTAC,
[5] P[2.8simΔ13] 13804–13847 TCCAATGGCTTAGATT·AGCTT·AGGATTCCGGCTGT,
[6] P[2.8simΔ15] 14143–14170 CAAAAATGATCTGAGC·TCGA·GCCCCGGGTAAACA,
[7] P[2.8simΔ16] 14301–14342 GGAAAGCGGCTCAG·GATCC·GGTGCTCGCAACAG,
[8] P[2.8simΔSD16] 14207–14239; 14301–14342 ATCCAGTGCAGCCAA·GTC·TCCTTTTCGGGATCA plus Δ16.
P[simB] was created by cloning the NdeI-NheI fragment B (12016-12245) into the C4PLZ lacZ enhancer tester vector (46). P[simBxl6] combined the B fragment and two copies of the SmaI-EcoRV fragment containing smv16 in C4PLZ.
RESULTS
Sequence Structure of the D. melanogaster sim Gene and Transcripts
Analysis of the factors that control sim gene regulation requires knowledge of the sequence structure of the sim gene and its transcripts. This information will also be relevant as the structure and regulation of the evolutionarily conserved sim gene is studied in mammals and other organisms (6,10,11). Previous work revealed the sequence of two sim cDNA clones (9,31). Here we describe the sequence structure of a series of sim cDNA clones, regulatory and exonic sequences of the D. melanogaster sim gene, and the regulatory region of the D. virilis sim gene. Functional analysis employing germline transformation has shown that the sim gene has two promoters: 1) PE that controls initial mesectodermal expression and sim-dependent expression in the midline precursor cells, and 2) PL that controls sim-dependent midline precursor cell transcription and expression in muscle precursor cells and midline glia (28,30). Nine sim cDNA clones and the D. melanogaster sim gene were analyzed by restriction mapping and DNA sequencing. A total of 10262 bp of genomic DNA was sequenced including all exonic sequences and 3657 bp of intronic DNA that includes PE and its associated DNA regulatory elements (see below). Comparison of the gene to the cDNA clones indicates that the gene consists of eight exons spanning approximately 20.2 kb (Fig. 2).
FIG. 2.

Sequence structure of the sim gene and transcripts. The exon-intron structure of the D. melanogaster sim gene is shown at the top. Numbered boxes correspond to the eight observed exons. Open boxes correspond to untranslated regions and closed boxes to coding sequence (exon 2 begins with a short untranslated region). The late promoter (PL) drives embryonic midline precursor, midline glial, and muscle precursor expression (arrow points in the direction of transcription), and the early promoter (PE), which lies within intron 1, drives initial mesectodermal and midline precursor gene expression. The letters A–E shown in exon 8 indicate five different polyadenylation sites identified in the cDNA clones shown below. Beneath the exon-intron structure diagram are the location of BamHI and EcoRI restriction enzyme sites, and the scale of the sim genomic region is shown below. Numbering of the sim gene starts at the beginning of exon 1 because the PL start site of transcription has not been precisely defined. The extent of DNA sequence data obtained from the D. melanogaster sim gene is shown by two lines (Dm sequenced region), and the corresponding region sequenced in D. virilis is shown below (Dv::Dm compared region). Eight sim cDNA clones were isolated from embryonic cDNA libraries. Restriction map and DNA sequence analysis of these clones, including the λC1 clone previously reported, reveal the sequence structures shown. The polyadenylation site for each clone is shown using the letters (A–E) corresponding to the five different sites identified. The length in kb for each clone is indicated at right. The coding sequences of all eight clones overlap, and do not provide evidence for alternative Sim proteins. Clones S1, pC10, and pC11 correspond to PL-derived transcripts, but no cDNA clone unambiguously corresponds to a PE-derived transcript.
Three cDNA clones (pC10, pC11, and S1) are derived from mRNA transcribed from PL and reveal that exon 1, which is 5′-untranslated sequence, has alternative 5′ splice sites. The other six cDNA clones could be derived from either PE or PL and do not reveal additional splice variants. However, five different polyadenylation sites are used. Analysis of the cDNA clones does not provide evidence for different sim coding sequence variants, although this has not been rigorously ruled out. Figure 3 shows the complete sequence of 3048 bp of intron 1 DNA that precedes exon 2 (which is also shown). Seven of the eight exons contain coding sequence; only exon 1 lacks coding sequence. All of the exons except exon 8 are relatively small, and most of the introns are modest in size except intron 1, which spans 13.9 kb. Germline transformation experiments have shown that this intron contains PE and the regulatory elements that control early sim transcription.
FIG. 3.

Comparison of D. melanogaster and D. virilis sim early regulatory region DNA sequences. The DNA sequence of the D. melanogaster sim gene preceding and including exon 2 is shown. This region contains all sequences required for D. melanogaster mesectodermal transcription. Numbering begins at the 3′-most BamHI site (GGATCC) in intron 1 and the 5′-most G is assigned residue 10900. This is an approximate value because the entire gene has not been sequenced. Although the entire D. melanogaster sequence was determined from residue 10900, the sequence shown begins at residue 11521, because this was the extent of the D. virilis gene sequenced. Exon 2 is underlined, and the preceding 3048 bp of intron 1 is shown along with 60 bp of intron 2. Below the D. melanogaster sequence, the regions of similarity to the D. virilis sim gene are indicated. These conserved regions are referred to as smvs, and are indicated by the numbers 1 through 19. Sequence identities between the two DNA sequences are indicated by a dot and the D. virilis residue is shown when different from D. melanogaster. smv19 includes exon 2, and the sim mRNA initiator methionine is indicated as “Met” beginning at residue 14589. The 5′-positions of the P[sim-lacZ] deletion transgenes shown in Fig. 4 are indicated on the sequence as “2.8, 2.2, 1.6, and 0.9.”
Localization of Genomic Sequence Elements Controlling Initial sim Mesectodermal Expression
Previous work established that the regulatory elements necessary for blastoderm expression of sim in the mesectodermal cells are contained within a 2.8-kb genomic DNA region containing PE and residing at gene coordinates 11.8 to 14.6 (20). Further refinement of the regulatory elements that govern sim mesectodermal expression was attempted by constructing deletions within the 2.8-kb sim fragment followed by fusion to lacZ in the CaSpeR-AUG-lacZ P-element vector and introduction into Drosophila germline DNA. Multiple transformants were assayed for lacZ transcription by in situ hybridization using a lacZ riboprobe. Each deletion removed DNA from the left-ward-end, leaving PE intact on fragments of 2.8, 2.2, 1.6, and 0.9 kb. The results shown in Fig. 4 indicate that only the 2.8-kb fragment shows the stripes of initial mesectodermal lacZ expression; the other fragments failed to show any detectable mesectodermal lacZ transcription. This indicates that sequences required for initial sim transcription lie between 12.5 and 13.0, although additional required elements may reside between 13.0 and 14.6.
FIG. 4.
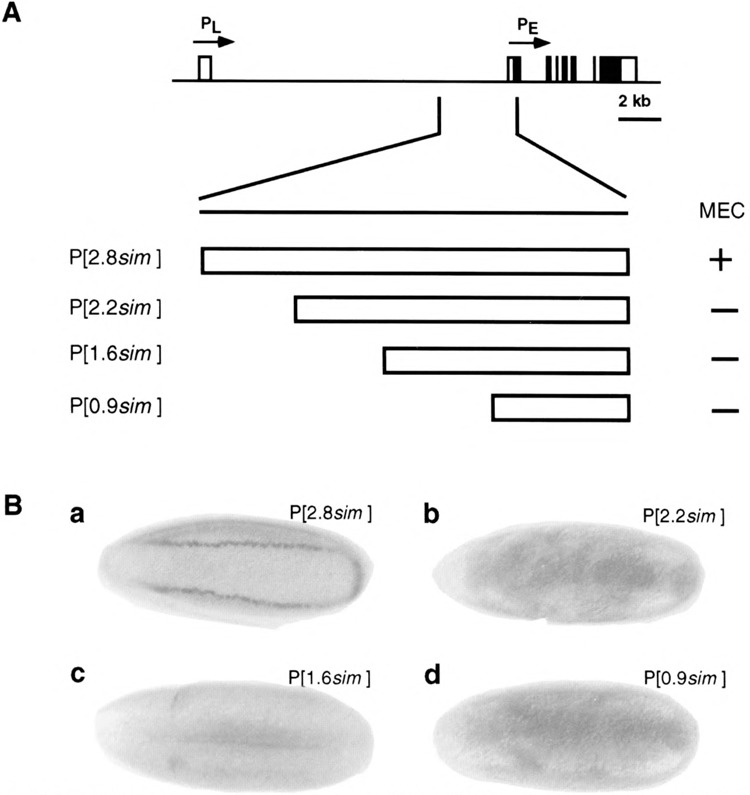
Sequences required for initial sim transcription are contained within a 2.8-kb region. Blastoderm or gastrulating embryos containing different P[sim-lacZ] transgenes were hybridized to a digoxygenin-labeled sim cDNA riboprobe and stained with AP-anti-digoxygenin and NBT. The P[sim-lacZ] strains were examined for the presence of mesectodermal lacZ-expressing stripes. (A) The location of the sim early regulatory region is shown below the genomic map along with the 5′ deletion fragments tested. Summary of the results indicating presence of mesectodermal lacZ transcription (MEC) is shown to the right. (B, a) Strains bearing the P[2.8sim] transgene show normal mesectodermal β-galactosidase stripes. (B, b–d) Further 5′ deletions that generated the P[2.2sim], P[1.6sim], and P[0.9sim] transgenes were tested and mesectodermal β-galactosidase expression was absent.
Comparison of the DNA Sequences of the sim Early Regulatory Region Between Different Drosophila Species Reveals Conserved Sequence Elements
Comparison of regulatory DNA sequences between orthologous genes in different Drosophila species has been an effective method for identifying transcriptional control elements (5). We reasoned that sequence comparisons of the sim early regulatory region between D. melanogaster and D. virilis would be useful for identifying relevant regulatory elements that control mesectodermal expression. The D. virilis sim gene was isolated by screening a genomic library of D. virilis genomic DNA with a D. melanogaster sim cDNA probe. Clones corresponding to a single gene were identified and sequence analysis of the coding sequence indicated it was the sim gene (Fig. 3).
The 2.8-kb region of the D. melanogaster sim gene required for mesectodermal expression lies immediately upstream of exon 2. This same region of DNA was sequenced in D. virilis (Fig. 2). Dot matrix analysis was performed to detect regions of high sequence identity (Fig. 5). The results reveal discrete regions of high sequence conservation separated by regions of weakly conserved sequences, and illustrate that the D. virilis and D. melanogaster sequences 5′ to exon 2 correspond to each other. They align in a relatively linear fashion over the entire region compared. The D. melanogaster stretch analyzed is 3307 bp. The equivalent region of D. virilis is considerably longer, measuring 4978 bp. The differences lie primarily in three AT-rich regions in the D. virilis DNA that are greatly reduced in size in the D. melanogaster gene.
FIG. 5.

Dot matrix comparison of the D. virilis and D. melanogaster sim early regulatory region gene sequences. D. melanogaster genomic DNA containing 3.0 kb of DNA 5′ to exon 2, exon 2, and 60 bp of intron 2 were compared to the same region of D. virilis. The D. melanogaster region contained 3307 bp of DNA whereas the D. virilis DNA was considerably larger, containing 4978 bp of DNA. Dot matrix analysis was carried out using GeneWorks with the window set at 30 and stringency at 49%. Overall, the two genes are conserved throughout the region, and the conserved sequences align in a linear fashion. The regions of significant sequence identity (smvs) number 19 (including exon 2), as indicated along side each diagonal of sequence conservation. The differences in size between the D. melanogaster and D. virilis sim early regulatory regions are due to the comparatively large size in D. virilis of three AT-rich regions found within this region (labeled “vat1–3” for D. virilis and “matl–4” for D. melanogaster that has an additional AT-rich region). The scale in kb is indicated along each axis. The D. melanogaster sequence is numbered according to Fig. 3 and the D. virilis sequence is numbered arbitrarily in kb with the 3′ end of the compared region labeled as “0.”
Proof that the D. virilis region corresponds functionally to the 2.8-kb D. melanogaster sim early regulatory region was obtained by testing the D. virilis sim DNA for mesectodermal transcription capacity in D. melanogaster. The corresponding 4.6-kb NsiI-NcoI D. virilis fragment was fused to lacZ, introduced into D. melanogaster germline DNA, and embryos tested for mesectodermal lacZ expression by in situ hybridization with a lacZ probe. The results (Fig. 6) show that the D. virilis fragment is able to transcribe lacZ in the mesectodermal stripes in a fashion analogous to the D. melanogaster 2.8-kb sim DNA, indicating functional conservation between the D. virilis and D. melanogaster early regulatory regions. Using dot matrix analysis and computer-assisted comparisons over short regions, 18 regions of high sequence identity were identified within the 3.0 kb of sim regulatory DNA that precedes exon 2 (Figs. 3 and 5, Table 1). These 18 regions are either continuous or discontinuous stretches that average 44 bp in length with average sequence identity of 92% (conserved elements are denoted “smv#” for “sim melanogaster-virilis conserved element”) (Table 1). The longest smv is smv10, a discontinuous stretch 85 bp in length.
FIG. 6.
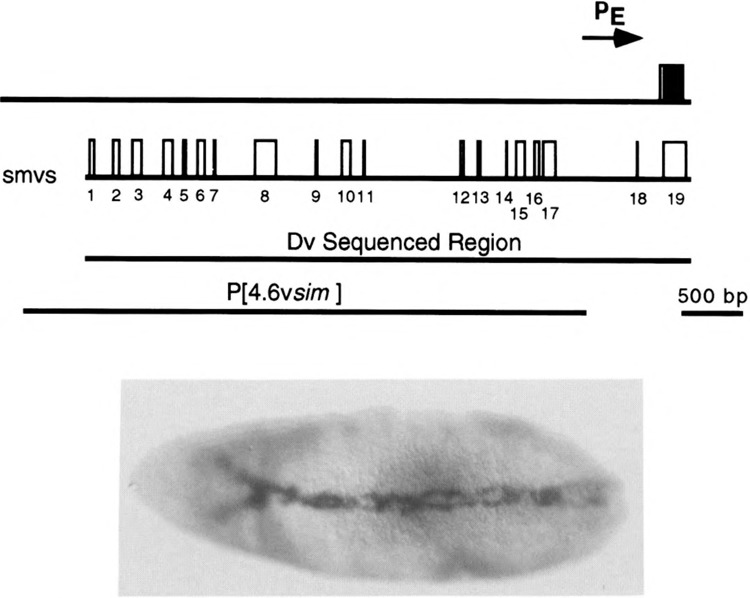
Functional conservation of the D. virilis sim early regulatory region. The stretch of the D. virilis sim gene corresponding to the 2.8-kb D. melanogaster sim early regulatory region was sequenced and functionally assayed. At the top is a representation of the D. virilis sim gene showing the location of exon 2 (box with coding sequence filled and 5′ UTR unfilled) and the approximate location of PE. Below are the locations of the D. virilis smvs and the region sequenced. The D. virilis 4.6-kb NsiI-NcoI fragment was fused to lacZ in the CaSpeR-AUG-βgal P-element vector, introduced into D. melanogaster germline DNA, and assayed for mesectodermal transcription by hybridization to a lacZ RNA probe. The stage 7 embryo shows strong mesectodermal lacZ stripes. Ventral view is shown; anterior is to the left.
TABLE 1.
D. MELANOGASTER–D. VIRILIS CONSERVED SEQUENCE SITES

The Conserved Sequence Elements Within the sim Gene Identify Putative Transcription Factor Binding Sites
Genetic studies suggest that Dorsal, Twi, Sna, Da:: Sc, and members of the Notch signaling pathway are regulators of initial sim mesectodermal transcription. In addition, maintenance of sim CNS midline precursor cell transcription is controlled by Sim::Tgo heterodimers (39), and their DNA binding sites must also be localized to this region (47). The 3.7-kb sim fragment also contains the elements that control sim gut expression (30). The transcription factors that control gut expression are unknown. Sna binding sites have been previously identified within the sim gene by gel shift and DNAsel footprint experiments (20). The putative Sim::Tgo binding sites (CMEs) have also been identified by in vitro mutagenesis/germline transformation (47). Consensus binding sites within the group of smvs were identified for Dorsal and E-boxes, which could be sites for Da::Sc or Twi, and the biochemically identified Sna binding sites and CMEs were compared to the location of smvs (Table 1).
The results indicate that 10 of 19 smvs have binding sites corresponding to these transcription factors, and four smvs have multiple sites. The total number of conserved putative binding sites is 23: Dorsal [3], Sna [5], Tw [6], Sna E-box (binding site for Da::Sc or Twi) [3], Sim::Tgo [4 plus 2 in smvl9]. Of particular interest is the observation that smv3 has multiple Dorsal and Twi sites that are interspersed. These sites lie within interval 11.8 to 12.5, a region required for sim mesectodermal transcription. It is also noteworthy that five of the seven Sna binding sites determined by biochemical methods are conserved between the two species. In addition, the four CMEs shown to be required for Sim-dependent midline transcription are also conserved. These results suggest that the interspecific comparison of the sim gene is useful in detecting in vivo-relevant cis-regulatory regions, an assertion tested by additional biochemical and germline transformation experiments.
The Dorsal and Twi Proteins Bind Cooperatively Within the sim Regulatory Region
Direct evidence that Dorsal and Twi bind the sim regulatory region was sought by using in vitro DNA binding assays with purified proteins. The Dorsal protein was a full-length protein made in insect cells using a baculovirus vector, and has been successfully used in DNA binding assays (15). The initial experiments used gel shift analysis of Dorsal protein and 11 32P-labeled restriction fragments that span the entire 2.8-kb sim regulatory region (Fig. 7A) [see (20)]. Two fragments, B and F, showed a retarded gel fragment (Fig. 7B). These fragments contain smv3 and smv10, which both have conserved consensus Dorsal binding sites (smv3: D1 and D2; smvlO: D3; also see Table 1). Retardation of fragments B and F was completely eliminated in the presence of 100 times molar excess of oligonucleotide containing a high-affinity Dorsal binding site, but not in a 100 times excess of the same oligonucleotide with a mutated Dorsal binding site (Fig. 7C).
FIG. 7.
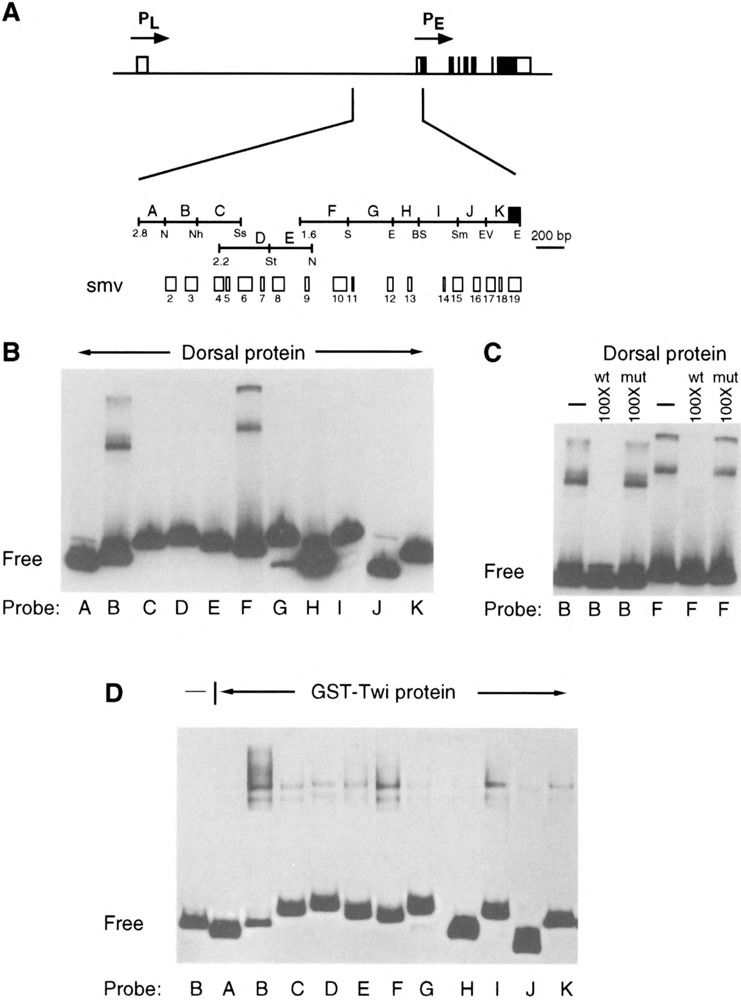
Gel shift analysis identifies fragments of the sim early regulatory DNA region that contain Dorsal and Twi protein binding sites. (A) The 2.8-kb sim genomic DNA region was fractionated into 11 fragments (labeled A–K) that cover the entire interval and include smvs 1–19. Also shown is the position of the 5′ end of the 2.2-kb sim fragment fused to lacZ in P[2.2sim]. The region between 2.8 and 2.2 is required for initial sim transcription. (B) Purified baculoviral-produced Dorsal protein was incubated with 32P-labeled fragments A–K (probe) and subjected to gel shift analysis. Fragments B and F show retarded DNA fragments. (Free) indicates unshifted DNA fragments. (C) Specificity of Dorsal binding is indicated by competition experiments. 32P-labeled fragments B and F were incubated with Dorsal protein in either the absence (–) of competitor DNA, presence of 100 times molar excess of wild-type (wt) Dorsal high-affinity binding site oligonucleotide, or 100 times molar excess of Dorsal binding site oligonucleotide mutated (mut) within the binding site. (D) 32P-labeled fragments A–K were incubated with GST-Twi protein and subjected to gel shift analysis. All fragments showed weak retardation although fragments B, F, and I showed the strongest binding. Binding was not observed when GST-Twi was absent (probe B is shown) or when only GST was added (data not shown).
Similar experiments were performed with a Twi protein created in E. coli as a GST-Twi fusion protein (Fig. 7D). In this case, weak binding was observed with all fragments, a result previously noted in other Twi DNA binding experiments (17). However, the strongest binding was observed with fragments B, F, and I. All three fragments contain putative Twi recognition sites. Fragment B contains smv2 and 3 with putative Twi binding sites T1, T2, and T3 (Table 1). Fragment F contains smv10 and Twi site T4, and fragment I contains Twi site T6. The retarded fragments were specific for Twi, because no shift was observed with GST (data not shown). Most noteworthy is the observation that fragments B and F contain both Dorsal and Twi binding sites, suggesting possible cooperative interactions between these two transcription factors.
DNAseI footprint analysis was used to confirm that Dorsal and Twi were binding to the expected sites, and to test for cooperative protein interactions. Restriction fragment B that contains smvs 2 and 3 and D1–2 and T1–3 was labeled on both sense and antisense strands and reacted with GST-Twi and Dorsal proteins individually and together. Reaction of GST-Twi with the antisense strand showed Twi-specific protection over an extensive region including smv2 and T1 and another region including the Sna SE1 binding site containing a putative Da::Sc or Twi binding site (Fig. 8A). No strong Twi protection was observed with sense strand DNA (Fig. 8B). Modest protection of D1 and D2 was observed on the sense strand with Dorsal protein used by itself (Fig. 8B). Weak protection was also observed on the antisense strand (data not shown). However, when both Dorsal and Twi were added to sense strand DNA, strong protection was observed over the entire smv3 region that includes D1, T2, D2, and T3 (T2 showed less protection than the other three sites) (Fig. 8B). These results confirm that Twi and Dorsal are binding specifically to the putative Dorsal and Twi binding sites found in smvs 2 and 3. In addition, they provide evidence that binding is stronger when both proteins are present together, consistent with cooperative interactions between the two proteins.
FIG. 8.

DNAseI footprint analysis reveals that Dorsal and Twi bind to sites in smv2 and 3. (A) sim fragment B that contains smv2 and 3 was 32P-labeled on the antisense strand, incubated with protein, and subjected to DNAsel footprint analysis. The fragment was incubated with: lane 1, no recombinant protein; lane 2, 0.5 μg GST-Twi; lane 3, 1 μg GST-Twi; lane 4, 2 pg GST-Twi; and lane 5, 2 pg GST. GST-Twi protected (hatched lines) a region corresponding to smv2a that includes Twi binding site T1. Also protected was a region containing smv2b that contains the Sna E-box SE1 binding site that could be a binding site for Twi. Nucleotide positions within the sim early regulatory region are indicated to the right. (B) Fragment B was labeled with 32P on the sense strand, incubated with protein, and subjected to DNAsel footprint analysis. Lane 1 is a G/A ladder. The fragment was incubated with: lane 2, 2 pg GST; lane 3, 0.5 pg GST-Twi; lane 4, 1 pg GST-Twi; lane 5, 2 pg GST-Twi; lane 6, 2 pg GST-Twi + 5 μl Dorsal (Dl); lane 7, 5 μl Dorsal; and lane 8, no protein. Dorsal and GST-Twi failed to strongly protect any residues when used individually. However, when combined they strongly protected the Dorsal and Twi D1, D2, T2, and T3 sites in smv3.
Deletion of Dorsal, Twi, and Sna E-Box Binding Sites Results in Reduction of Initial sim Mesectodermal Transcription In Vivo
The sim gene sequence analysis, biochemical experiments, and genetics strongly suggest that initial sim mesectodermal transcription is directly influenced by Dorsal, Twi, Da::Sc, and Sna. Further evidence for direct control was achieved by deleting the identified binding sites within the sim gene and testing their in vivo relevance by germline transformation. In vitro mutagenesis was used to delete individual smvs within the 2.8-kb sim early regulatory region previously shown to be sufficient for initial mesectodermal transcription (Fig. 9). Deletion of an entire smv, in some cases, resulted in removal of multiple binding sites. These deletion mutations, in contrast to single binding site mutations, are more likely to reduce the possibility of binding site redundancy masking their in vivo role. The mutated fragment was fused to lacZ on a P-element vector and transformed into germline DNA. Multiple transformants were tested by-in situ-hybridization with a lacZ riboprobe for expression in mesectodermal stripes.
FIG. 9.

Deletion of smvs containing Dorsal, Twi, and Sna E-box binding sites results in loss of mesectodermal transcription. Mutations in the 2.8-kb sim early regulatory region were created, cloned into a P[lacZ] vector, and tested for mesectodermal lacZ transcription after introduction into germline DNA. The constructs tested are shown beneath a schematic of the 2.8-kb regulatory region with numbered smvs. Each construct listed with the smv deleted (D) is indicated by an “X” through the relevant number. P[2.8simΔSΔ16] deletes Sna sites S4, S5 (S), and smv 16. P[simB] is a construct with sim gene fragment B cloned into an enhancer tester P[lacZ] vector. P[simB2x16] contains fragment B and 2 copies of the SE6 and SE7 Sna binding sites. Presence of strong blastoderm mesectodermal (MEC) lacZ transcription is indicated to the right by (+), weak expression by (+/–), and the absence of expression by (–). The binding sites deleted in each construct are listed to the right. The bracketed sites listed for P[simB] and P[simB2x16] indicate binding sites that are included in the construct. Representative embryos for each construct are shown at the bottom.
smv2 contains two separated regions of identity, a and b. smv2a contains a Twi binding site (T1) and smv2b contains a Sna E-box binding site (SE1). The first construct P[2.8simΔ2a] deletes smv2a, including T1, and initial lacZ transcription was completely abolished. smv3 contains two Twi binding sites (T2 and T3) interspersed with two Dorsal binding sites (D1 and D2). The construct, P[2.8simΔ3], removed all four sites and mesectodermal transcription was abolished. smv16 contains two Sna E-box binding sites (SE6 and SE7). Deletion of smv16 (P[2.8simΔ16]) greatly reduced mesectodermal transcription, but a low level of expression was detectable. However, removal of both smv16 and the nearby S4 and S5 Sna binding sites (P[2.8simΔSD16]) completely abolished mesectodermal transcription. Genetic evidence suggests that sna is a mesodermal repressor of sim transcription. Thus, removal of the S4, S5, SE6, and SE7 Sna binding sites might have resulted in ectopic mesodermal lacZ transcription. That these deletions resulted, instead, in a reduction or absence of mesectodermal expression is, most likely, due to the concomitant loss of Da::Sc or Twi binding sites nested within the Sna binding site. The results of these deletions implicate Dorsal, Twi, and Sna E-box binding sites in controlling mesectodermal transcription. Loss of mesectodermal lacZ transcription in the smv2 and 3 deletion strains is consistent with the loss of midline transcription observed in the P[2.2sim] deletion.
The experiments described above indicate a requirement for the promoter-distal smv2, 3 cluster of Dorsal and Twi binding sites, and the proximal cluster of smv16 Sna E-box binding sites. Although not analyzed by in vitro mutagenesis/germline transformation, there are also additional binding sites scattered throughout the regulatory region. Consistent with the idea that multiple regions are required for mesectodermal transcription, two synthetic transgenes were assayed in a lacZ enhancer tester vector. The inserts contained: 1) fragment B that includes smvs2 and smv3 (P[simB]), and 2) fragment B fused to two copies of a fragment containing smv16 (P[simB2x16]). The results indicated that P[simB] was unable to drive detectable levels of mesectodermal transcription, and that P[simB2x16] mesectodermal transcription was barely detectable. This indicates that the six smv2 and smv3 Dorsal, Twi, and Sna E-box binding sites, even when coupled to the smv16 Sna E-box binding sites, are insufficient for mesectodermal transcription, and presumably require interactions with other sites and their bound proteins.
Additional smvs and transcription factor binding sites were deleted and assayed to address their contributions to mesectodermal transcription. Deletion of smvl 1 containing Twi site T5 (P[2.8simΔ11]) and deletion of smvl5 containing T6 (P[2.8simΔ15]) did not affect mesectodermal transcription, smvs 12 and 13 each contain CMEs, the targets of Sim::Tgo binding. These sites have been shown to be required for sim-dependent CNS midline precursor cell transcription from PE (47). Deletion of either smv (P[2.8simΔ12 and P[2.8simΔ13]) showed normal mesectodermal transcription. Because initial mesectodermal transcription is sim independent, this result implies that no other CME binding transcription factor utilizes Sim::Tgo binding sites to influence initial mesectodermal sim expression.
DISCUSSION
The sim Early Regulatory Region Contains Conserved Binding Sites for Proteins That Control Dorsal/Ventral Axis Formation
Sequence analysis of sim cDNA clones, D. melanogaster sim genomic clones, and D. virilis sim genomic clones provide a detailed view of the sequence structure of the sim gene. The gene consists of eight exons spread over 20.2 kb with two promoters: PL and PE. PE is the promoter that is utilized for mesectodermal sim transcription, and it is contained within a large 13.9-kb intron. Using fragments that contain PE fused to lacZ, germline transformation experiments indicate that 2.8 of DNA 5′ to exon 2 (11.8 to 14.6) contains all of the sequences required for sim mesectodermal transcription. However, a 2.2-kb fragment, which removed an additional 0.6 kb from the 5′ end, was not able to drive lacZ mesectodermal transcription.
The 2.8-kb DNA sequence was determined in both D. melanogaster and D. virilis, and the sequences compared. In the 3307 bp of the D. melanogaster sim gene compared to D. virilis sim there were 19 regions of high sequence identity. These regions were evenly spaced throughout the entire region and there was a one-to-one correspondence in their relative locations between the two species. The one significant difference between the two genes concerns the size of several AT-rich regions. The average size of the 18 non-exonic smvs [1–18] is 43 bp with 91% sequence identity. Nine of 18 smvs represent continuous sequence blocks whereas the other nine are discontinuous.
The conservation in sequence between D. melanogaster and D. virilis suggests that smvs are functional, a hypothesis borne out by the results presented here and previously (47). Of the 17 nonexonic smvs analyzed within the 2.8-kb region, 10 were shown by either biochemical and/or mutational data to be implicated in controlling either initial mesectodermal transcription or sim-dependent midline expression (Fig. 10; Table 1). There are three major regions of conserved smvs and the mutational results indicate that at least two of them are required for initial sim transcription. The most complex is Dorsal-Twist Cluster 1 (DTC1) containing smvs 2 and 3. This region is essential because loss of initial sim lacZ transcription is observed in a deletion of: 1) the entire region (P[2.2sim]), 2) deletion of smv2 and its T1 Twi binding site, and 3) deletion of smv3 and the D1, T2, D2, T3 binding sites. However, it is not sufficient for mesectodermal transcription because a fragment containing only DTC1 (P[simB]) does not show mesectodermal transcription. The second Dorsal-Twist Cluster (DTC2) contains smvs 10 and 11 with single Dorsal and Twi binding sites; its role in sim transcription was not tested. The third region, referred to as the Sna cluster (SC), encompasses smvs 15 and 16 and has multiple Sna, Sna E-box, and Twi binding sites. Deletion of Sna sites S4 and S5 along with smv16 and its Sna-E box sites (P[2.8simΔSΔ16]) results in a loss of mesectodermal transcription. However, combining fragment B and the Sna sites in smv16 only revealed very weak mesectodermal expression, suggesting that binding sites scattered throughout the 2.8-kb sim early regulatory regions are required for normal levels of mesectodermal transcription.
FIG. 10.

Summary of sim early regulatory region protein binding sites. Shown is 3.3 kb of the D. melanogaster sim early regulatory region. Exon 2 is indicated by a box and PE by an arrow. The location of D/V transcription factor binding sites is indicated along with the CMEs The locations of the three major clusters of D/V regulatory protein bindings sites (DTC1, DTC2, and SC) are shown at the bottom.
Positive and Negative Protein Interactions in sim Gene Control
The smv2 and smv3 regions contain an arrangement of Dorsal, Twi, and Da::Sc binding sites arranged in the order: T1, SE1 (Da::Sc), T2, D1, T3, and D2. Deletion of smv2 (T1) resulted in absence of mesectodermal transcription, and deletion of smv3 (T2, D1, T3, D2) also showed an absence of mesectodermal transcription. This indicates the functional role of the Dorsal and Twi binding sites. Protein binding studies using DNAsel footprinting showed that the binding of Dorsal or Twi individually to the four smv3 sites resulted in only weak or modest protection. However, when both proteins were combined, strong protection was observed. This is consistent with in vitro and in vivo experiments that demonstrate Dorsal-Twi cooperativity (13,16,37). The binding site arrangement and affinities of the sites in smv2 and smv3 may be particularly relevant because both Dorsal and Twi are expressed as a gradient where sim is activated, and the synergy and cooperativity observed may allow strong transcriptional activation at a narrow protein concentration. This may be one reason why sim expression is limited dorsally to the mesectoderm and is absent in the adjacent neuroectoderm. There is another conserved region (DTC2) that contains adjoining Dorsal and Twi sites, but its role in Sim transcription was not tested.
Genetic evidence indicates that sna represses sim transcription within the mesoderm. Three of the seven sim Sna binding sites have E-boxes (SE1, SE6, SE7), and can bind Da::Sc heterodimers (R. Franks and S. T. Crews, unpublished) and possibly Twi. Deletion of SE6-7 together results in a reduction of mesectodermal transcription, and deletion of SE6-7 along with the non-E-box S4 and S5 sites resulted in a complete absence of mesectodermal transcription. These results are consistent with Sna E-boxes playing a role in mesectodermal activation, although the reason for the more severe reduction of expression when all four Sna sites are deleted is unclear.
Because loss of Sna sites (and accompanying E-boxes) results in absence of mesectodermal transcription, it cannot be confirmed by these in vitro mutagenesis/germline transformation experiments that Sna acts as a mesodermal repressor. However, the genetic evidence regarding the role of sna as a mesodermal repressor is strong, and this function is likely. Several studies suggest that Sna may repress both by competition with E-box binding activators (17) or by acting at a distance via noncompetitive mechanisms (14). Both mechanisms may apply to sim transcription. Overlap of Sna binding sites with E-boxes that are shown here to be required for mesectodermal activation supports a competitive model. However, there are Sna binding sites (S2–5) without E-boxes found in the sim early regulatory region. In addition, the location of SE1 in the DTC1 Dorsal-Twi binding site cluster and location of S4, S5, SE6, and SE7 (SC) near the transcriptional start site suggests mechanisms in which Sna could: 1) disrupt cooperative Dorsal-Twi binding, 2) inhibit binding of Dorsal, Twi, and Da::Sc with the general transcription machinery, or 3) block binding of the general transcriptional machinery at the start site.
Model of Mesectodermal sim Gene Transcription
The data presented in this article, coupled with previously published experiments, suggest a biochemical model for how sim mesectodermal transcription is regulated (Figs. 1 and 10). Dorsal, Twi, and E-box binding proteins (most likely Da::Sc), and possibly other proteins, bind to multiple sites within the sim early regulatory region to activate sim in the mesectoderm and mesoderm. Sna is expressed only within the mesoderm, and acts as a repressor of sim transcription within the mesoderm. Its action will then restrict sim transcription only to the mesectoderm. Both the Dorsal and Twi proteins are expressed as nuclear gradients in the blastoderm embryo, and the mesectodermal cells are in steep regions of their concentration gradients. Thus, concentrations of Dorsal and Twi in the mesectoderm and mesoderm are significantly higher than in the adjacent neuroectodermal cells. Cooperative interactions between Dorsal, Twi, and probably E-box binding proteins magnifies transcriptional activation in the mesectoderm and mesoderm with respect to more dorsal cells. In particular, the low-affinity Dorsal binding sites present in the sim gene may be of insufficient affinity for transcriptional activation of sim by Dorsal in adjacent neuroectodermal cells. Genetic evidence indicates that the N signaling pathway is required for initial sim transcription (25–27), although how this occurs biochemically is unknown. The Suppressor of Hairless [Su(H)] DNA binding protein often executes the transcriptional function of the N signaling pathway. However, genetic evidence indicates that Su(H) does not influence sim transcription (23).
D/V Control of Neuroectodermal Transcription: Comparison of sim and rhomboid Regulation
How does D/V control of sim transcription compare to other genes regulated by D/V patterning transcription factors? The most relevant example is rhomboid (rho) (2), which is expressed in the neuroectoderm and mesectoderm. Both rho and sim are transcribed in the mesectoderm, and neither are expressed in the mesoderm. However, rho extends further dorsal than sim. Given this similarity, it is expected that the regulatory proteins and binding sites that control sim and rho transcription would be similar, although nonidentical. Evidence presented in this article regarding sim and previous work on rho supports this idea. The sequences required for initial rho transcription lie within an 0.6-kb stretch of DNA upstream of the promoter that contains four Dorsal binding sites (one high affinity), two Twi-binding sites interspersed among the Dorsal sites, four Sna sites (two that contain E-boxes), and two additional E-box sequences (17). Mutation of the Dorsal and Twi binding sites together eliminates most neuroectodermal expression, and mutation of Sna binding sites results in ventral derepression. The presence of a comparable number of binding sites and their clustering suggests that both rho and sim are controlled in a similar fashion by the same D/V patterning regulatory proteins. Why is sim expression restricted to the mesectoderm, and rho expression includes more dorsal cells? One possibility is that the arrangement, number, and affinities of the sim binding sites for Dorsal and Twi result in overall lower affinity binding of Dorsal and Twi in the sim gene than in the rho gene. Thus, at the lower concentrations of Dorsal and Twi found in the more dorsal neuroectodermal cells, sim cannot be transcribed, but rho can. Taken together, these results suggest a model in which the sim early regulatory region is precisely engineered for mesectodermal expression during cell fate specification in the Drosophila embryo.
ACKNOWLEDGEMENTS
We would like to thank A1 Courey and Margaret Sonnenfeld for helpful discussions, Patricia Estes for critically reading the manuscript, and Al Courey, Mike Levine, Jill Shirokawa, and John Tamkun for materials. Y.K. was supported by an NIH postdoctoral fellowship, and this work was supported by a grant from the NICHD.
REFERENCES
- 1. Alberga A.; Boulay J. L.; Kempe E.; Dennefeld C.; Haenlin M. The snail gene required for mesoderm formation in Drosophila is expressed dynamically in derivatives of all three germ layers. Development 111:983–992; 1991. [DOI] [PubMed] [Google Scholar]
- 2. Bier E.; Jan L. Y.; Jan Y. N. rhomboid, a gene required for dorsoventral axis establishment and peripheral nervous system development in Drosophila melanogaster . Genes Dev. 3:190–203; 1990. [DOI] [PubMed] [Google Scholar]
- 3. Bossing T.; Technau G. M. The fate of the CNS mid-line progenitors in Drosophila as revealed by a new method for single cell labelling. Development 120:1895–1906; 1994. [DOI] [PubMed] [Google Scholar]
- 4. Boulay J. L.; Dennefeld C.; Alberga A. The Drosophila developmental gene snail encodes a protein with nucleic acid binding fingers. Nature 330:395–398; 1987. [DOI] [PubMed] [Google Scholar]
- 5. Bray S. J.; Hirsh J. The Drosophila virilis dopa decar-boxylase gene is developmentally regulated when integrated into Drosophila melanogaster . EMBO J. 5:2305–2311; 1986. [DOI] [PMC free article] [PubMed] [Google Scholar]
- 6. Chen H.; Chrast R.; Rossier C.; Gos A.; Antonarakis S. E.; Kudoh J.; Yamaki A.; Shindoh N.; Maeda H.; Minoshima S.; Shimizu N. Single-minded and Down syndrome. Nat. Genet. 10:9–10; 1995. [DOI] [PubMed] [Google Scholar]
- 7. Courey A. J.; Huang J.-D. The establishment and interpretation of transcription factor gradients in the Drosophila embryo. Biochim. Biophys. Acta 126:1–18; 1995. [DOI] [PubMed] [Google Scholar]
- 8. Crews S. T. Control of cell lineage-specific development and transcription by bHLH-PAS proteins. Genes Dev. 12:607–620; 1998. [DOI] [PubMed] [Google Scholar]
- 9. Crews S. T.; Thomas J. B.; Goodman C. S. The Drosophila single-minded gene encodes a nuclear protein with sequence similarity to the per gene product. Cell 52:143–151; 1988. [DOI] [PubMed] [Google Scholar]
- 10. Dahmane N.; Charron G.; Lopes C.; Yaspo M. L.; Maunoury C.; Decorte L.; Sinet P. M.; Bloch B.; Delabar J. M. Down syndrome-critical region contains a gene homologous to Drosophila sim expressed during rat and human central nervous system development. Proc. Natl. Acad. Sci. USA 92:9191–9195; 1995. [DOI] [PMC free article] [PubMed] [Google Scholar]
- 11. Fan C.-M.; Kuwana E.; Bulfone A.; Fletcher C. F.; Copeland N. G.; Jenkins N. A.; Crews S.; Martinez S.; Puelles L.; Rubenstein J. L. R.; Tessier-Lavigne M. Expression patterns of two murine homologs of Drosophila single-minded suggest possible roles in embryonic patterning and in the pathogenesis of Down Syndrome. Mol. Cell. Neurol. 7:1–16; 1996. [DOI] [PubMed] [Google Scholar]
- 12. Franks R. G.; Crews S. T. Transcriptional activation domains of the Single-minded bHLH protein are required for CNS midline cell development. Mech. Dev. 45:269–277; 1994. [DOI] [PubMed] [Google Scholar]
- 13. Gonz´lez-Crespo S.; Levine M. Interactions between dorsal and helix-loop-helix proteins initiate the differentiation of the embryonic mesoderm and neuroectoderm in Drosophila . Genes Dev. 7:1703–1713; 1993. [DOI] [PubMed] [Google Scholar]
- 14. Gray S.; Szymanski P.; Levine M. Short-range repression permits multiple enhancers to function autonomously within a complex promoter. Genes Dev. 8:1829–1838; 1994. [DOI] [PubMed] [Google Scholar]
- 15. Huang J.-D.; Schwyter D. H.; Shirokawa J. M.; Courey A. J. The interplay between multiple enhancer and silencer elements defines the pattern of decapentaplegic expression. Genes Dev. 7:694–704; 1993. [DOI] [PubMed] [Google Scholar]
- 16. Ip Y. T.; Park R. E.; Kosan D.; Yazdanbakhsh K.; Levine M. dorsal-twist interactions establish snail expression in the presumptive mesoderm of the Drosophila embryo. Genes Dev. 6:1518–1530; 1992. [DOI] [PubMed] [Google Scholar]
- 17. Ip Y. T.; Park R. E.; Kosman D.; Bier E.; Levine M. The dorsal gradient morphogen regulates stripes of rhomboid expression in the presumptive neuroectoderm of the Drosophila embryo . Genes Dev. 6:1728–1739; 1992. [DOI] [PubMed] [Google Scholar]
- 18. Jiang J.; Levine M. Binding affinities and cooperative interactions with bHLH activators delimit threshold responses to the dorsal gradient morphogen. Cell 72:741–752; 1993. [DOI] [PubMed] [Google Scholar]
- 19. Jiang J. D.; Rushlow C. A.; Ip Y. T.; Levine M. The dorsal morphgen gradient regulates the mesoderm determinant twist in early Drosophila embryos. Genes Dev. 5:1881–1891; 1991. [DOI] [PubMed] [Google Scholar]
- 20. Kasai Y.; Nambu J. R.; Lieberman P. M.; Crews S. T. Dorsal-ventral patterning in Drosophila: DNA binding of snail protein to the single-minded gene. Proc. Natl. Acad. Sci. USA 89:3414–3418; 1992. [DOI] [PMC free article] [PubMed] [Google Scholar]
- 21. Klämbt C.; Jacobs J. R.; Goodman C. S. The midline of the Drosophila central nervous system: A model for the genetic analysis of cell fate, cell migration, and growth cone guidance. Cell 64:801–815; 1991. [DOI] [PubMed] [Google Scholar]
- 22. Kosman D.; Ip Y. T.; Levine M.; Arora K. Establishment of the mesoderm-neuroectoderm boundary in the Drosophila embryo. Science 254:118–122; 1991. [DOI] [PubMed] [Google Scholar]
- 23. Lecourtois M.; Schweisguth F. The neurogenic Suppressor of Hairless DNA-binding protein mediates the transcriptional activation of the Enhancer of split Complex genes triggered by Notch signaling. Genes Dev. 9:2598–2608; 1995. [DOI] [PubMed] [Google Scholar]
- 24. Leptin M. twist and snail as positive and negative regulators during Drosophila mesoderm development. Genes Dev. 5:1568–1576; 1991. [DOI] [PubMed] [Google Scholar]
- 25. Lewis J. O. The single-minded gene of Drosophila and its role in development of the embryonic central nervous system and larval muscles. Ph.D. thesis, University of California, Los Angeles; 1994. [Google Scholar]
- 26. Martin-Bermudo M. D.; Carmena A.; Jimenez F. Neurogenic genes control gene expression at the transcriptional level in early neurogenesis and in mesectoderm specification. Development 121:219–224; 1995. [DOI] [PubMed] [Google Scholar]
- 27. Menne T. V.; Klämbt C. The formation of commissures in the Drosophila CNS depends on the midline cells and on the Notch gene. Development 120:123–133; 1994. [DOI] [PubMed] [Google Scholar]
- 28. Muralidhar M. G.; Callahan C. A.; Thomas J. B. Single-minded regulation of genes in the embryonic mid-line of the Drosophila central nervous system. Mech. Dev. 41:129–138; 1993. [DOI] [PubMed] [Google Scholar]
- 29. Murre C.; Schonleber McCaw P.; Vaessin H.; Caudy M.; Jan L. Y.; Jan Y. N.; Cabrera C. V.; Buskin J. N.; Hauschka S. D.; Lassar A. B.; Weintraub H.; Baltimore D. Interactions between heterologous helix-loop-helix proteins generate complexes that bind specificaly to a common DNA sequence. Cell 58:537–544; 1989. [DOI] [PubMed] [Google Scholar]
- 30. Nambu J. R.; Franks R. G.; Hu S.; Crews S. T. The single-minded gene of Drosophila is required for the expression of genes important for the development of CNS midline cells. Cell 63:63–75; 1990. [DOI] [PubMed] [Google Scholar]
- 31. Nambu J. R.; Lewis J. L.; Wharton K. A.; Crews S. T. The Drosophila single-minded gene encodes a helix-loop-helix protein which acts as a master regulator of CNS midline development. Cell 67:1157–1167; 1991. [DOI] [PubMed] [Google Scholar]
- 32. Nambu J. R.; Lewis J. O.; Crews S. T. The development and function of the Drosophila CNS midline cells. Comp. Biochem. Physiol. 104A:399–409; 1993. [DOI] [PubMed] [Google Scholar]
- 33. Roth S.; Stein D.; Nusslein-Volhard C. A gradient of nuclear localization of the dorsal protein determines dorsoventral pattern in the Drosophila embryo. Cell 59:1189–1202; 1989. [DOI] [PubMed] [Google Scholar]
- 34. Rubin G. M.; Spradling A. C. Genetic transformation of Drosophila with transposable element vectors. Science 218:348–353; 1982. [DOI] [PubMed] [Google Scholar]
- 35. Rusch J.; Levine M. Threshold responses to the dorsal regulatory gradient and the subdivision of primary tissue territories in the Drosophila embryo. Curr. Opin. Genet. Dev. 6:416–423; 1996. [DOI] [PubMed] [Google Scholar]
- 36. Rushlow C.; Han K.; Manley J. L.; Levine M. The graded distribution of the dorsal morphogen is initiated by selective nuclear transport in Drosophila . Cell 59:1165–1177; 1989. [DOI] [PubMed] [Google Scholar]
- 37. Shirokawa J. M.; Courey A. J. A direct contact between the Dorsal rel homology domain and Twist may mediate transcriptional synergy. Mol. Cell. Biol. 17:3345–3455; 1997. [DOI] [PMC free article] [PubMed] [Google Scholar]
- 38. Smith D. B.; Johnson K. S. Single-step purification of polypeptides expressed in Escherichia coli as fusions with glutathione S-transferase. Gene 67:31–40; 1988. [DOI] [PubMed] [Google Scholar]
- 39. Sonnenfeld M.; Ward M.; Nystrom G.; Mosher J.; Stahl S.; Crews S. The Drosophila tango gene encodes a bHLH-PAS protein that is orthologous to mammalian Arnt and controls CNS midline and tracheal development. Development 124:4583–4594; 1997. [DOI] [PubMed] [Google Scholar]
- 40. Steward R. Dorsal, an embryonic polarity gene in Drosophila, is homologous to the vertebrate proto-oncogene, c-rel . Science 238:692–694; 1987. [DOI] [PubMed] [Google Scholar]
- 41. Steward R. Relocalization of the dorsal protein from the cytoplasm correlates with its function. Cell 59:1179–1188; 1989. [DOI] [PubMed] [Google Scholar]
- 42. Tautz D.; Pfeiffle C. A nonradioactive in situ hybridization method for the localization of specific RNAs in Drosophila embryos reveals translational control of the segmentation gene hunchback . Chromosoma 98:81–85; 1989. [DOI] [PubMed] [Google Scholar]
- 43. Thisse B.; Stoetzel C.; Gorostiza-Thisse C.; Perrin-Schmitt F. Sequence of the twist gene and nuclear localization of its protein in endomesodermal cells of early Drosophila embryos. EMBO J. 7:2175–2183; 1988. [DOI] [PMC free article] [PubMed] [Google Scholar]
- 44. Thomas J. B.; Crews S. T.; Goodman C. S. Molecular genetics of the single-minded locus: A gene involved in the development of the Drosophila nervous system. Cell 52:133–141; 1988. [DOI] [PubMed] [Google Scholar]
- 45. Thummel C. S.; Pirotta V. New pCaSpeR P element vectors. Drosophila Information Service 71:150; 1992. [Google Scholar]
- 46. Wharton K. A. Jr.; Crews S. T. CNS midline enhancers of the Drosophila slit and Toll genes. Mech. Dev. 40:141–154; 1993. [DOI] [PubMed] [Google Scholar]
- 47. Wharton K. A. Jr.; Franks R. G.; Kasai Y.; Crews S. T. Control of CNS midline transcription by asymmetric E-box elements: Similarity to xenobiotic responsive regulation. Development 120:3563–3569; 1994. [DOI] [PubMed] [Google Scholar]